
修改pyfolio樣式style
1.0 edit fontsize
{root}\venv\Lib\site-packages\pyfolio\plotting.py
def plotting_context(context='notebook', font_scale=1.0, rc=None):
line 58, scale the fontsize
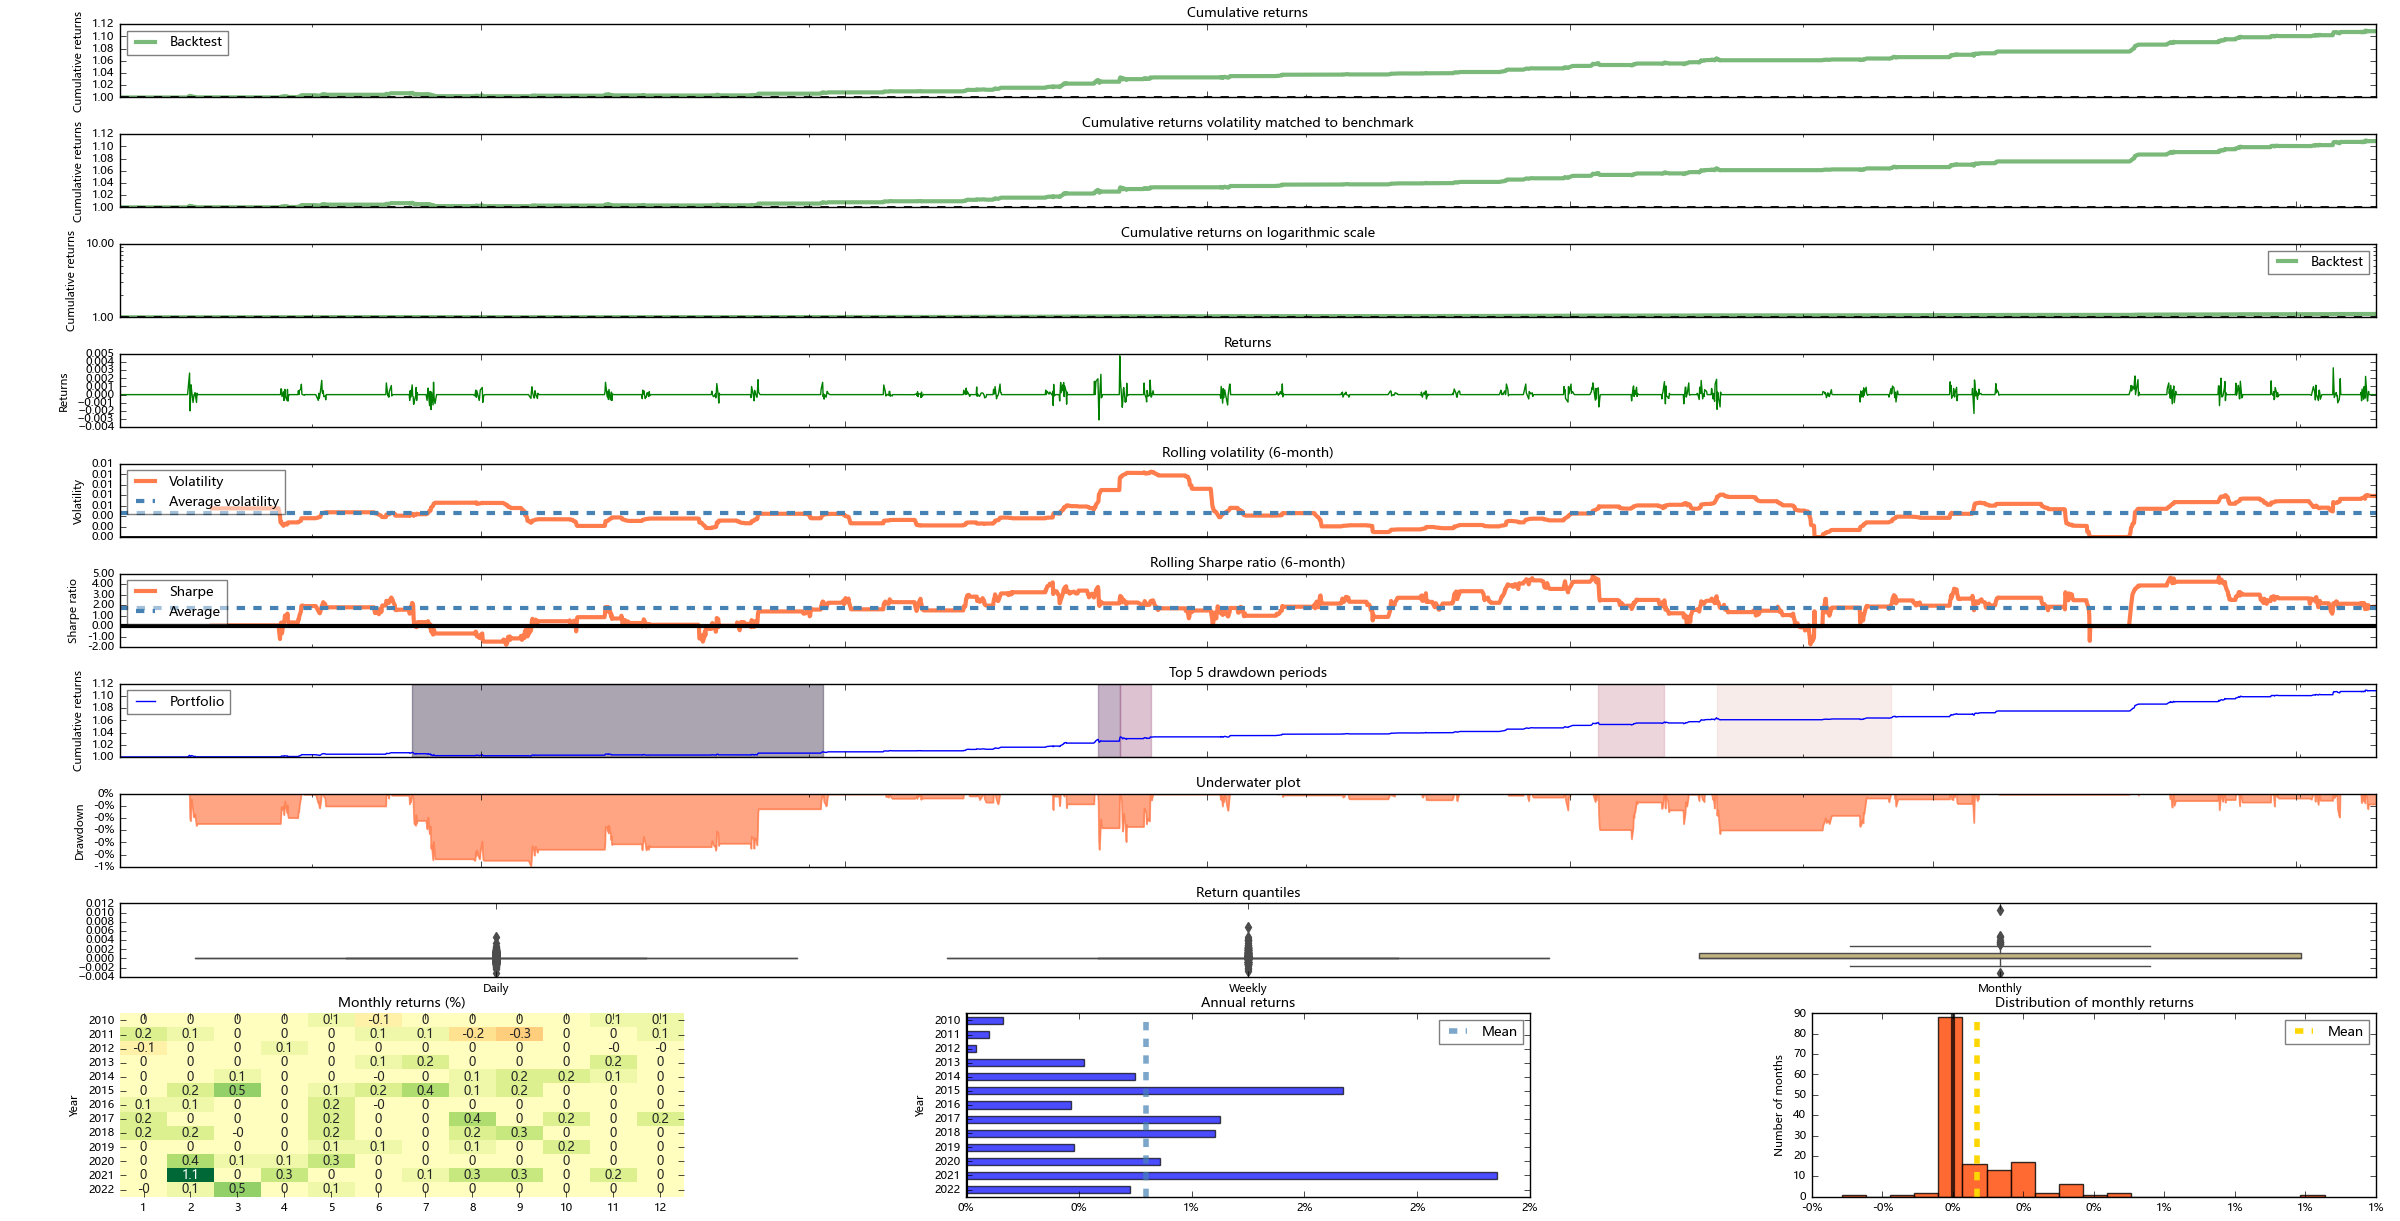
2.0 edit sheet layout
{root}\venv\Lib\site-packages\pyfolio\tears.py
    plt.style.use('classic')
    plt.rcParams['font.sans-serif'] = ['Microsoft YaHei']
    plt.rcParams.update({'font.size': 8})
    fig = plt.figure(figsize=(14, vertical_sections * 6))
    gs = gridspec.GridSpec(vertical_sections, 3, wspace=0.5, hspace=0.5)
    gs.update(left=0.05, right=0.99, top=0.98, bottom=0.02)
    ax_rolling_returns = plt.subplot(gs[:1, :])

    i = 1
line 518, change plot layout
3.0 change subplot order
    ax_return_quantiles = plt.subplot(gs[i, :])
    i += 1
    ax_monthly_heatmap = plt.subplot(gs[-2:, 0])
    ax_annual_returns = plt.subplot(gs[-2:, 1])
    ax_monthly_dist = plt.subplot(gs[-2:, 2])
    i += 1
line 541, change order
4.0 change heatmap y_label rotation
{root}\venv\Lib\site-packages\pyfolio\plotting.py
g.set_yticklabels(g.get_yticklabels(), rotation = 0)
line 182, add rotation
5.0 Complete

 浙公网安备 33010602011771号