Prometheus的搭建与使用
Prometheus是由谷歌研发的一款开源的监控软件,它通过安装在远程机器上的exporter,通过HTTP协议从远程的机器收集数据并存储在本地的时序数据库上。目前已经被云计算本地基金会托管,是继k8s托管的第二个项目,号称是下一代监控。
2.Prometheus架构图
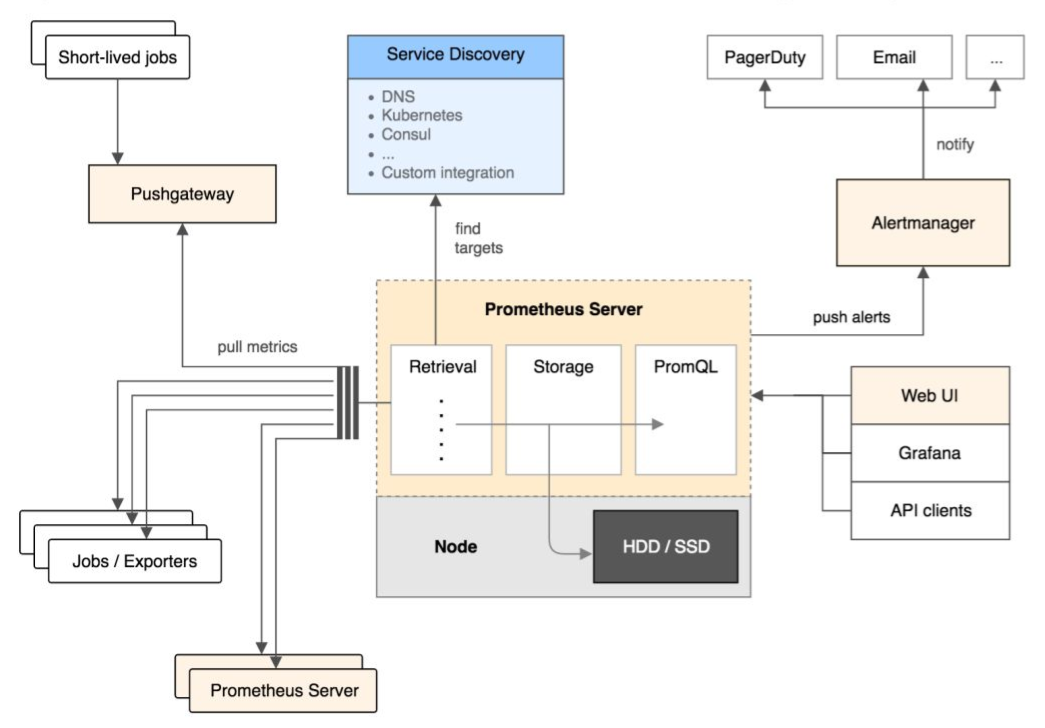
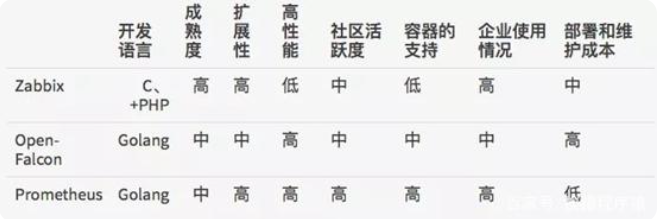
3.Prometheus优缺点
Prometheus使用在多维度上灵活的查询语言(PromQl)。PromQL (Prometheus Query Language) 是 Prometheus 自己开发的数据查询 DSL 语言。
Prometheus具有易管理、易集成、可扩展、支持自动发信等优势。
同时Prometheus后端用 golang语言开发,前端是 Grafana,二次开发需要掌握相关语言。
Prometheus的流行和Kubernetes密不可分,支持对Kubernetes、容器、OpenStack的监控。
4.Prometheus官网
5.Prometheus的部署
1.下载Prometheus:wget https://github.com/prometheus/prometheus/releases/download/v2.30.3/prometheus-2.30.3.linux-amd64.tar.gz
2.解压:tar xf prometheus-2.30.3.linux-amd64.tar.gz -C /usr/local/ && mv /usr/local/prometheus-2.30.3.linux-amd64 /usr/local/prometheus
3.运行:/usr/local/prometheus/prometheus --config.file="/usr/local/prometheus/prometheus.yml"
[root@k8s-node2:10.200.202.196 ~]# lsof -i:9090
COMMAND    PID USER   FD   TYPE   DEVICE SIZE/OFF NODE NAME
prometheu 2296 root    7u  IPv6 27875607      0t0  TCP *:websm (LISTEN)
prometheu 2296 root   10u  IPv6 27877535      0t0  TCP localhost:51698->localhost:websm (ESTABLISHED)
prometheu 2296 root   11u  IPv6 27873732      0t0  TCP localhost:websm->localhost:51698 (ESTABLISHED)
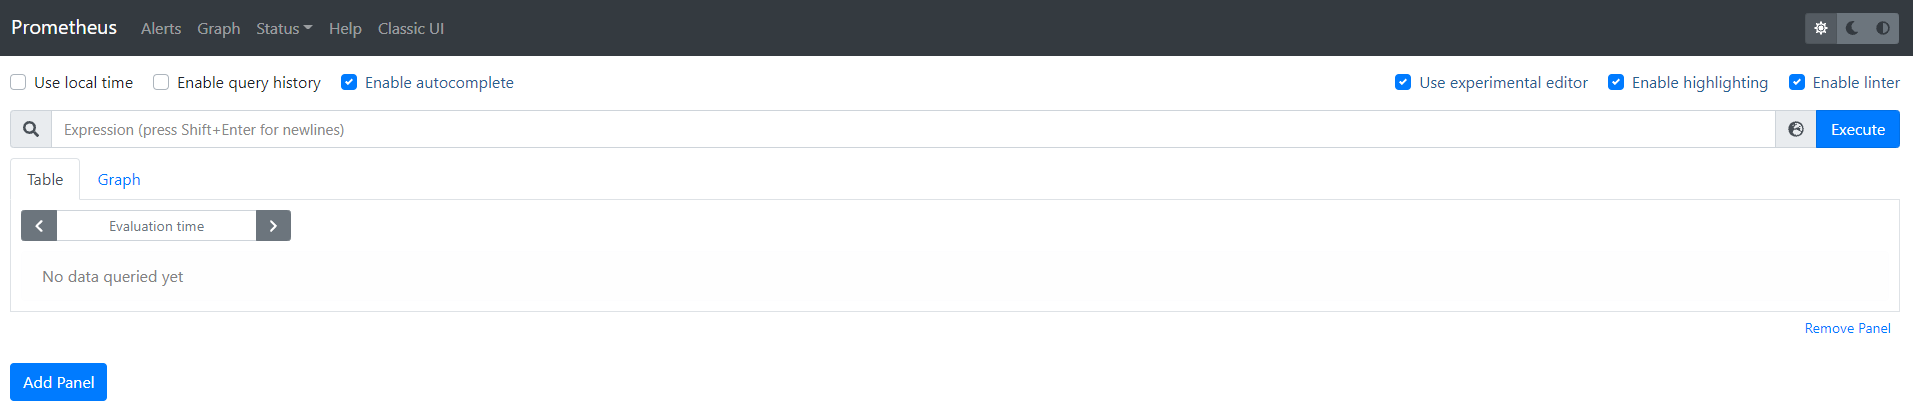
6.访问Prometheus web
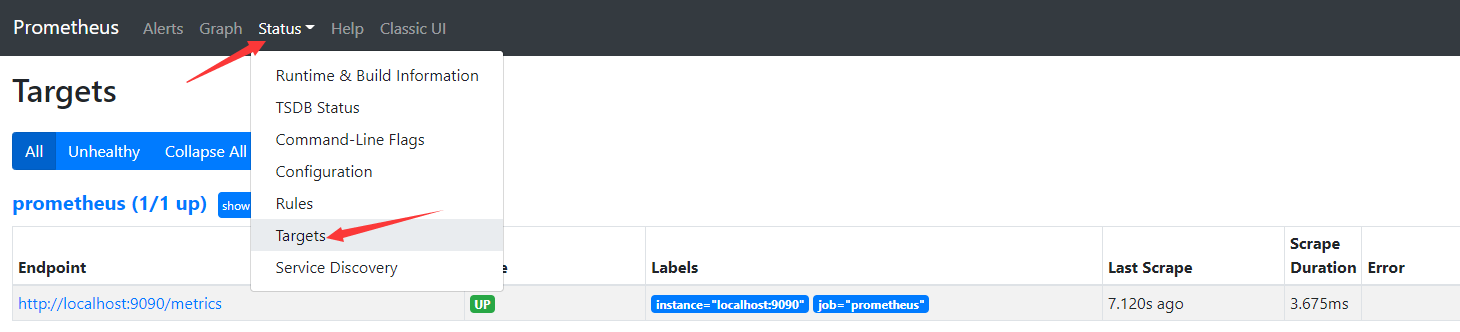
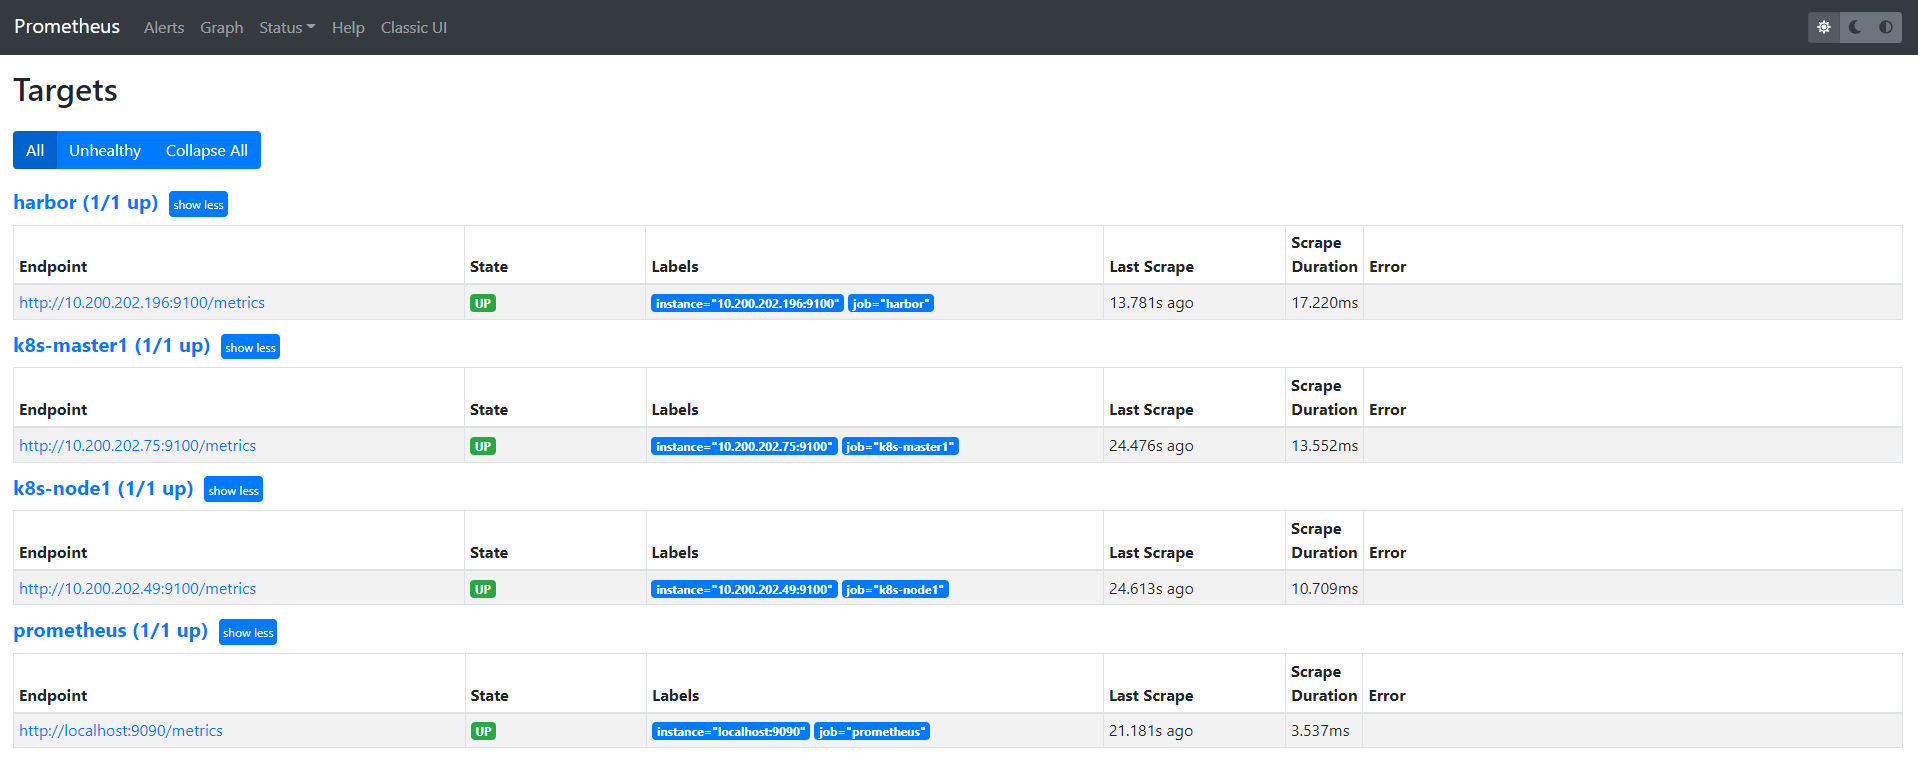
7.查看已监控机器Targets
默认只监控了本机 点击Status -->Targets
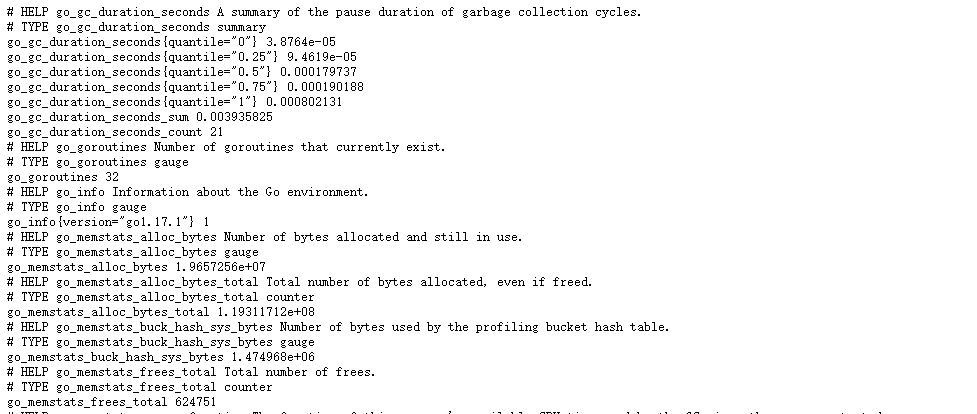
8.通过http获取主机监控数据
http://10.200.202.196:9090/metrics
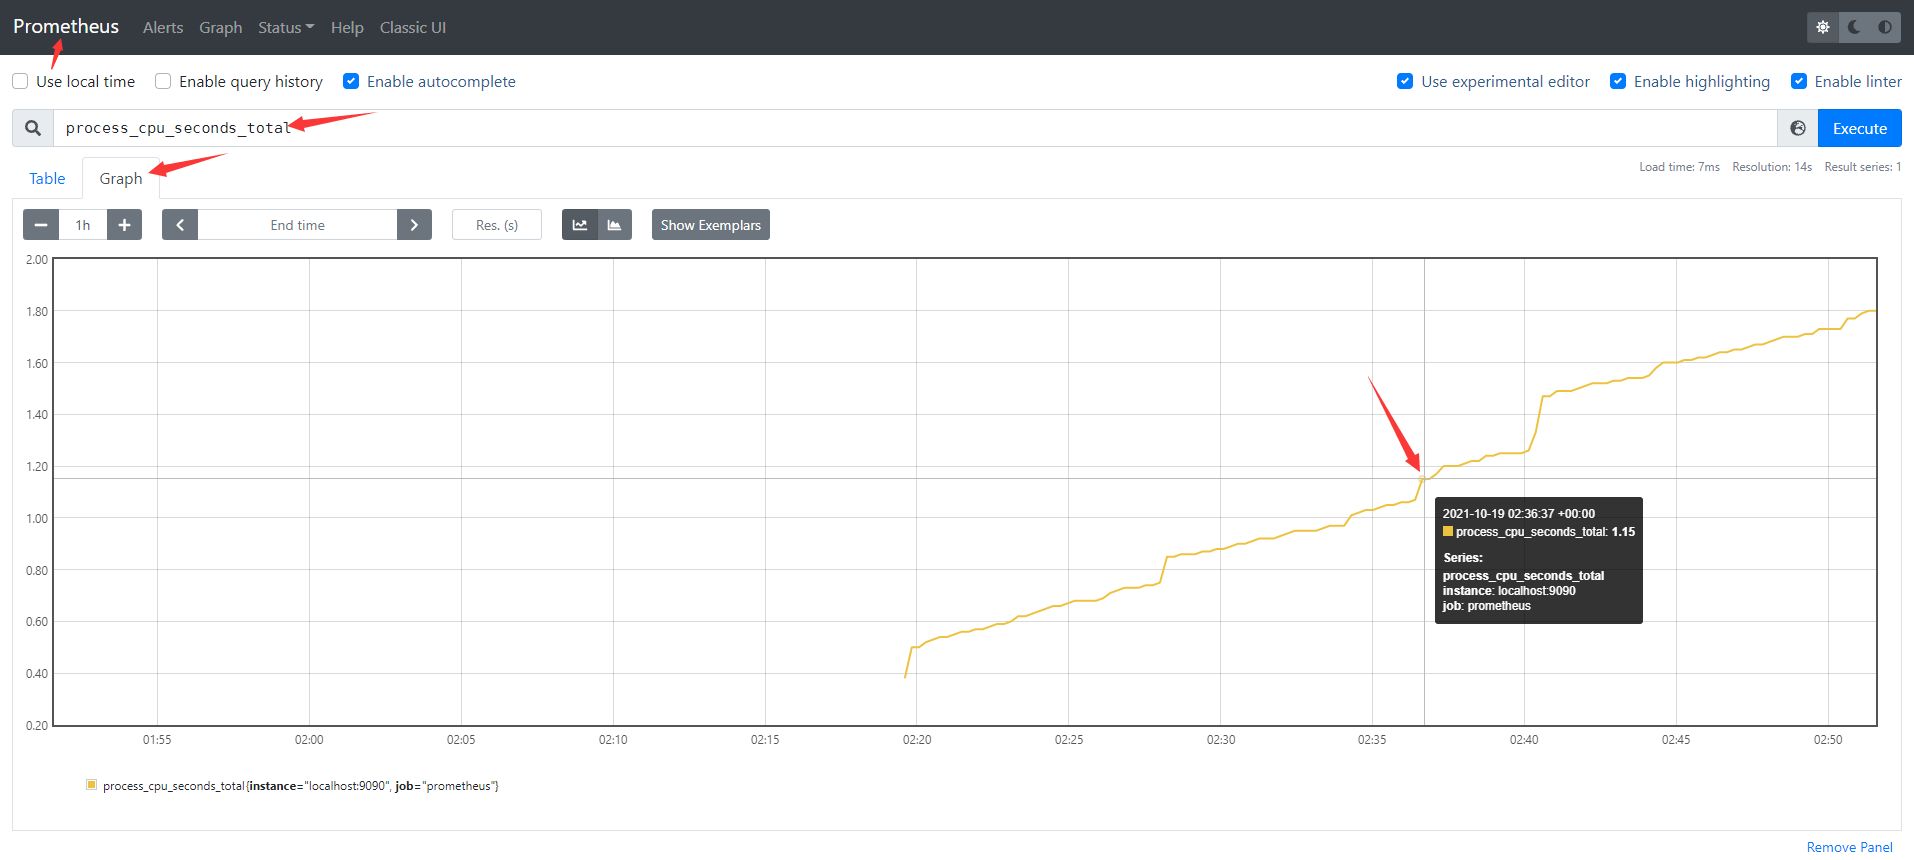
9.在Web界面可以通过关键字查询监控项
10.监控远程linux主机
1.下载node_exporter:wget https://github.com/prometheus/node_exporter/releases/download/v1.2.2/node_exporter-1.2.2.linux-amd64.tar.gz
2.解压node_exporter:tar xf node_exporter-1.2.2.linux-amd64.tar.gz && mv node_exporter-1.2.2.linux-amd64 /usr/local/node_exporter
3.启动node_exporter:/usr/local/node_exporter
4.通过浏览器访问http://10.200.202.49:9100/metrics可以查看到node_exporter在被监控端手机的监控信息
11.回到Prometheus服务器配置文件添加客户端的配置段
vim /usr/local/prometheus/prometheus.yml
12.重启Prometheus
/usr/local/prometheus/prometheus --config.file="/usr/local/prometheus/prometheus.yml"
13.查看已监控主机
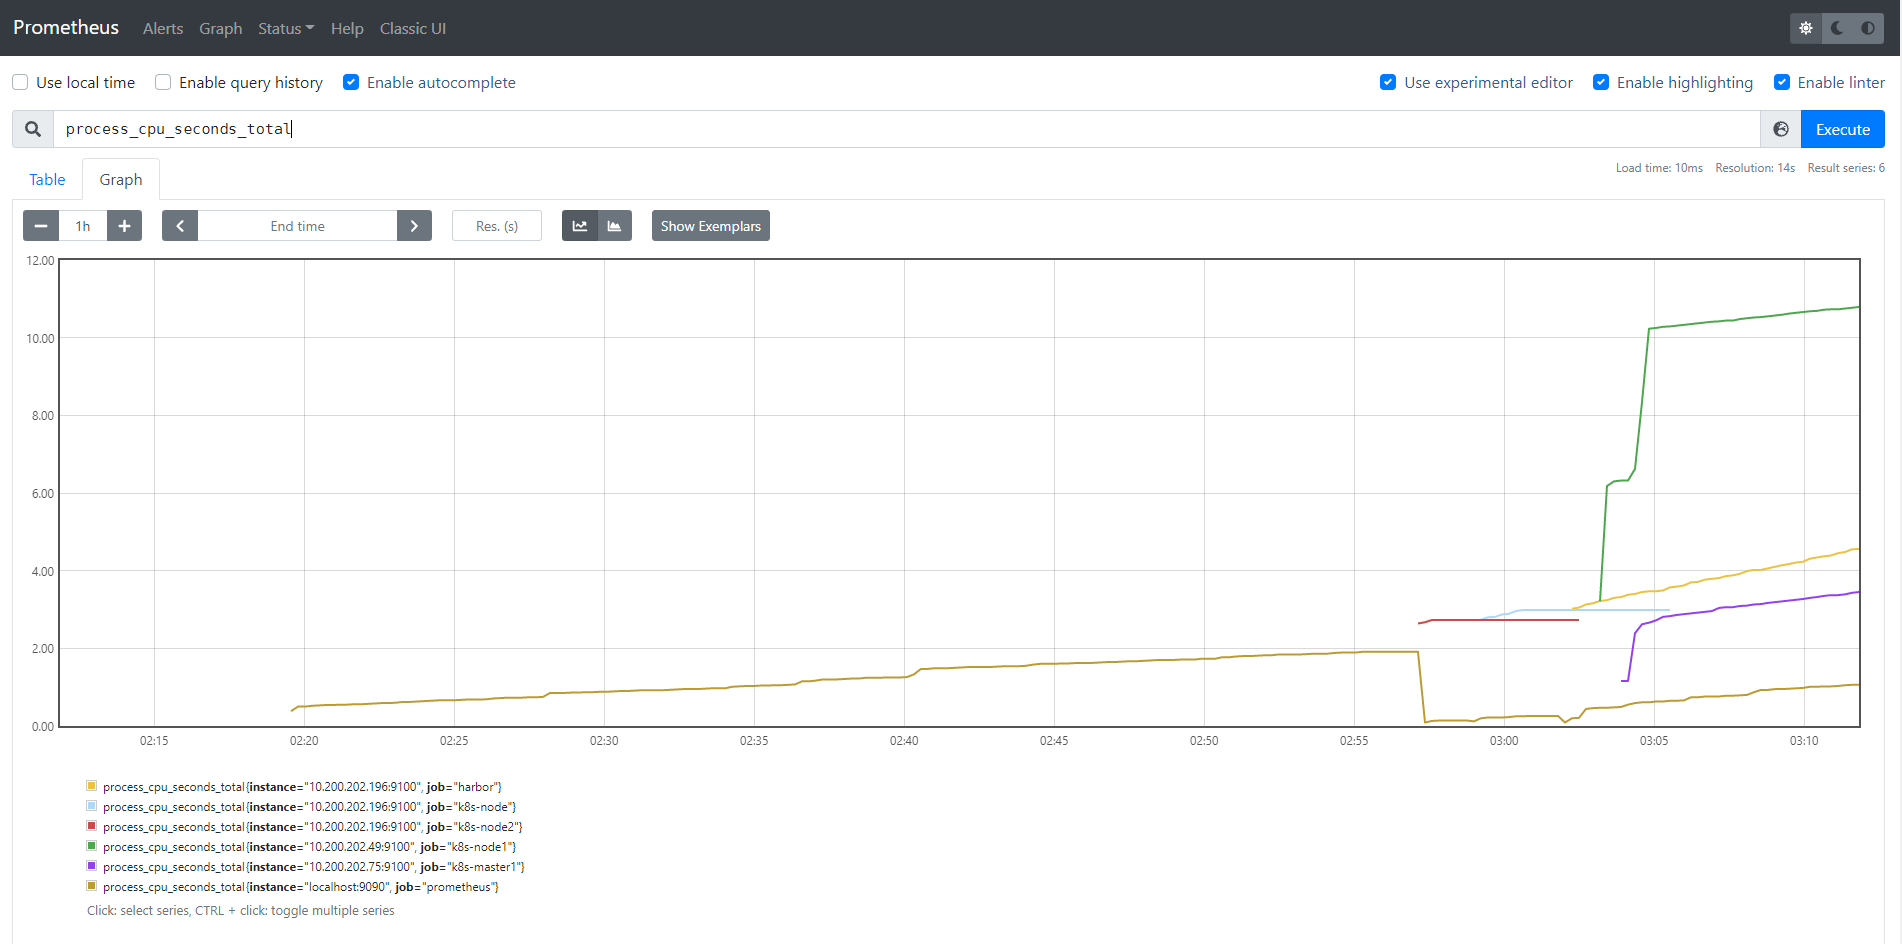
14.查看数据图表
15.监控远程MySQL
# 在Client上安装mysqld_exporter组件和MySQL
# 下载地址:https://github.com/prometheus/mysqld_exporter/releases/download/v0.13.0/mysqld_exporter-0.13.0.linux-amd64.tar.gz
[root@client ~]# tar -xf mysqld_exporter-0.13.0.linux-amd64.tar.gz -C /usr/local/
[root@client ~]# mv /usr/local/mysqld_exporter-0.13.0.linux-amd64/ /usr/local/mysqld_exporter
[root@client ~]# yum -y install mariadb\*
# 启动MySQL并授权
[root@client ~]# systemctl restart mariadb
[root@client ~]# mysql -uroot
MariaDB [(none)]> grant select,replication client,process on *.* to 'mysql_monitor'@'localhost' identified by '123.com';
#授权IP为localhost,因为不是prometheus服务器直接找mariadb获取数据,而是prometheus服务器找mysql_exporter,mysql_exporter再找mariadb。所以这个localhost是指的mysql_exporter的IP
MariaDB [(none)]> flush privileges;
Query OK, 0 rows affected (0.00 sec)
# 创建一个mariadb配置文件,写上刚刚授权的用户名和密码
[root@client ~]# vim /usr/local/mysqld_exporter/.my.cnf
[client]
user=mysql_monitor
password=123.com
# 启动mysqld_exporter
[root@client ~]# nohup /usr/local/mysqld_exporter/mysqld_exporter --config.my-cnf=/usr/local/mysqld_exporter/.my.cnf &
[root@client ~]# lsof -i:9104
COMMAND PID USER FD TYPE DEVICE SIZE/OFF NODE NAME
mysqld_ex 60421 root 3u IPv6 111828 0t0 TCP *:peerwire (LISTEN)
# 在Prometheus服务器的配置文件里添加被监控的mariadb的配置段
[root@prometheus ~]# vim /usr/local/prometheus/prometheus.yml
- job_name: 'mariadb'
static_configs:
- targets: ['10.10.11.113:9104']
[root@prometheus ~]# pkill prometheus
[root@prometheus ~]# /usr/local/prometheus/prometheus --config.file="/usr/local/prometheus/prometheus.yml"
# 回到web管理界面 -->点Status -->点Targets -->可以看到监控mariadb了
16.安装Grafana
https://grafana.com/docs/grafana/latest/installation/rpm/
# 配置yum仓库
vim /etc/yum.repos.d/grafana.repo
[grafana]
name=grafana
baseurl=https://packages.grafana.com/enterprise/rpm
repo_gpgcheck=1
enabled=1
gpgcheck=1
gpgkey=https://packages.grafana.com/gpg.key
sslverify=1
sslcacert=/etc/pki/tls/certs/ca-bundle.crt

# 安装grafana
yum install -y grafana-enterprise

# 启动grafana
systemctl daemon-reload
systemctl start grafana-server
systemctl status grafana-server
systemctl enable grafana-server

[root@k8s-node2:10.200.202.196 ~]# lsof -i:3000
COMMAND     PID    USER   FD   TYPE   DEVICE SIZE/OFF NODE NAME
grafana-s 52262 grafana    8u  IPv6 28255553      0t0  TCP *:hbci (LISTEN)
17.访问Grafana
http://10.200.202.196:3000/
默认账号密码:admin admin

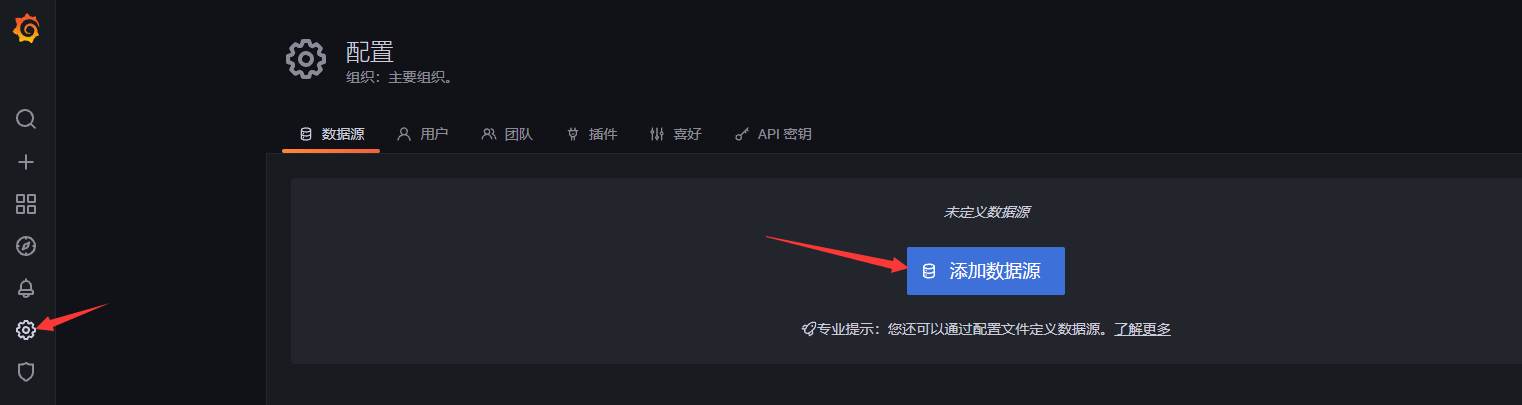
18.Grafana连接Prometheus
将Prometheus服务器收集到的数据作为一个数据源添加到grafana,让grafana可以得到Prometheus的数据
添加数据源
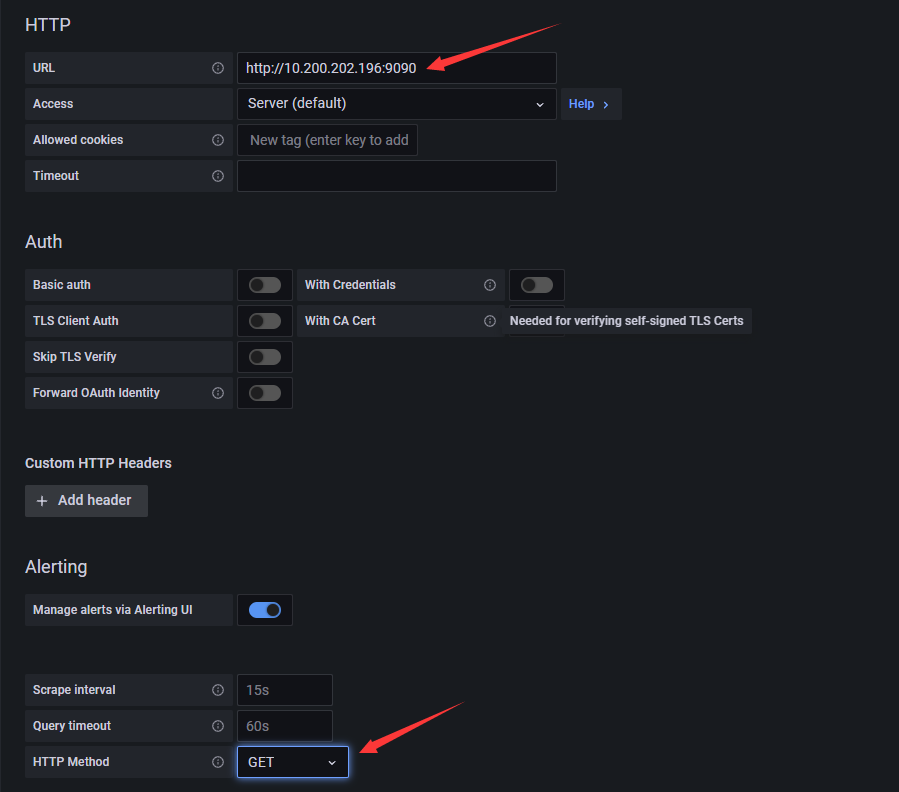
配置数据源
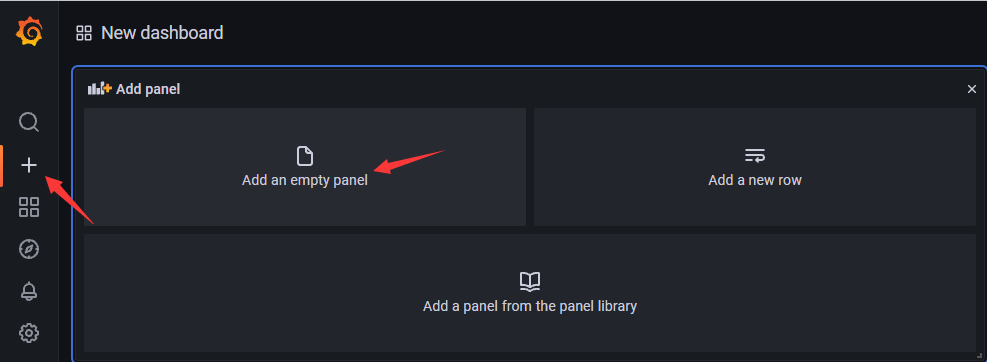
添加图表
配置图表
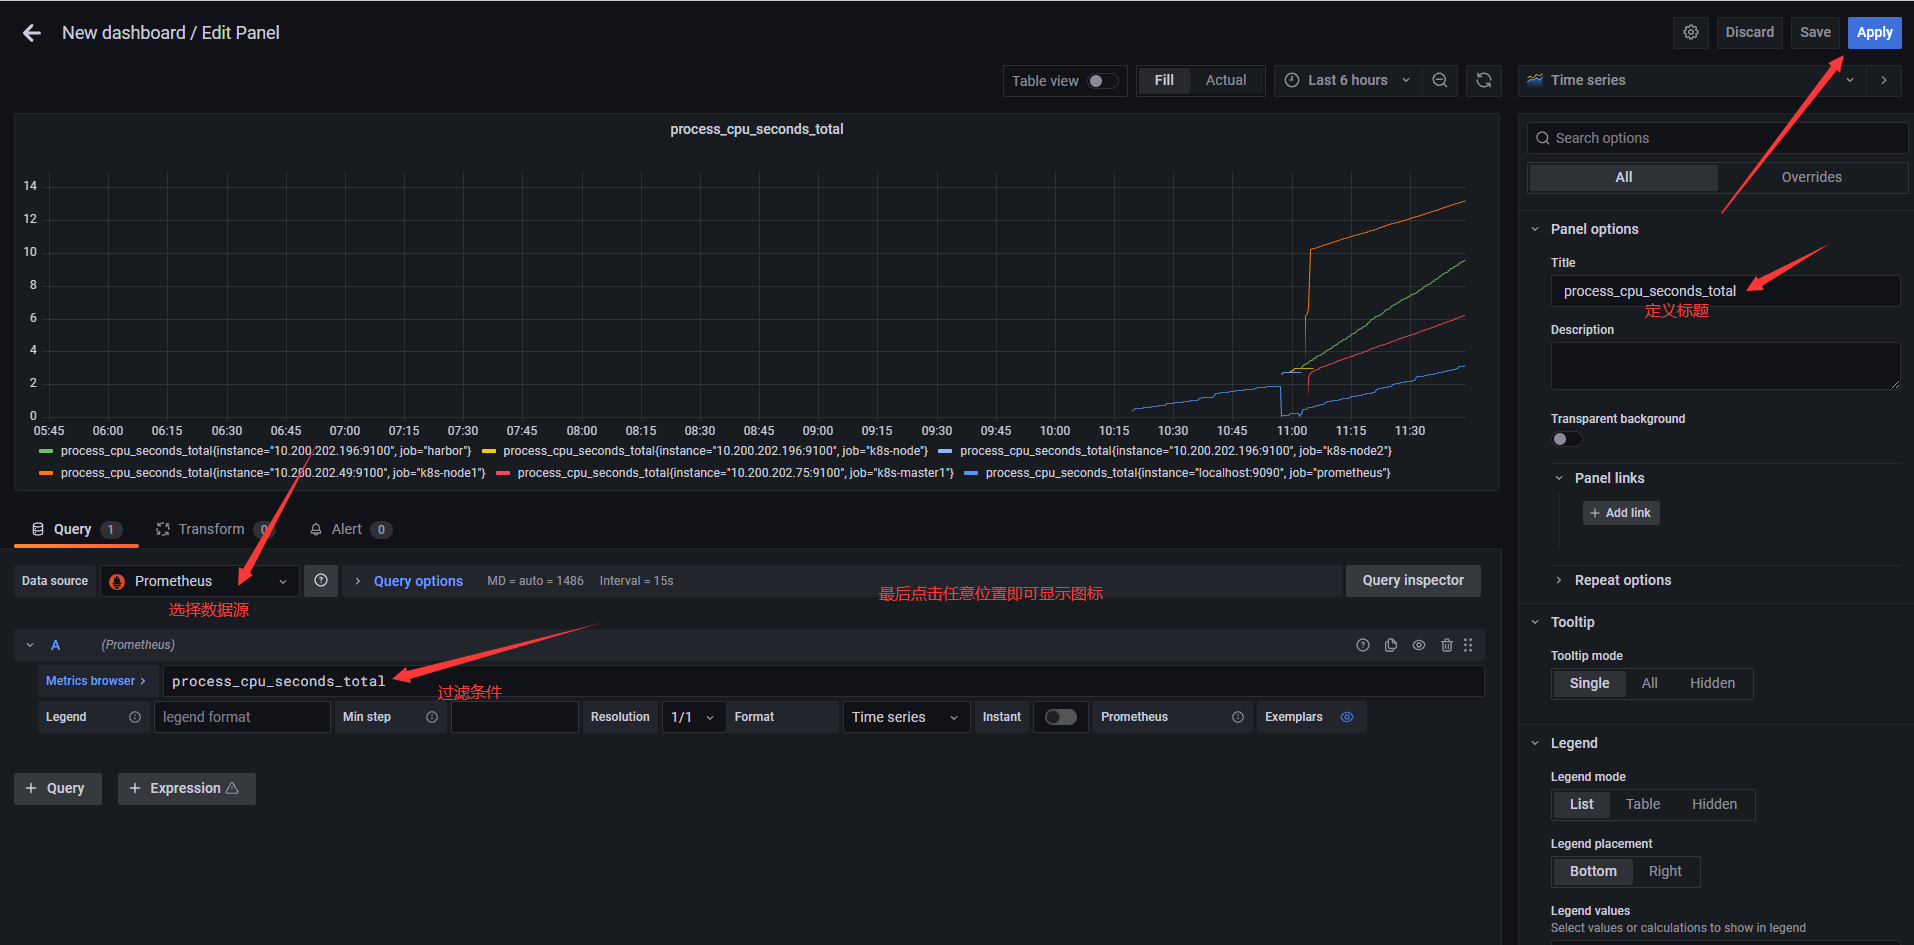
配置好图表后记得保存仪表板
一些事情一直在干,说不定以后就结果了呢
本文来自博客园,作者:chenjianwen,转载请注明原文链接:https://www.cnblogs.com/chenjw-note/p/15424215.html

 浙公网安备 33010602011771号