安装 Prometheus监控主机服务
一、安装 Prometheus
下载 Prometheus
首先,访问 Prometheus 官网 获取最新版本的下载链接,然后使用 wget 下载:
解压并安装
解压下载的文件:
将解压后的文件夹移动到 /opt/prometheus:
安装 htpasswd 来生成密码 hash
在 prometheus目录下执行
创建配置文件
创建 Prometheus 用户
为了安全,创建一个专用用户来运行 Prometheus:
配置 Prometheus
编辑 Prometheus 配置文件 /opt/prometheus/prometheus.yml:
添加以下内容:
创建 Systemd 服务文件 /etc/systemd/system/prometheus.service:
添加以下内容:
启动并设置开机启用 Prometheus 服务:
访问
二、安装 Node Exporter
Node Exporter 用于收集系统指标(如 CPU、内存使用率)。
下载 Node Exporter
解压并安装
在node_exporter目录下执行
创建配置文件
创建 Systemd 服务
创建 Systemd 服务文件 /etc/systemd/system/node_exporter.service:
添加以下内容:
启动 Node Exporter
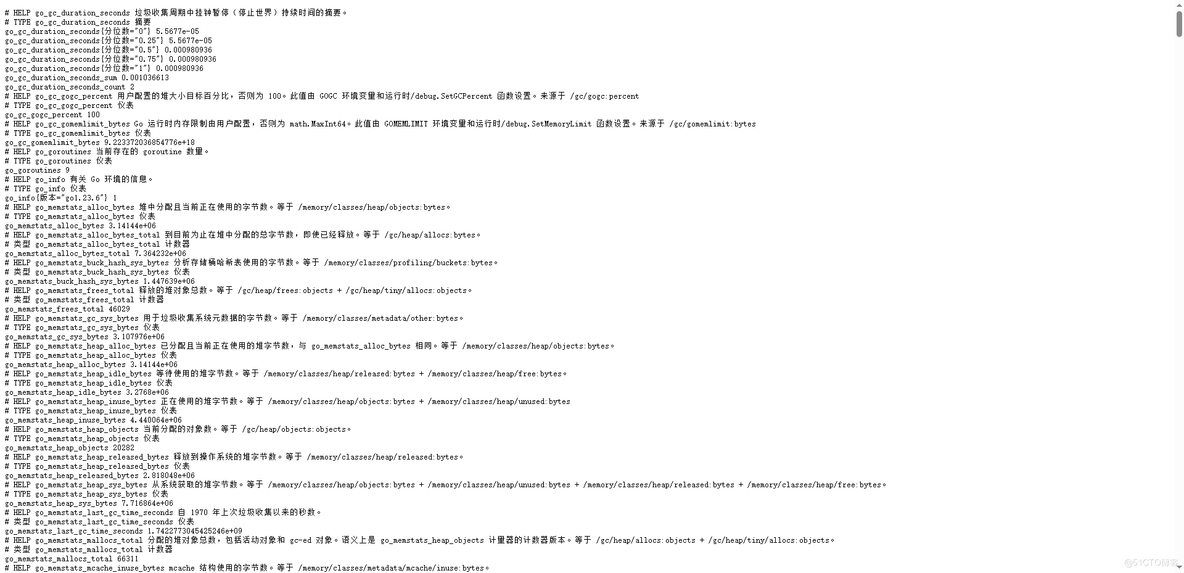
验证 Node Exporter
访问 http://<服务器IP>:9100/metrics,如果看到系统指标数据,说明安装成功。
三、安装 Grafana
下载并安装 Grafana
启动 Grafana服务
web界面访问
访问 Grafana
访问 http://<服务器IP>:3000,使用默认账号 admin 和密码 admin 登录。

四、配置 Grafana 仪表盘
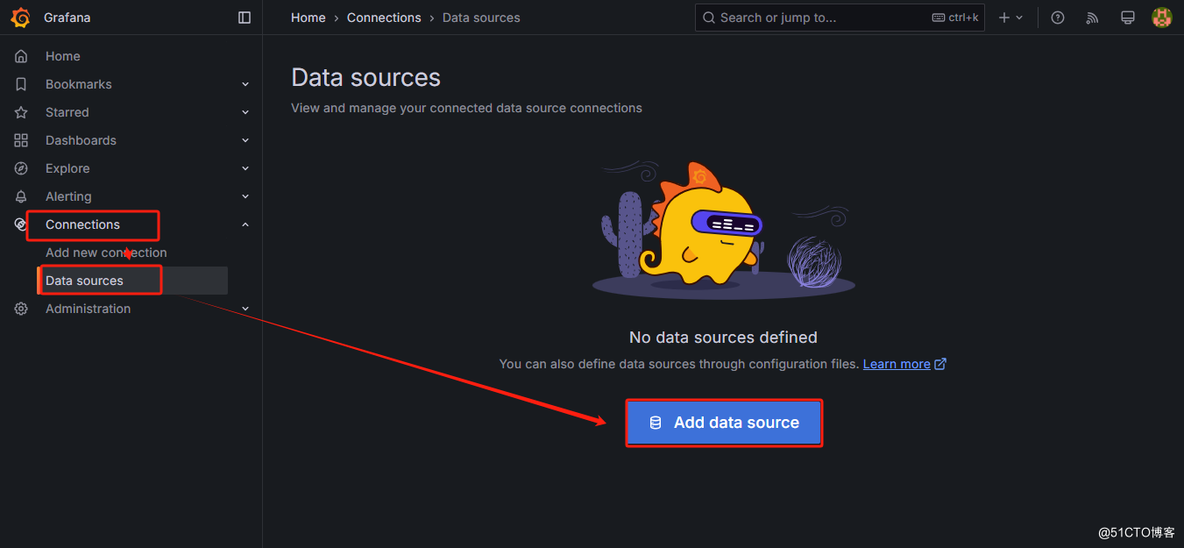
登录 Grafana,点击左侧菜单的 Configuration > Data Sources。
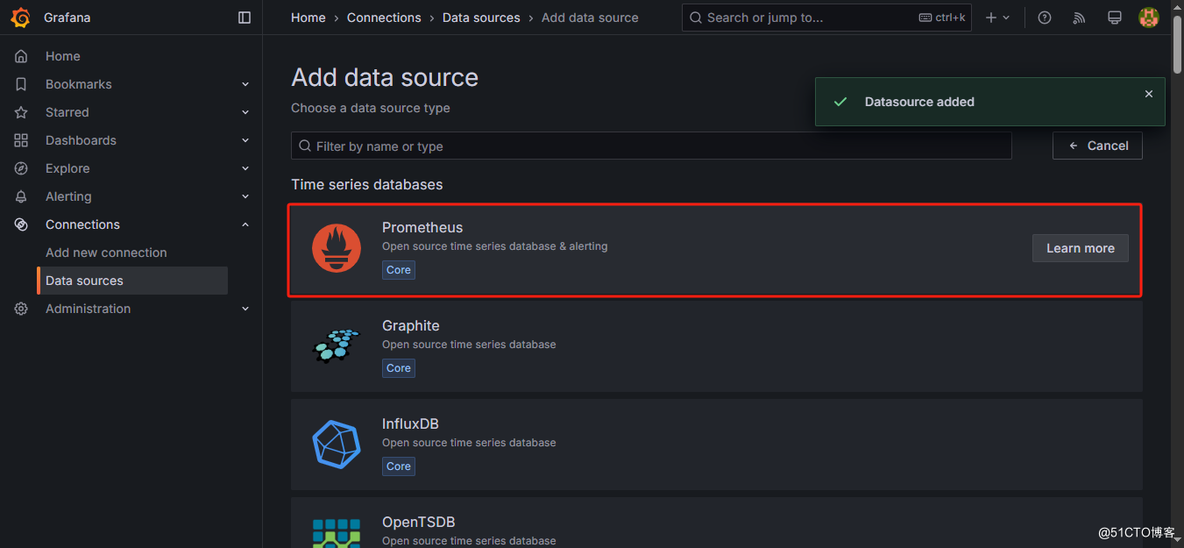
点击 Add data source,
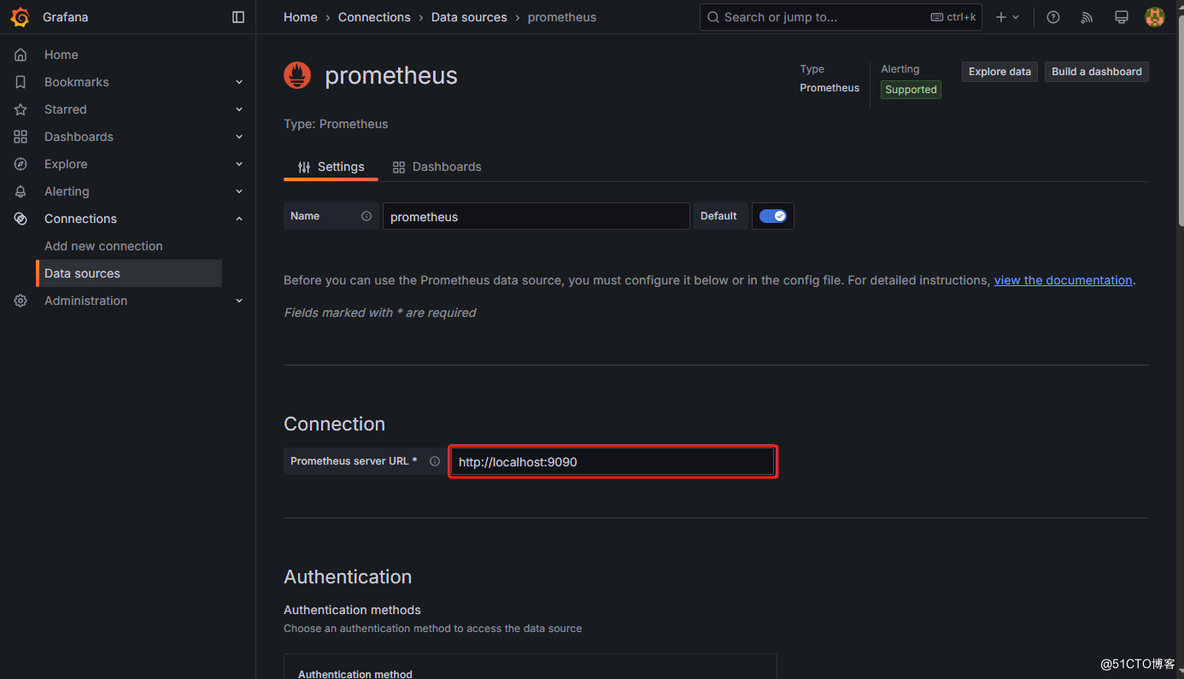
选择 Prometheus
在 URL 中输入 http://localhost:9090,点击 Save & Test。

导入 Node Exporter 仪表盘
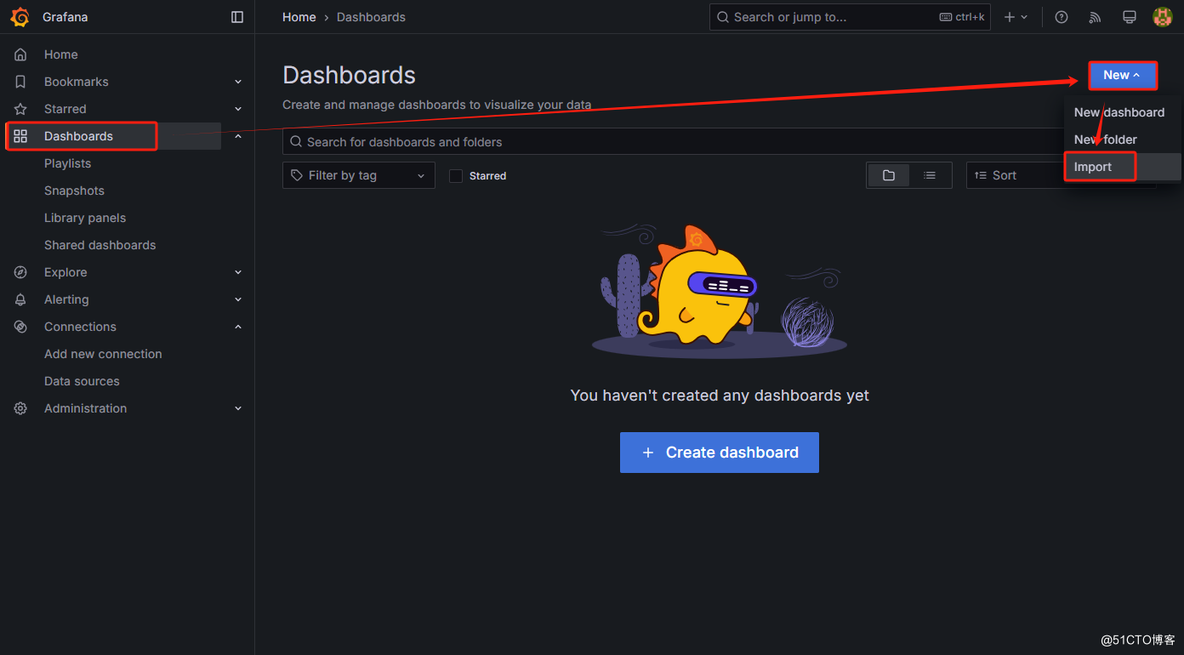
在 dashboad页面点击 Create > Import。
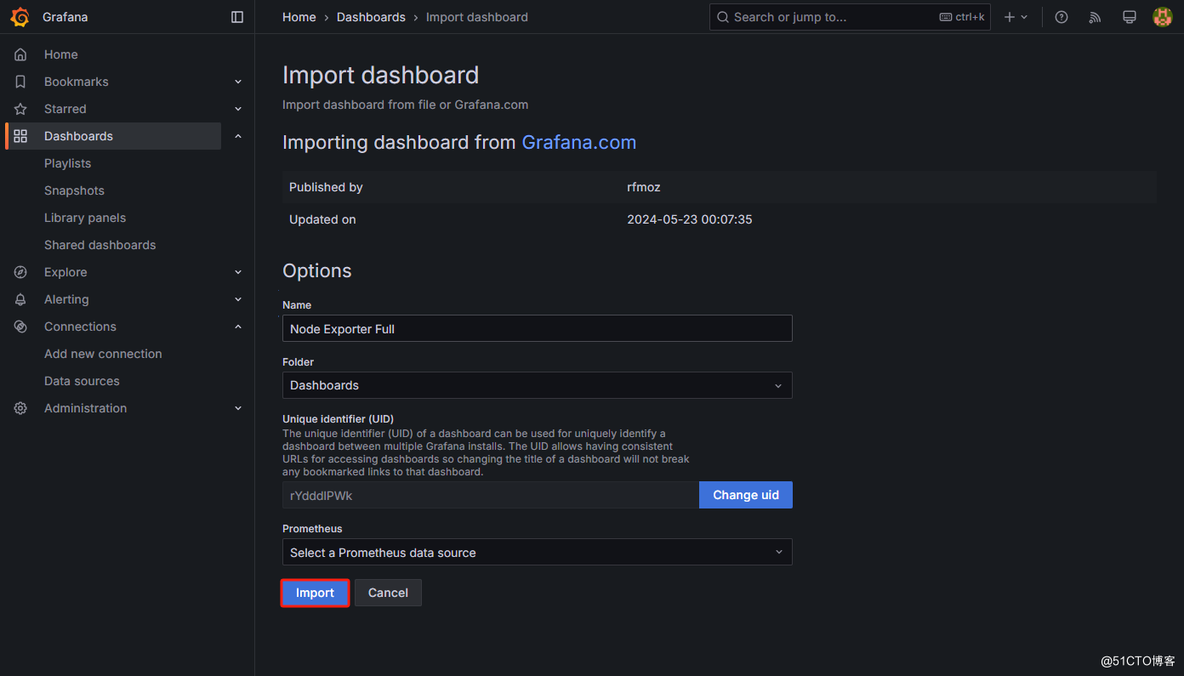
在 Import via grafana.com 中输入仪表盘 ID 1860(Node Exporter 官方仪表盘)。
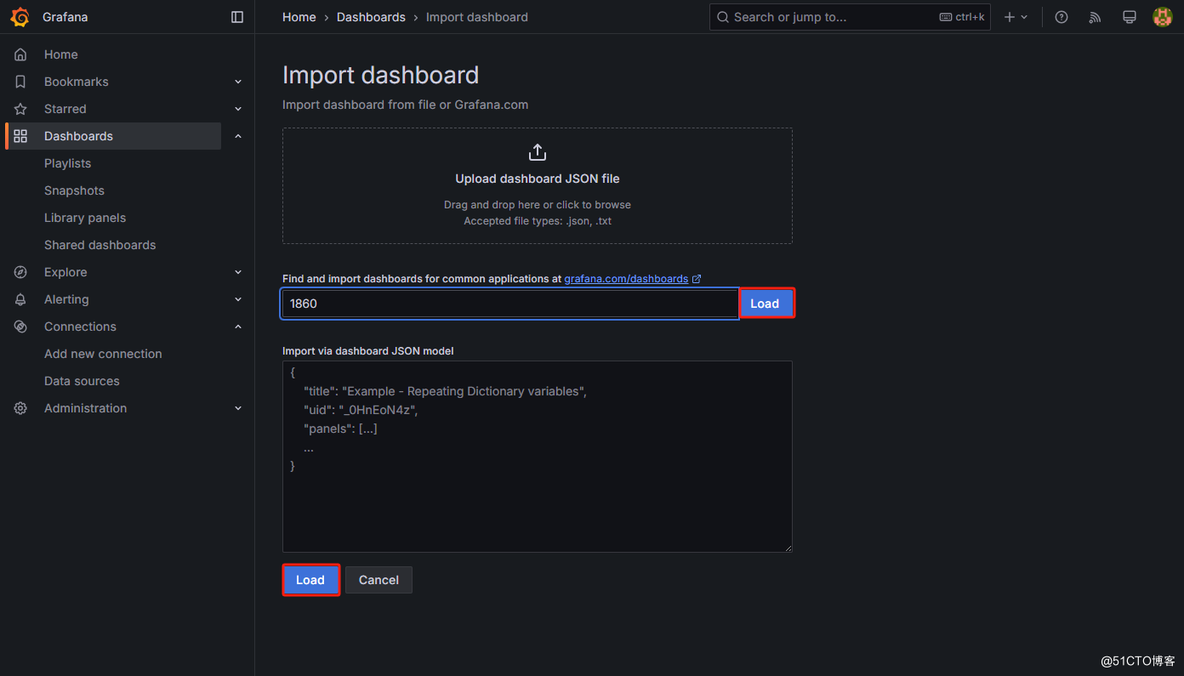
选择 Prometheus 数据源,点击 Import。
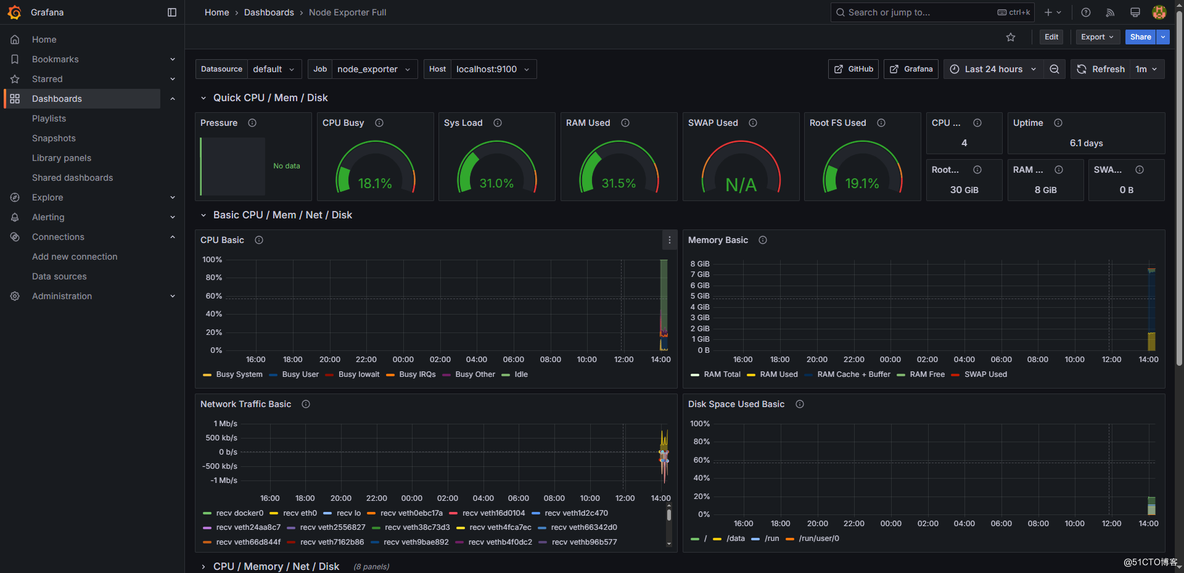
查看仪表盘
导入成功后,你可以看到一个完整的系统监控仪表盘,包含 CPU、内存、磁盘、网络等指标。

 浙公网安备 33010602011771号