python使用matplotlib和numpy输出坐标图_双函数
效果图:
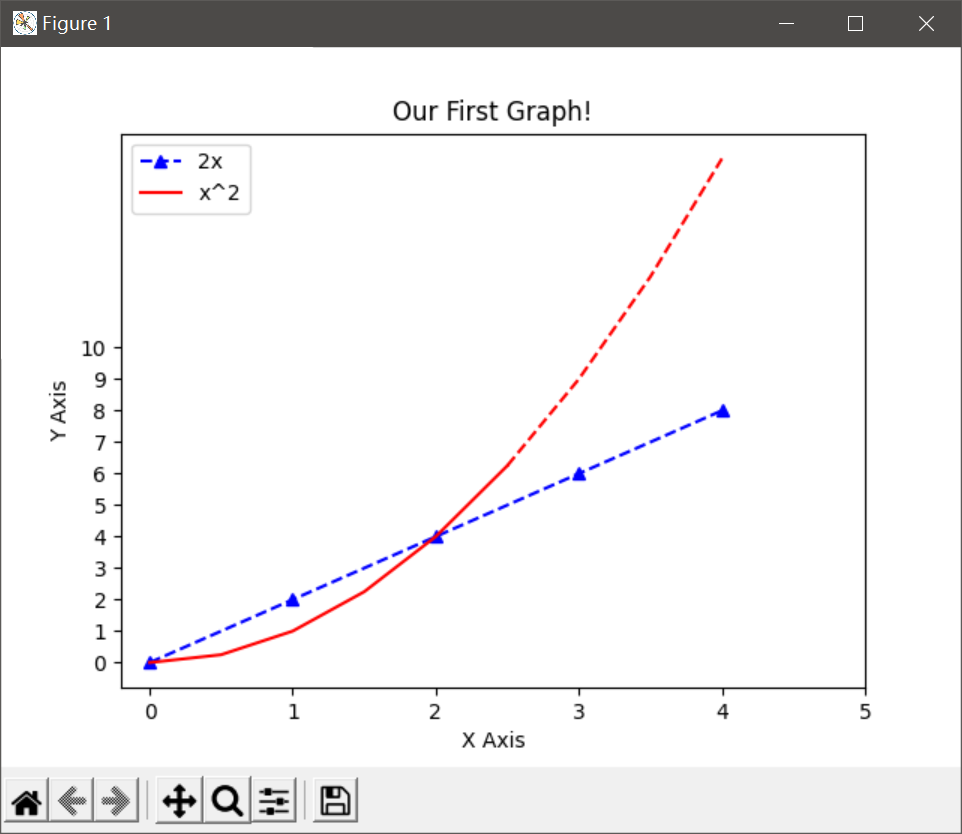
代码实例:
from matplotlib import pyplot as plt
import numpy as np
x1=[0,1,2,3,4]
y1=[0,2,4,6,8]
x2=np.arange(0,4.5,0.5)
plt.title('Our First Graph!')
plt.xlabel('X Axis')
plt.ylabel('Y Axis')
plt.plot(x1,y1,'b^--',label='2x',)
plt.plot(x2[:6],x2[:6]**2,'r',label='x^2')
plt.plot(x2[5:],x2[5:]**2,'r--')
plt.legend(loc = "upper left")
plt.xticks(range(6))
plt.yticks(range(11))
plt.savefig('image/tu2.png')
plt.show()
专心看人间!

 浙公网安备 33010602011771号