Bump Charts with Tableau or Matplotlib
摘要:
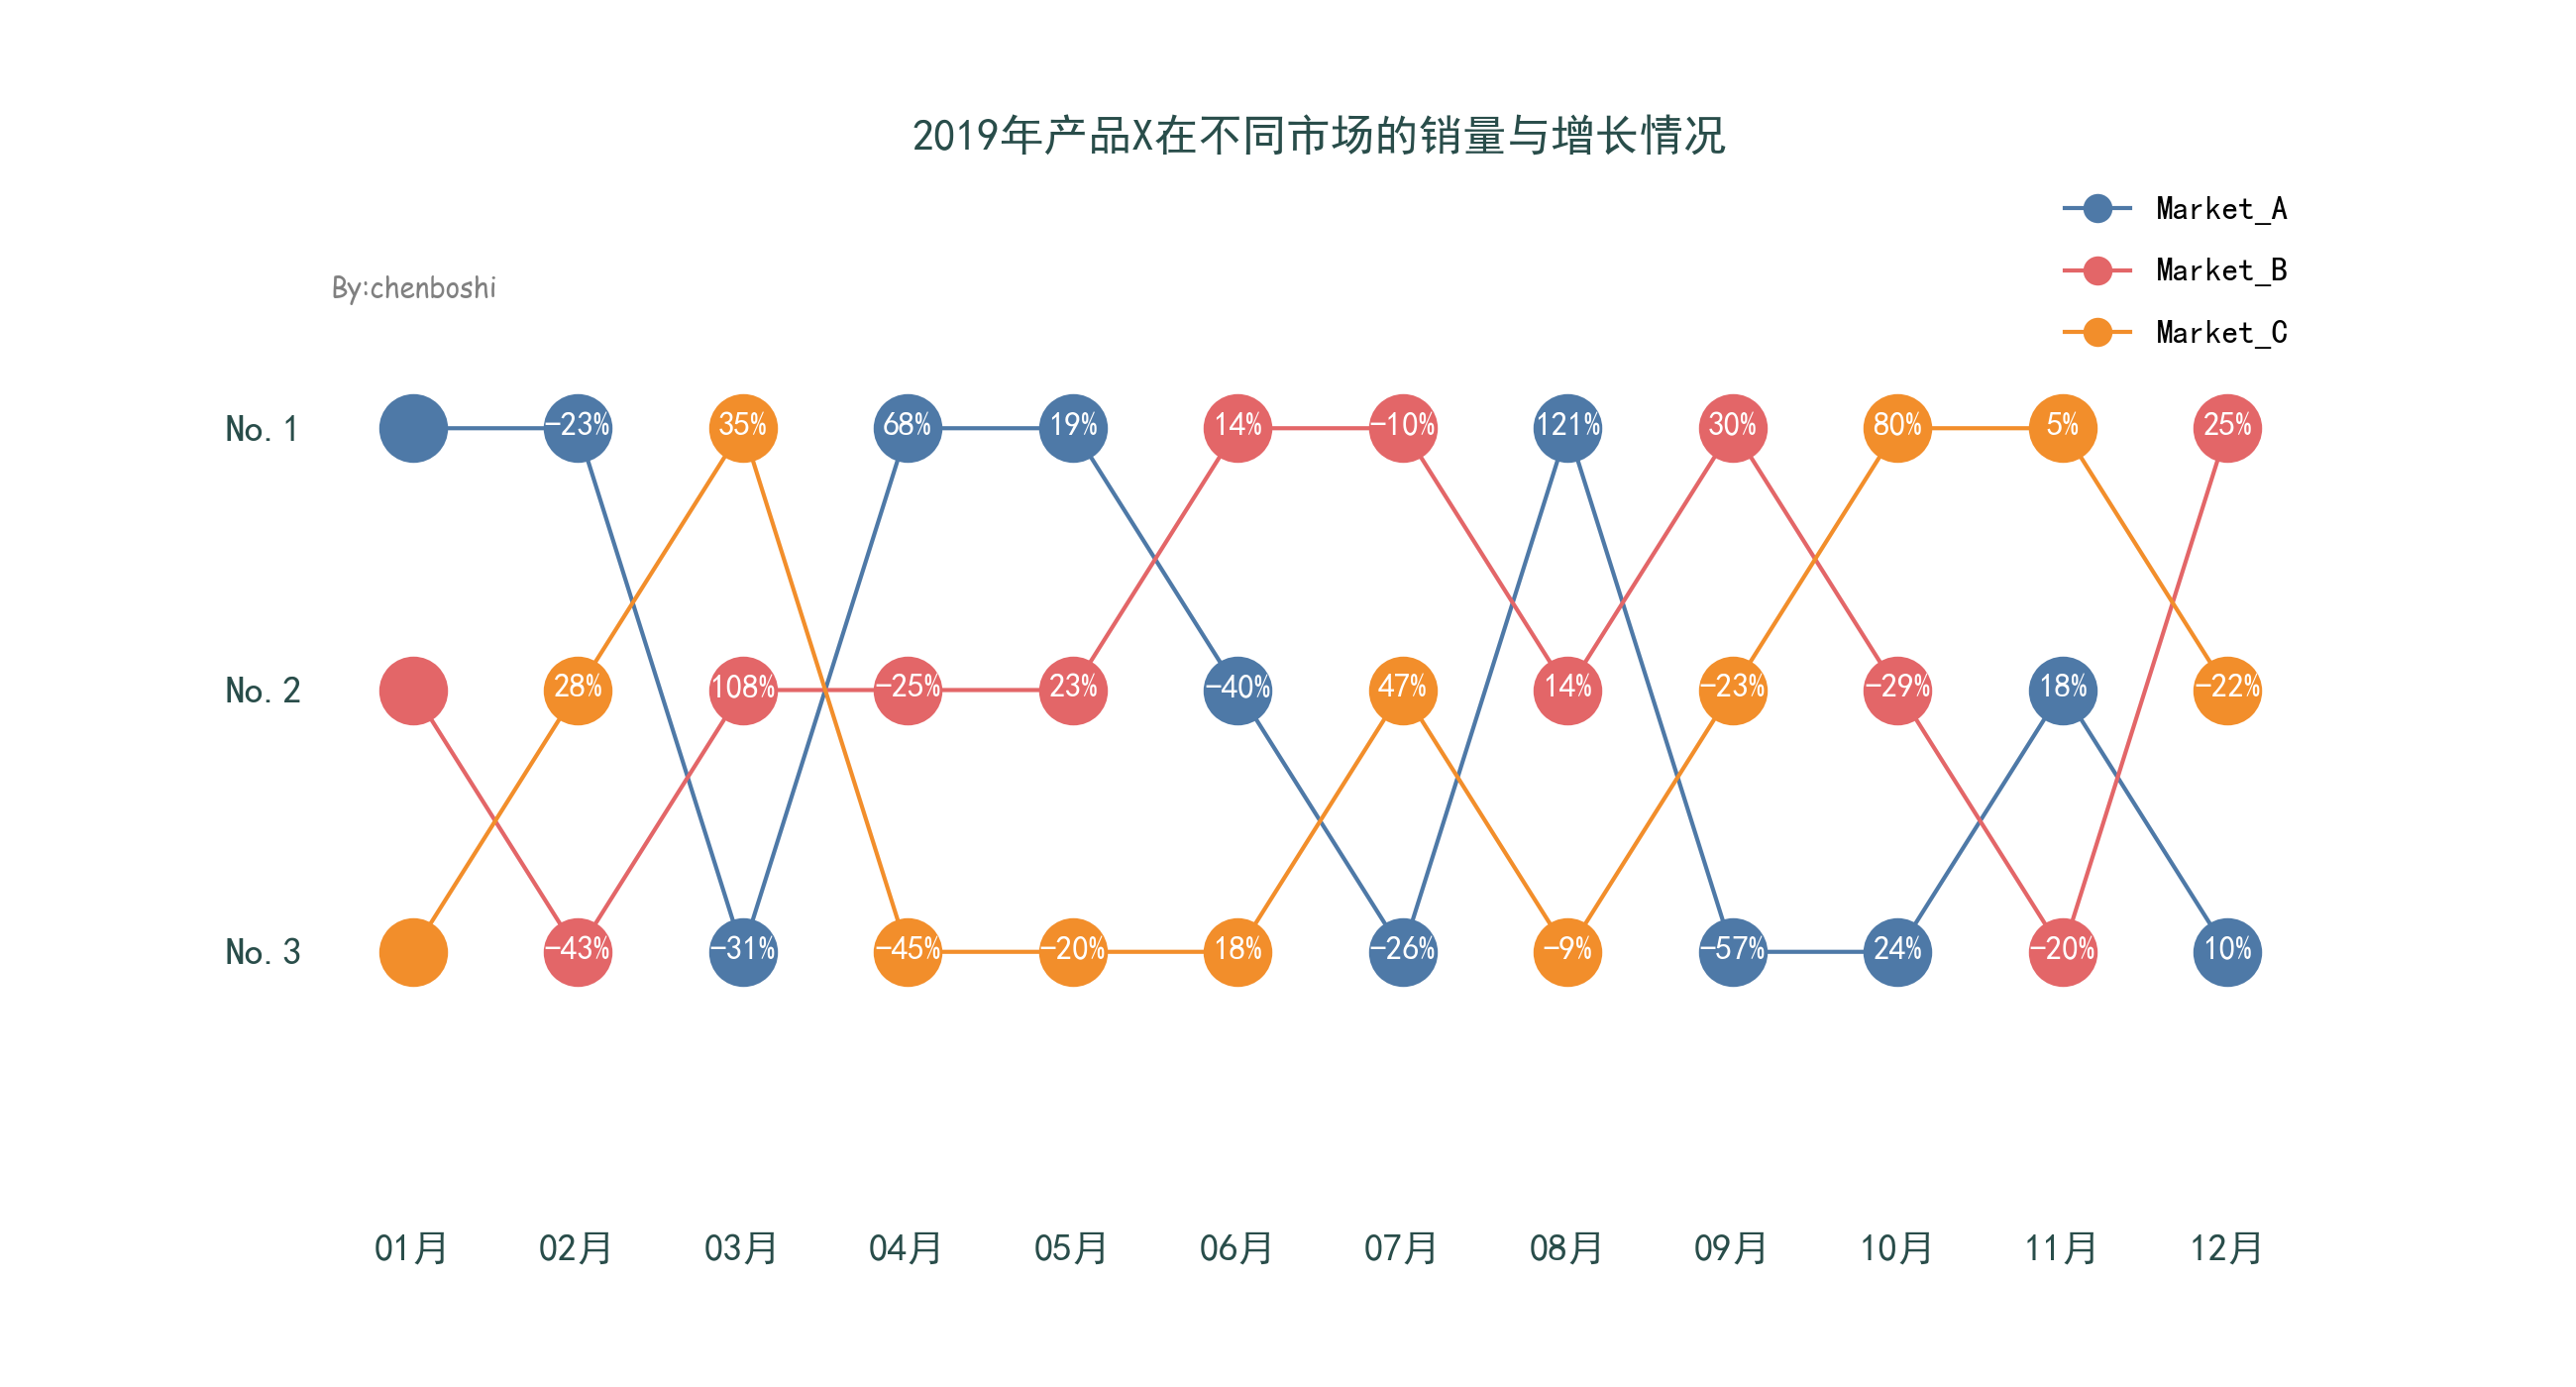 用tableau和matplotlib分别绘制 Bump Charts 阅读全文
用tableau和matplotlib分别绘制 Bump Charts 阅读全文
posted @ 2020-09-10 16:13 chenboshi 阅读(544) 评论(0) 推荐(0)
用tableau和matplotlib分别绘制 Bump Charts 阅读全文
posted @ 2020-09-10 16:13 chenboshi 阅读(544) 评论(0) 推荐(0)
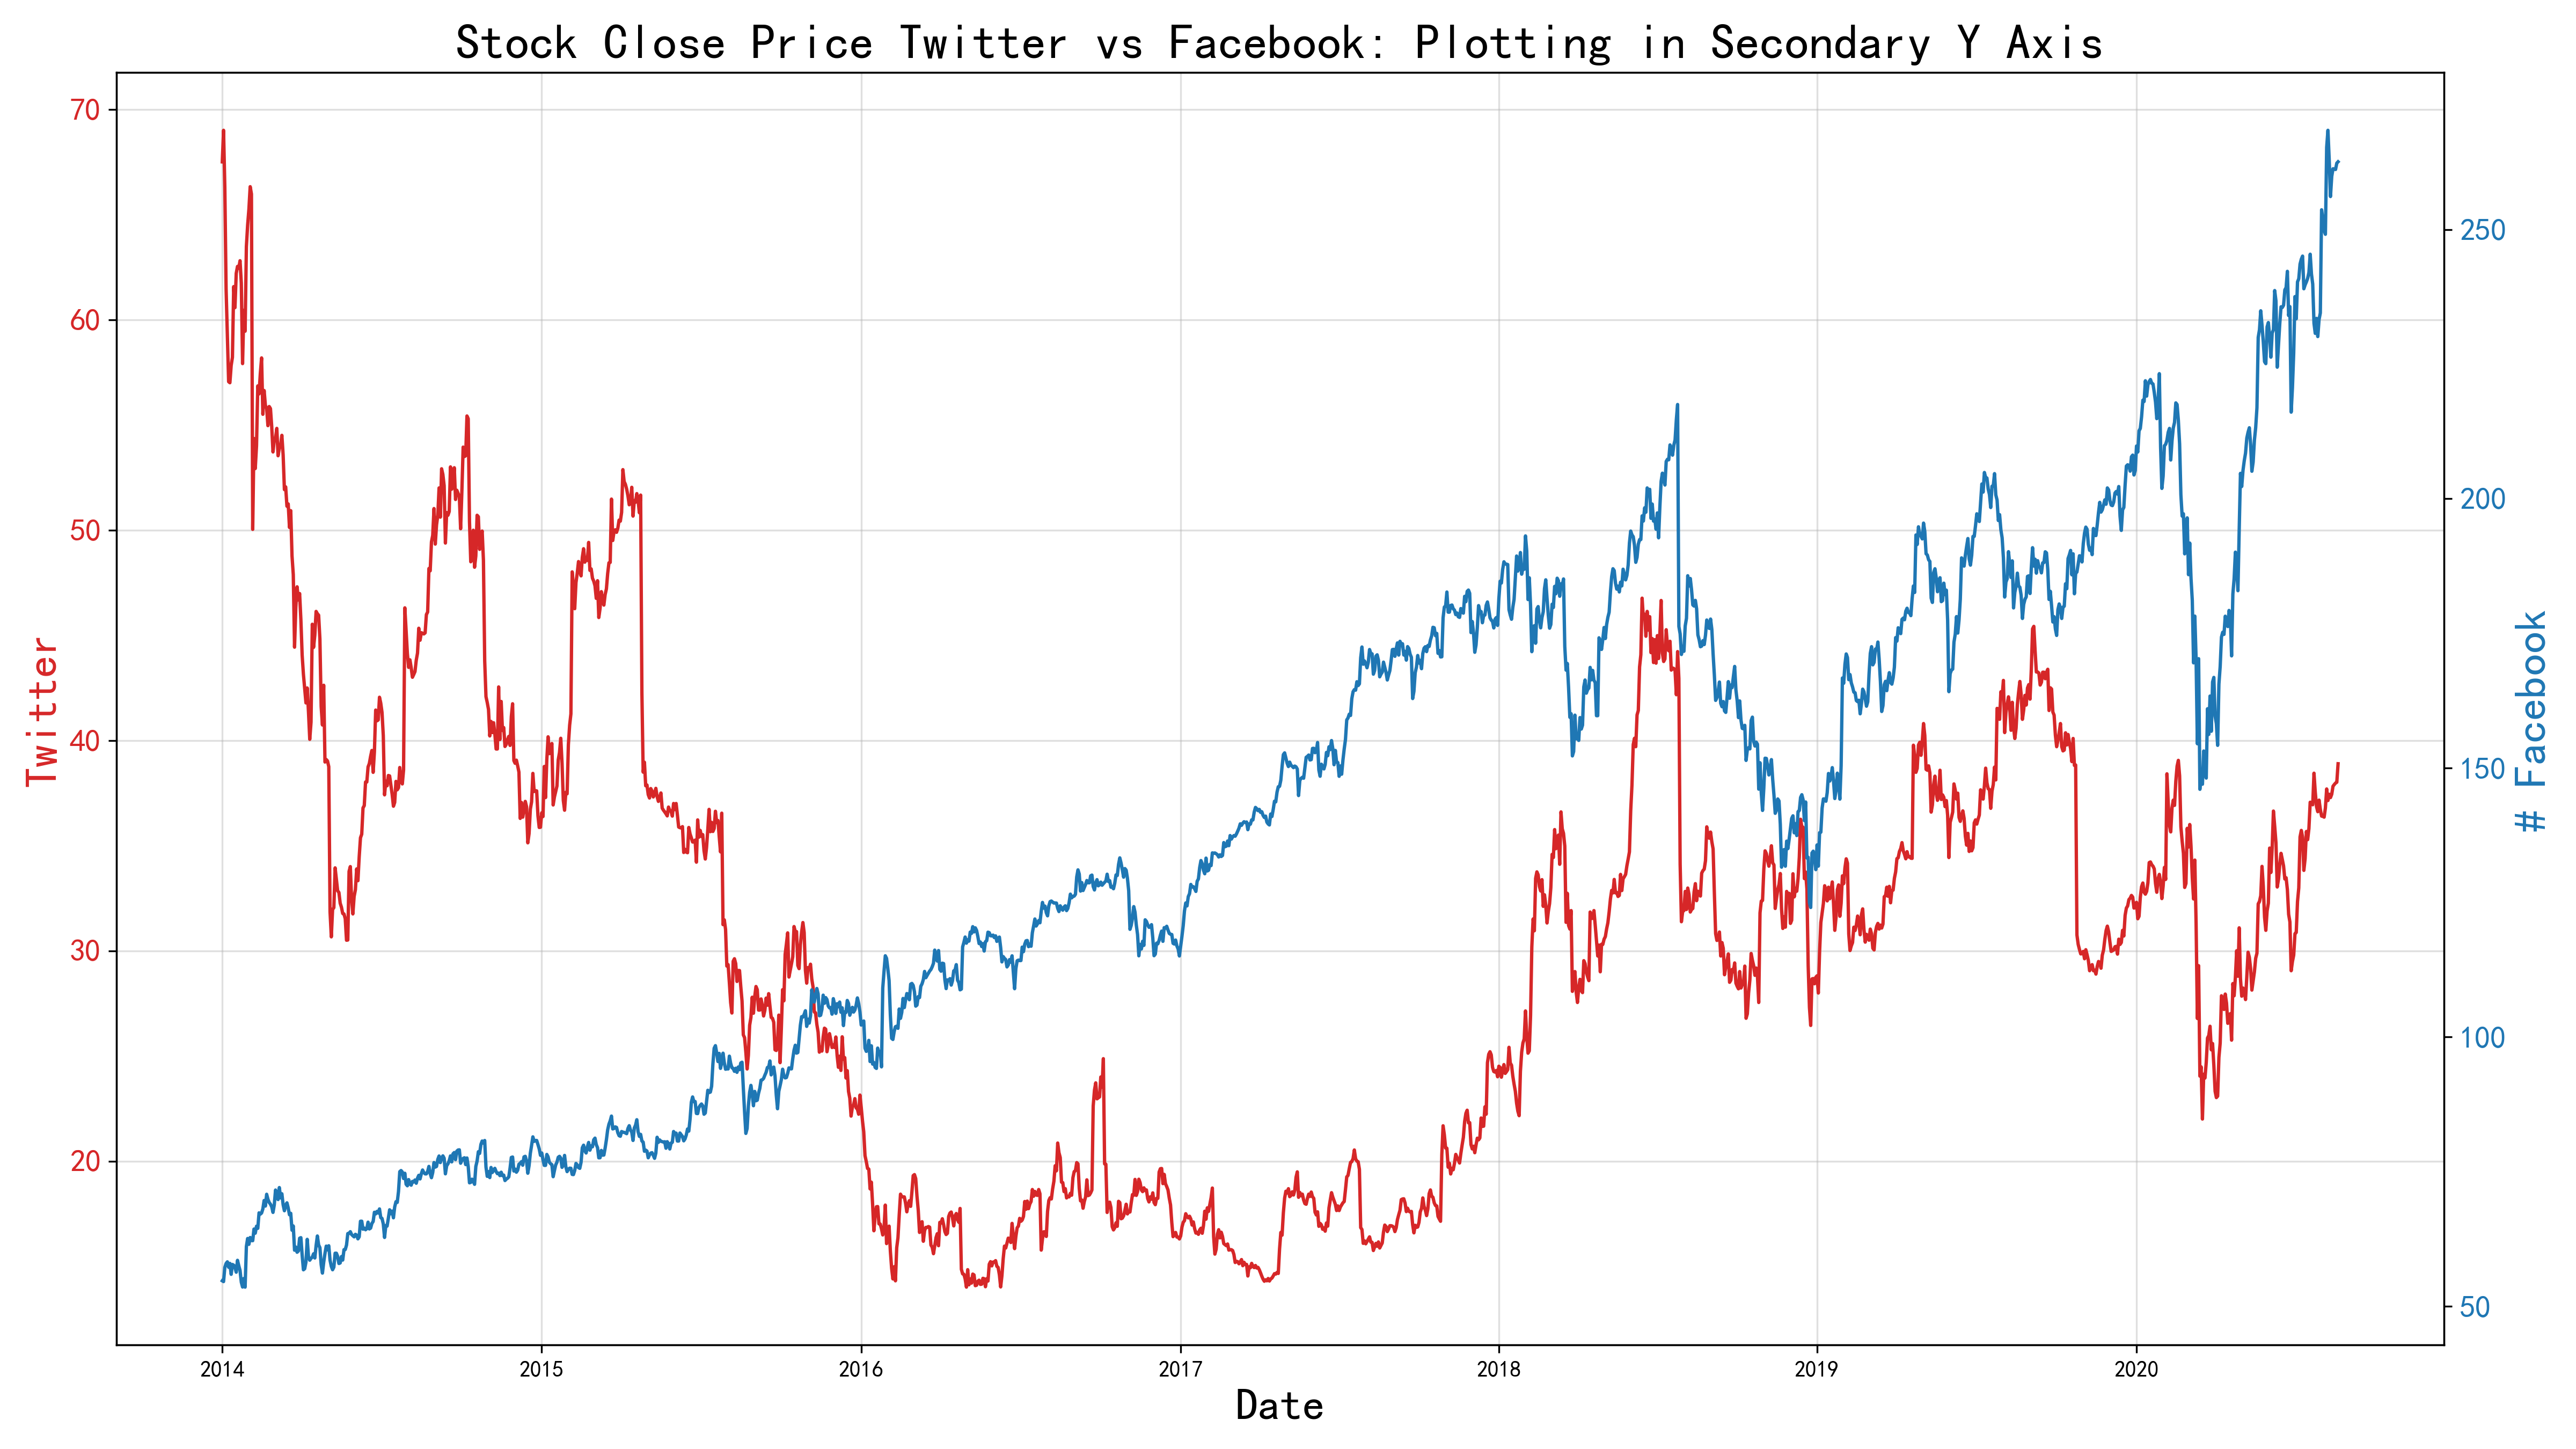 python包 获取股票信息 阅读全文
posted @ 2020-08-21 13:01 chenboshi 阅读(1770) 评论(0) 推荐(0)
 matplotlib:2019中国城市gdp百强 阅读全文
posted @ 2020-08-18 23:59 chenboshi 阅读(1141) 评论(0) 推荐(0)
 matplotlib: 2019年上半年中国城市GDP排名散点图 阅读全文
posted @ 2020-08-17 00:02 chenboshi 阅读(386) 评论(0) 推荐(0)
 maplotlib: 柱状图不等宽柱子的画法 阅读全文
posted @ 2020-08-13 23:31 chenboshi 阅读(293) 评论(0) 推荐(0)
posted @ 2020-08-09 23:40 chenboshi 阅读(179) 评论(0) 推荐(0)
 如何在airflow中添加用户访问?
如何让用户只看到自己创建的dag?
如何设置airflow执行的权限 阅读全文
如何在airflow中添加用户访问?
如何让用户只看到自己创建的dag?
如何设置airflow执行的权限 阅读全文
posted @ 2020-06-22 21:12 chenboshi 阅读(2528) 评论(0) 推荐(0)
 python3,用 request库批量爬取花瓣网某类图片 阅读全文
posted @ 2020-06-20 15:36 chenboshi 阅读(808) 评论(0) 推荐(0)
posted @ 2020-06-14 18:12 chenboshi 阅读(3304) 评论(5) 推荐(0)


 浙公网安备 33010602011771号