1 import numpy as np
2 import matplotlib.pyplot as plt
3 from mpl_toolkits.mplot3d import Axes3D # used for 3d plot
4
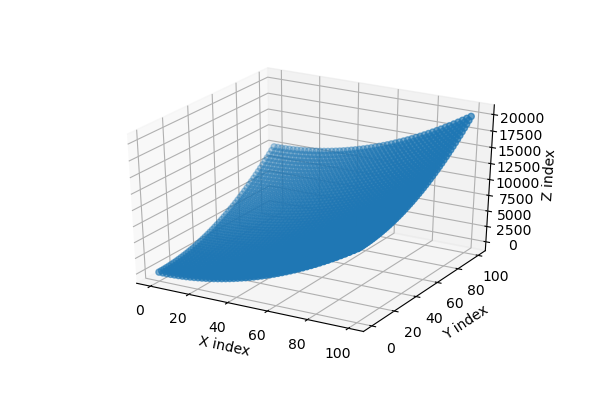
5 x = np.linspace(0,100,50)
6 y = np.linspace(0,100,50)
7 x,y = np.meshgrid(x,y)
8 z = x**2 + y**2
9
10 figure1 = plt.figure() # create a figure
11 ax = figure1.gca(projection='3d') # define figure as 3d
12 ax.scatter(x,y,z) # define the three axes
13 ax.set_xlabel('X index')
14 ax.set_ylabel('Y index')
15 ax.set_zlabel('Z index')
16
17 plt.savefig('fig1.png',format='png',dpi=100)
![]()

 浙公网安备 33010602011771号