matplotlib绘制三维图
本文参考官方文档:http://matplotlib.org/mpl_toolkits/mplot3d/tutorial.html
起步
新建一个matplotlib.figure.Figure对象,然后向其添加一个Axes3D类型的axes对象。
其中Axes3D对象的创建,类似其他axes对象,只不过使用projection='3d'关键词。
import matplotlib.pyplot as plt
from mpl_toolkits.mplot3d import Axes3D
fig = plt.figure()
ax = fig.add_subplot(111, projection='3d')
3D曲线图
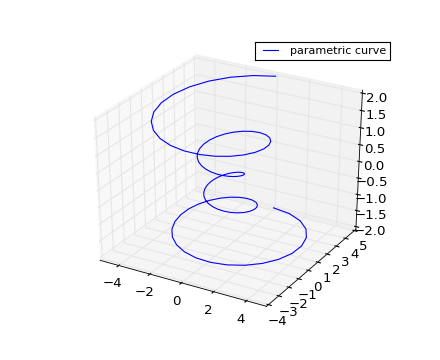
import matplotlib as mpl
from mpl_toolkits.mplot3d import Axes3D
import numpy as np
import matplotlib.pyplot as plt

mpl.rcParams['legend.fontsize'] = 10

fig = plt.figure()
ax = fig.gca(projection='3d')
theta = np.linspace(-4 * np.pi, 4 * np.pi, 100)
z = np.linspace(-2, 2, 100)
r = z**2 + 1
x = r * np.sin(theta)
y = r * np.cos(theta)
ax.plot(x, y, z, label='parametric curve')
ax.legend()
ax.set_xlabel('X Label')
ax.set_ylabel('Y Label')
ax.set_zlabel('Z Label')
plt.show()
简化用法:
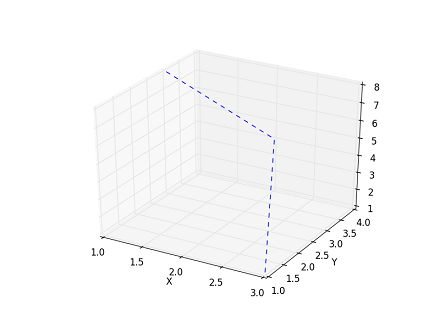
from pylab import *
from mpl_toolkits.mplot3d import Axes3D

plt.gca(projection='3d')
plt.plot([1,2,3],[3,4,1],[8,4,1],'--')
plt.xlabel('X')
plt.ylabel('Y')
#plt.zlabel('Z') #无法使用
3D散点图
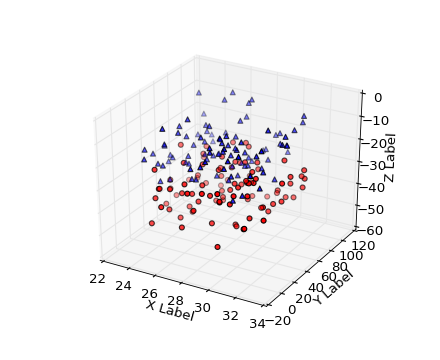
import numpy as np
from mpl_toolkits.mplot3d import Axes3D
import matplotlib.pyplot as plt

def randrange(n, vmin, vmax):
    return (vmax-vmin)*np.random.rand(n) + vmin

fig = plt.figure()
ax = fig.add_subplot(111, projection='3d')
n = 100
for c, m, zl, zh in [('r', 'o', -50, -25), ('b', '^', -30, -5)]:
    xs = randrange(n, 23, 32)
    ys = randrange(n, 0, 100)
    zs = randrange(n, zl, zh)
    ax.scatter(xs, ys, zs, c=c, marker=m)

ax.set_xlabel('X Label')
ax.set_ylabel('Y Label')
ax.set_zlabel('Z Label')

plt.show()
作者:catmelo
本文版权归作者所有,欢迎转载,但未经作者同意必须保留此段声明,且在文章页面明显位置给出原文链接,否则保留追究法律责任的权利。

 浙公网安备 33010602011771号