


echarts地图
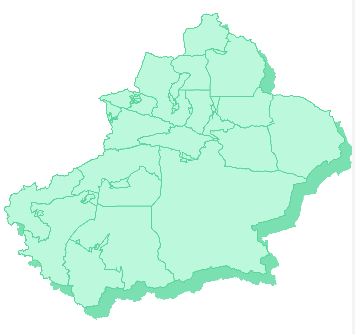
想通过echarts得到一份这样的地图(此处为新疆地图),首先需要一份新疆地区的json数据,还有就是echarts地图代码。
1、json数据
可以通过阿里云数据化可视平台得到:阿里云数据可视化平台
2、echarts代码如下
<template>
  <div class="map_content">
    <div id="map-box"></div>
  </div>
</template>

<script>
export default {
  props: {
    // 地图区域数据
    gisData: Array,
  },
  data() {
    return {
    // 城市经纬度坐标
      geoCoordMap : {
        阿勒泰地区: [88.13963, 47.848393],
        塔城地区: [82.985732, 46.746301],
        克拉玛依市: [84.873946, 45.595886],
        博尔塔拉蒙古: [81.984105, 44.569962],
        伊犁哈萨克自治州: [80.226151, 42.713006],
        阿克苏地区: [80.265068, 41.170712],
        克孜勒苏柯尔克孜自治州: [74.172825, 39.713431],
        喀什地区: [75.989138, 37.467664],
        和田地区: [79.92533, 37.110687],
        巴音郭楞蒙古自治州: [84.150969, 38.768552],
        哈密市: [93.51316, 42.833248],
        乌鲁木齐市: [87.497106, 42.740062],
        吐鲁番市: [87.871523, 43.513961],
        昌吉回族自治州: [89.315669, 44.790604]
      },
  // 为解决点击空白区域展示全数据,设定此变量
  isBlank: true,
    };
  },
  mounted() {
    // dom加载完毕之后执行js
    let This = this;
    setTimeout(function() {
      This.drawChart(); // 展示地图
    }, 500);
  },
  methods: {
    // 处理地区展示数据
    convertData(data) {
      let res = [];
      // 拿到key值
      let geoCoordMapKeys = Object.keys(this.geoCoordMap);
      geoCoordMapKeys.forEach(item => {
        // 与传入的值相匹配
        data.forEach(sItem => {
          if(sItem.name == item) {
            res.push({
              name: sItem.name,
              dccId: sItem.dccId,
              value: this.geoCoordMap[item],
              capacityValue: sItem.value
            });
          }
        });
      });
      return res;
    },
    // 地图配置 geoCoordMap地区图层  data地区展示数据
    drawChart() {
      let This = this;
      let data = This.convertData(This.gisData);

      let option = {};
      let myChart = This.$echarts.init(document.querySelector("#map-box"));
      This.$echarts.registerMap("mapBox", require("./xinjiang.json"));
      myChart.clear();
      myChart.off("click"); // 解绑事件处理函数。为了解决地图下钻会重复触发点击事件的问题
      option = {
        geo: {
          map: "mapBox",
          aspectScale: 0.75,
          zoom: 1.2,
          roam: false,
          itemStyle: {
            normal: {
              areaColor: {
                type: "radial",
                x: 0.5,
                y: 0.5,
                r: 0.8,
                colorStops: [
                  {
                    offset: 0,
                    color: "#bcf9dc"
                  },
                  {
                    offset: 1,
                    color: "#7ae0b1"
                  }
                ],
                globalCoord: true
              },
              shadowColor: "#7ae0b1",
              shadowOffsetX: 10,
              shadowOffsetY: 11
            },
            emphasis: {
              areaColor: "#bcf9dc",
              borderWidth: 0,
              color: "green",
              label: {
                show: false
              }
            }
          }
        },
        series: [
          // 默认
          {
            map: "mapBox",
            type: "map",
            roam: false,
            zoom: 1.2,
            label: {
              normal: {
                show: false
              },
              emphasis: {
                show: false
              }
            },
            itemStyle: {
              normal: {
                borderColor: "#5cd59c",
                borderWidth: 1,
                areaColor: {
                  type: "radial",
                  x: 0.5,
                  y: 0.5,
                  r: 0.8,
                  colorStops: [
                    {
                      offset: 0,
                      color: "#bcf9dc" // 0% 处的颜色
                    },
                    {
                      offset: 1,
                      color: "#bcf9dc" // 100% 处的颜色
                    }
                  ],
                  globalCoord: true // 缺省为 false
                }
              },
              emphasis: {
                borderColor: "#1aa563",
                areaColor: "#30c47e",
                borderWidth: 2
              }
            }
          },
          // 城市
          {
            name: "城市",
            coordinateSystem: "geo",
            type: "effectScatter",
            symbolSize: 0.1,
            // showEffectOn: "render",
            // rippleEffect: {
            //   brushType: "stroke"
            // },
            label: {
              normal: {
                formatter: function (params) {
                  return data.find(item => item.name == params.name) == undefined ? '' : params.name + '\n\r' + params.data.capacityValue + 'MV';
                },
                position: "right",
                show: true
              }
            },
            itemStyle: {
              normal: {
                color: "#03552E",
                shadowBlur: 10,
                shadowColor: "#333",
              }
            },
            data: data
          },
          // 自定义图标
          {
            name: "logo",
            type: "custom", // 配置显示方式为用户自定义
            coordinateSystem: "geo",
            renderItem: function (params, api) {
              //具体实现自定义图标的方法{
              return This.addImage(
                  require("./33.png"),
                  params,
                  api,
                  data
              );
            },
            data: data,
          },
        ]
      };
      myChart.setOption(option, true);
  // 点击的是空白区域
      This.isBlank = true;
      myChart.off('click');
      myChart.on("click", function (params) {
      This.isBlank = false;
        let dataIndex = This.gisData.findIndex(item => item.name == params.name);
        if(dataIndex > -1) {
          if(This.gisData[dataIndex].dccId == undefined) {
            // 跳转到地理信息页
            $router.push({
              path: '/services/geographicInfo'
            });
          } else {
            // 返回dccId
            This.$emit('clickMap', This.gisData[dataIndex]);
          }
        }
      });
      // 整个canvas区域的点击事件
      var oDiv = document.querySelector("#map-box>div");
      oDiv.onclick = function (params) {
          if (This.isBlank) {
              This.$emit("clickMap", { dccId: localStorage.getItem("dccId") });
          }
    // 注意要在此处再设置为true,不然整个isBlank判断就变成只有一次功用了。
         This.isBlank = true;
      };

      window.addEventListener("resize", () => {
        myChart.resize();
      });
    },
    // 地图展示自定义图标
    addImage(url, params, api, realData) {
      return {
        type: "image",
        style: {
          image: url,
          x: api.coord([
            realData[params.dataIndex].value[0]-0.8,
            realData[params.dataIndex].value[1]
          ])[0],
          y: api.coord([
            realData[params.dataIndex].value[0],
            realData[params.dataIndex].value[1]+0.3
          ])[1],
          width: 15,
          height: 14
        }
      };
    },
  }
};
</script>

<style lang="scss" scoped>
.map_content {
  width: 100%;
  height: 330px;
  #map-box {
    width: 100%;
    height: 100%;
  }
}
</style>
其中gisData的数据格式如下:
gisData: [
        {
          name: '乌鲁木齐市',
          value: 123456
        },
        {
          name: '克拉玛依市',
          value: 223456
        },
],

 浙公网安备 33010602011771号