

Spring boot——Actuator 详解
一、什么是 Actuator
Spring Boot Actuator 模块提供了生产级别的功能,比如健康检查,审计,指标收集,HTTP 跟踪等,帮助我们监控和管理Spring Boot 应用。
这个模块是一个采集应用内部信息暴露给外部的模块,上述的功能都可以通过HTTP 和 JMX 访问。
因为暴露内部信息的特性,Actuator 也可以和一些外部的应用监控系统整合(Prometheus, Graphite, DataDog, Influx, Wavefront, New Relic等)。
这些监控系统提供了出色的仪表板,图形,分析和警报,可帮助你通过一个统一友好的界面,监视和管理你的应用程序。
Actuator使用Micrometer与这些外部应用程序监视系统集成。这样一来,只需很少的配置即可轻松集成外部的监控系统。
Micrometer 为 Java 平台上的性能数据收集提供了一个通用的 API,应用程序只需要使用 Micrometer 的通用 API 来收集性能指标即可。
Micrometer 会负责完成与不同监控系统的适配工作。这就使得切换监控系统变得很容易。
需要注意的是:
SpringBoot 1.x 和 2.x 的 Actuator 監控設定差超多,不僅提供的 endpoint 路徑不一樣,連 application.properties 的配置也不一樣,此處介紹的為 SpringBoot 2.x 版本。
二、集成 Actuator
<dependency>
    <groupId>org.springframework.boot</groupId>
    <artifactId>spring-boot-starter-actuator</artifactId>
</dependency>
只要加上了這個 maven dependency,SpringBoot 在運行時就會自動開啟/actuator/health和/actuator/info這兩個 endpoint,我們就可以透過這兩個 endpoint 查看當前 SpringBoot 運行的情況。
Actuator 其實還提供更多樣化的 endpoint 讓我們監控 SpringBoot Application,但是因為安全因素,所以需要另外設置才能打開這些 endpoint,詳細的設置方式下面解說。
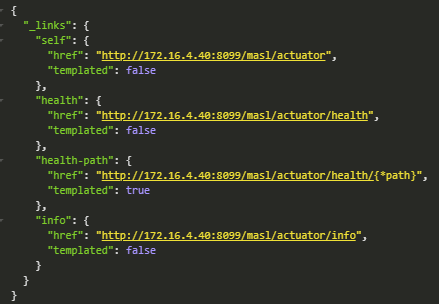
访问http://localhost:8099/actuator,查看暴露出来的端点:
三、Endpoints 介绍
Spring Boot 提供了所谓的 endpoints (下文翻译为端点)给外部来与应用程序进行访问和交互。
打比方来说,/health 端点 提供了关于应用健康情况的一些基础信息。metrics 端点提供了一些有用的应用程序指标(JVM 内存使用、系统CPU使用等)。
这些 Actuator 模块本来就有的端点我们称之为原生端点。根据端点的作用的话,我们大概可以分为三大类:
- 应用配置类:获取应用程序中加载的应用配置、环境变量、自动化配置报告等与Spring Boot应用密切相关的配置类信息。
- 度量指标类:获取应用程序运行过程中用于监控的度量指标,比如:内存信息、线程池信息、HTTP请求统计等。
- 操作控制类:提供了对应用的关闭等操作类功能。
需要注意的就是:
- 每一个端点都可以通过配置来单独禁用或者启动
- 不同于Actuator 1.x,Actuator 2.x 的大多数端点默认被禁掉。 Actuator 2.x 中的默认端点增加了
/actuator前缀。默认暴露的两个端点为/actuator/health和/actuator/info
Actuator 提供的所有 endpoint:
此處使用的是 SpringBoot 2.2.8 版本,Spring 官方文件
| HTTP方法 | Endpoint | 描述 |
|---|---|---|
| GET | /actuator | 查看有哪些 Actuator endpoint 是開放的 |
| GET | /actuator/auditevent | 查看 audit 的事件,例如認證進入、訂單失敗,需要搭配 Spring security 使用,sample code |
| GET | /actuator/beans | 查看運行當下裡面全部的 bean,以及他們的關係 |
| GET | /actuator/conditions | 查看自動配置的結果,記錄哪些自動配置條件通過了,哪些沒通過 |
| GET | /actuator/configprops | 查看注入帶有 @ConfigurationProperties 類的 properties 值為何(包含默認值) |
| GET | /actuator/env (常用) | 查看全部環境屬性,可以看到 SpringBoot 載入了哪些 properties,以及這些 properties 的值(但是會自動*掉帶有 key、password、secret 等關鍵字的 properties 的值,保護安全資訊) |
| GET | /actuator/flyway | 查看 flyway DB 的 migration 資訊 |
| GET | /actuator/health (常用) | 查看當前 SpringBoot 運行的健康指標,值由 HealthIndicator 的實現類提供(所以可以自定義一些健康指標資訊,加到這裡面) |
| GET | /actuator/heapdump | 取得 JVM 當下的 heap dump,會下載一個檔案 |
| GET | /actuator/info | 查看 properties 中 info 開頭的屬性的值,沒啥用 |
| GET | /actuator/mappings | 查看全部的 endpoint(包含 Actuator 的),以及他們和 Controller 的關係 |
| GET | /actuator/metrics(常用) | 查看有哪些指標可以看(ex: jvm.memory.max、system.cpu.usage),要再使用/actuator/metrics/{metric.name}分別查看各指標的詳細資訊 |
| GET | /actuator/scheduledtasks | 查看定時任務的資訊 |
| POST | /actuator/shutdown | 唯一一個需要 POST 請求的 endpoint,關閉這個 SpringBoot 程式 |
四、端点配置
- 默认暴露
我们可以通过以下配置,来配置通过JMX 和 HTTP 暴露的端点。
| Property | Default |
|---|---|
management.endpoints.jmx.exposure.exclude |
|
management.endpoints.jmx.exposure.include |
* |
management.endpoints.web.exposure.exclude |
|
management.endpoints.web.exposure.include |
info, healt |
因為安全的因素,所以 Actuator 默認只會開放/actuator/health和/actuator/info這兩個 endpoint,如果要開放其他 endpoint 的話,需要額外在 application.properties 中做設置。
- 暴露配置
# 可以這樣寫,就會開啟所有endpoints(不包含shutdown)
management.endpoints.web.exposure.include=*

# 也可以這樣寫,就只會開啟指定的endpoint,因此此處只會再額外開啟/actuator/beans和/actuator/mappings
management.endpoints.web.exposure.include=beans,mappings

# exclude可以用來關閉某些endpoints
# exclude通常會跟include一起用,就是先include了全部,然後再exclude /actuator/beans這個endpoint
management.endpoints.web.exposure.exclude=beans
management.endpoints.web.exposure.include=*

# 如果要開啟/actuator/shutdown,要額外再加這一行
management.endpoint.shutdown.enabled=true
- 路径映射
默认情况下所有端点都暴露在“/actuator”路径下,也可以改變/actuator的路徑,可以自定義成自己想要的:
#這樣寫的話,原本內建的/actuator/xxx路徑,都會變成/manage/xxx,可以用來防止被其他人猜到
management.endpoints.web.base-path=/manage

#同时可以将health修改成healthcheck
management.endpoints.web.path-mapping.health=healthcheck
- 管理端口调整
#指定端口,默认跟server.port一样,可以防止被其他人猜到
management.server.port=10111
- 端点响应缓存
对于一些不带参数的端点请求会自动进行缓存,我们可以通过如下方式配置缓存时间,下面配置表示 beans 端点的缓存时间为 100s
management.endpoint.beans.cache.time-to-live=100s
五、端点保护
如果開啟了 Actuator 默認不打開的 endpoints,建議一定要加上 Spring security 之類的做 endpoint 保護,避免重要資訊外洩。因为端点的信息和产生的交互都是非常敏感的,必须防止未经授权的外部访问。
这里我们使用 Spring Security 保护,首先添加相关依赖:
<dependency>
   <groupId>org.springframework.boot</groupId>
   <artifactId>spring-boot-starter-security</artifactId>
</dependency>
添加之后,我们需要定义安全校验规则,来覆盖Spring Security 的默认配置。
这里我给出了两个版本的模板配置:
import org.springframework.boot.actuate.autoconfigure.security.servlet.EndpointRequest;
import org.springframework.boot.actuate.context.ShutdownEndpoint;
import org.springframework.boot.autoconfigure.security.servlet.PathRequest;
import org.springframework.context.annotation.Configuration;
import org.springframework.security.config.annotation.web.builders.HttpSecurity;
import org.springframework.security.config.annotation.web.configuration.WebSecurityConfigurerAdapter;


@Configuration
public class ActuatorSecurityConfig extends WebSecurityConfigurerAdapter {

    /*
     * version1:
     * 1. 限制 '/shutdown'端点的访问,只允许ACTUATOR访问
     * 2. 允许外部访问其他的端点
     * 3. 允许外部访问静态资源
     * 4. 允许外部访问 '/'
     * 5. 其他的访问需要被校验
     * version2:
     * 1. 限制所有端点的访问,只允许ACTUATOR访问
     * 2. 允许外部访问静态资源
     * 3. 允许外部访问 '/'
     * 4. 其他的访问需要被校验
     */

    @Override
    protected void configure(HttpSecurity http) throws Exception {
        // version1
//        http
//                .authorizeRequests()
//                    .requestMatchers(EndpointRequest.to(ShutdownEndpoint.class))
//                        .hasRole("ADMIN")
//                .requestMatchers(EndpointRequest.toAnyEndpoint())
//                    .permitAll()
//                .requestMatchers(PathRequest.toStaticResources().atCommonLocations())
//                    .permitAll()
//                .antMatchers("/")
//                    .permitAll()
//                .antMatchers("/**")
//                    .authenticated()
//                .and()
//                .httpBasic();

        // version2
        http
                .authorizeRequests()
                .requestMatchers(EndpointRequest.toAnyEndpoint())
                    .hasRole("ADMIN")
                .requestMatchers(PathRequest.toStaticResources().atCommonLocations())
                    .permitAll()
                .antMatchers("/")
                    .permitAll()
                .antMatchers("/**")
                    .authenticated()
                .and()
                .httpBasic();
    }
}
application.properties的相关配置如下:
# Spring Security Default user name and password
spring.security.user.name=actuator
spring.security.user.password=actuator
spring.security.user.roles=ADMIN
六、重要端点解析
/health 端点
-
/health配置
当我们开启health的健康端点时,我们能够查到应用健康信息是一个汇总的信息,访问 http://127.0.0.1:10111/actuator/health时,我们获取到的信息是{"status":"UP"},status的值还有可能是 DOWN。
management.endpoint.health.show-details=always
- never:不展示详细信息,up或者down的状态,默认配置
- when-authorized:详细信息将会展示给通过认证的用户。授权的角色可以通过
management.endpoint.health.roles配置 - always:对所有用户暴露详细信息
always之后,我们启动项目再次访问 http://127.0.0.1:10111/actuator/health,获取的信息如下:{ "status": "UP", "details": { "diskSpace": { "status": "UP", "details": { "total": 250685575168, "free": 172252426240, "threshold": 10485760 } }, "redis": { "status": "UP", "details": { "version": "3.2.11" } }, "db": { "status": "UP", "details": { "database": "Oracle", "hello": "Hello" } } } }
/health端点有很多自动配置的健康指示器:如redis、rabbitmq、db等组件。当你的项目有依赖对应组件的时候,这些健康指示器就会被自动装配,继而采集对应的信息。
如上面的 diskSpace 节点信息就是DiskSpaceHealthIndicator 在起作用。
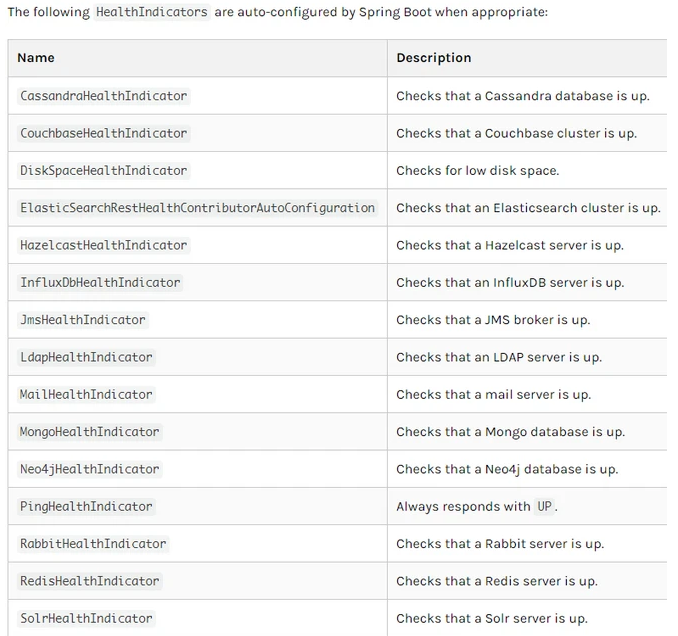
上述截图取自官方文档。
management.health.mongo.enabled: false
或者禁用所有自动配置的健康指示器:
management.health.defaults.enabled: false
/health原理
ApplicationContext中的各种HealthIndicator Beans中收集到的,Spring boot框架中包含了大量的HealthIndicators的实现类,当然你也可以实现自己认为的健康状态。HealthAggregator汇总而成的,汇总的算法是:- 设置状态码顺序:
setStatusOrder(Status.DOWN, Status.OUT_OF_SERVICE, Status.UP, Status.UNKNOWN)。 - 过滤掉不能识别的状态码。
- 如果无任何状态码,整个spring boot应用的状态是
UNKNOWN。 - 将所有收集到的状态码按照 1 中的顺序排序。
- 返回有序状态码序列中的第一个状态码,作为整个spring boot应用的状态。
源代码请参见:
org.springframework.boot.actuate.health.OrderedHealthAggregator。
HealthIndicators 目前包括:| Name | Description |
|---|---|
CassandraHealthIndicator |
Checks that a Cassandra database is up. |
DiskSpaceHealthIndicator |
Checks for low disk space. |
DataSourceHealthIndicator |
Checks that a connection to DataSource can be obtained. |
ElasticsearchHealthIndicator |
Checks that an Elasticsearch cluster is up. |
InfluxDbHealthIndicator |
Checks that an InfluxDB server is up. |
JmsHealthIndicator |
Checks that a JMS broker is up. |
MailHealthIndicator |
Checks that a mail server is up. |
MongoHealthIndicator |
Checks that a Mongo database is up. |
Neo4jHealthIndicator |
Checks that a Neo4j server is up. |
RabbitHealthIndicator |
Checks that a Rabbit server is up. |
RedisHealthIndicator |
Checks that a Redis server is up. |
SolrHealthIndicator |
Checks that a Solr server is up. |
management.health.defaults.enabled这个配置项将它们全部禁用掉,也可以通过management.health.xxxx.enabled将其中任意一个禁用掉。- 自定义 HealthIndicator
HealthIndicator的接口来实现,并将该实现类注册为spring bean。health()方法,并返回自定义的健康状态响应信息,该响应信息应该包括一个状态码和要展示详细信息。HealthIndicator的实现类:import org.springframework.boot.actuate.health.Health; import org.springframework.boot.actuate.health.HealthIndicator; import org.springframework.stereotype.Component; @Component public class MyHealthIndicator implements HealthIndicator { @Override public Health health() { int errorCode = check(); // perform some specific health check if (errorCode != 0) { return Health.down().withDetail("Error Code", errorCode).build(); } return Health.up().build(); } }
HealthIndicator的实现类中,使用了自定义的状态类型FATAL,为了配置该状态类型的严重程度,你需要在application的配置文件中添加如下配置:management.health.status.order=FATAL, DOWN, OUT_OF_SERVICE, UNKNOWN, UP
UP 对应 200, 而 OUT_OF_SERVICE 和 DOWN 对应 503)。FATAL 映射为 503(服务不可用):management.health.status.http-mapping.FATAL=503
如果你需要更多的控制,你可以定义自己的 HealthStatusHttpMapper bean。
下面是内置健康状态类型对应的HTTP状态码列表:
| Status | Mapping |
|---|---|
| DOWN | SERVICE_UNAVAILABLE (503) |
| OUT_OF_SERVICE | SERVICE_UNAVAILABLE (503) |
| UP | No mapping by default, so http status is 200 |
| UNKNOWN | No mapping by default, so http status is 200 |
/metrics 端点
- 查看所有可追踪的度量
/metrics端点用来返回当前应用的各类重要度量指标,比如:内存信息、线程信息、垃圾回收信息、tomcat、数据库连接池等。
{
  "names": [
    "hikaricp.connections",
    "hikaricp.connections.acquire",
    "hikaricp.connections.active",
    "hikaricp.connections.creation",
    "hikaricp.connections.idle",
    "hikaricp.connections.max",
    "hikaricp.connections.min",
    "hikaricp.connections.pending",
    "hikaricp.connections.timeout",
    "hikaricp.connections.usage",
    "jvm.buffer.count",
    "jvm.buffer.memory.used",
    "jvm.buffer.total.capacity",
    "jvm.classes.loaded",
    "jvm.classes.unloaded",
    "jvm.gc.live.data.size",
    "jvm.gc.max.data.size",
    "jvm.gc.memory.allocated",
    "jvm.gc.memory.promoted",
    "jvm.gc.pause",
    "jvm.memory.committed",
    "jvm.memory.max",
    "jvm.memory.used",
    "jvm.threads.daemon",
    "jvm.threads.live",
    "jvm.threads.peak",
    "jvm.threads.states",
    "logback.events",
    "process.cpu.usage",
    "process.start.time",
    "process.uptime",
    "system.cpu.count",
    "system.cpu.usage",
    "tomcat.cache.access",
    "tomcat.cache.hit",
    "tomcat.global.error",
    "tomcat.global.received",
    "tomcat.global.request",
    "tomcat.global.request.max",
    "tomcat.global.sent",
    "tomcat.servlet.error",
    "tomcat.servlet.request",
    "tomcat.servlet.request.max",
    "tomcat.sessions.active.current",
    "tomcat.sessions.active.max",
    "tomcat.sessions.alive.max",
    "tomcat.sessions.created",
    "tomcat.sessions.expired",
    "tomcat.sessions.rejected",
    "tomcat.threads.busy",
    "tomcat.threads.config.max",
    "tomcat.threads.current",
    "zipkin.reporter.messages",
    "zipkin.reporter.messages.total",
    "zipkin.reporter.queue.bytes",
    "zipkin.reporter.queue.spans",
    "zipkin.reporter.spans",
    "zipkin.reporter.spans.dropped",
    "zipkin.reporter.spans.total"
  ]
}
各个指标说明如下:
| 序号 | 参数 | 参数说明 | 是否监控 | 监控手段 | 重要度 |
|---|---|---|---|---|---|
| JVM | |||||
| 1 | jvm.memory.max | JVM 最大内存 | |||
| 2 | jvm.memory.committed | JVM 可用内存 | 是 | 展示并监控堆内存和 Metaspace | 重要 |
| 3 | jvm.memory.used | JVM 已用内存 | 是 | 展示并监控堆内存和 Metaspace | 重要 |
| 4 | jvm.buffer.memory.used | JVM 缓冲区已用内存 | |||
| 5 | jvm.buffer.count | 当前缓冲区数 | |||
| 6 | jvm.threads.daemon | JVM 守护线程数 | 是 | 显示在监控页面 | |
| 7 | jvm.threads.live | JVM 当前活跃线程数 | 是 | 显示在监控页面;监控达到阈值时报警 | 重要 |
| 8 | jvm.threads.peak | JVM 峰值线程数 | 是 | 显示在监控页面 | |
| 9 | jvm.classes.loaded | 加载 classes 数 | |||
| 10 | jvm.classes.unloaded | 未加载的 classes 数 | |||
| 11 | jvm.gc.memory.allocated | GC 时,年轻代分配的内存空间 | |||
| 12 | jvm.gc.memory.promoted | GC 时,老年代分配的内存空间 | |||
| 13 | jvm.gc.max.data.size | GC 时,老年代的最大内存空间 | |||
| 14 | jvm.gc.live.data.size | FullGC 时,老年代的内存空间 | |||
| 15 | jvm.gc.pause | GC 耗时 | 是 | 显示在监控页面 | |
| TOMCAT | |||||
| 16 | tomcat.sessions.created | tomcat 已创建 session 数 | |||
| 17 | tomcat.sessions.expired | tomcat 已过期 session 数 | |||
| 18 | tomcat.sessions.active.current | tomcat 活跃 session 数 | |||
| 19 | tomcat.sessions.active.max | tomcat 最多活跃 session 数 | 是 | 显示在监控页面,超过阈值可报警或者进行动态扩容 | 重要 |
| 20 | tomcat.sessions.alive.max.second | tomcat 最多活跃 session 数持续时间 | |||
| 21 | tomcat.sessions.rejected | 超过 session 最大配置后,拒绝的 session 个数 | 是 | 显示在监控页面,方便分析问题 | |
| 22 | tomcat.global.error | 错误总数 | 是 | 显示在监控页面,方便分析问题 | |
| 23 | tomcat.global.sent | 发送的字节数 | |||
| 24 | tomcat.global.request.max | request 最长时间 | |||
| 25 | tomcat.global.request | 全局 request 次数和时间 | |||
| 26 | tomcat.global.received | 全局 received 次数和时间 | |||
| 27 | tomcat.servlet.request | servlet 的请求次数和时间 | |||
| 28 | tomcat.servlet.error | servlet 发生错误总数 | |||
| 29 | tomcat.servlet.request.max | servlet 请求最长时间 | |||
| 30 | tomcat.threads.busy | tomcat 繁忙线程 | 是 | 显示在监控页面,据此检查是否有线程夯住 | |
| 31 | tomcat.threads.current | tomcat 当前线程数(包括守护线程) | 是 | 显示在监控页面 | 重要 |
| 32 | tomcat.threads.config.max | tomcat 配置的线程最大数 | 是 | 显示在监控页面 | 重要 |
| 33 | tomcat.cache.access | tomcat 读取缓存次数 | |||
| 34 | tomcat.cache.hit | tomcat 缓存命中次数 | |||
| CPU | |||||
| 35 | system.cpu.count | CPU 数量 | |||
| 36 | system.load.average.1m | load average | 是 | 超过阈值报警 | 重要 |
| 37 | system.cpu.usage | 系统 CPU 使用率 | |||
| 38 | process.cpu.usage | 当前进程 CPU 使用率 | 是 | 超过阈值报警 | |
| 39 | http.server.requests | http 请求调用情况 | 是 | 显示 10 个请求量最大,耗时最长的 URL;统计非 200 的请求量 | 重要 |
| 40 | process.uptime | 应用已运行时间 | 是 | 显示在监控页面 | |
| 41 | process.files.max | 允许最大句柄数 | 是 | 配合当前打开句柄数使用 | |
| 42 | process.start.time | 应用启动时间点 | 是 | 显示在监控页面 | |
| 43 | process.files.open | 当前打开句柄数 | 是 | 监控文件句柄使用率,超过阈值后报警 | 重要 |
- 查看某个度量的详细信息
不同于1.x,Actuator在这个界面看不到具体的指标信息,只是展示了一个指标列表。为了获取到某个指标的详细信息,我们可以请求具体的指标信息,像这样:
http://localhost:8080/actuator/metrics/{MetricName}
比如我访问/actuator/metrics/jvm.memory.max,返回信息如下:
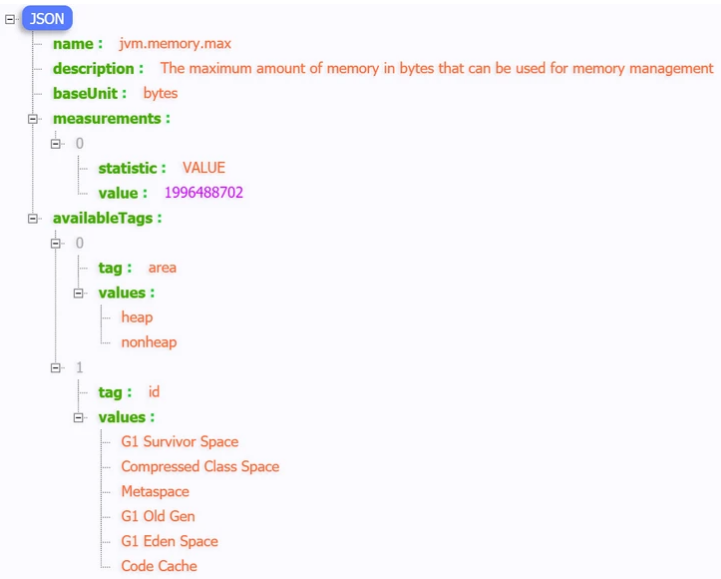
你也可以用query param的方式查看单独的一块区域。比如你可以访问/actuator/metrics/jvm.memory.max?tag=id:Metaspace。结果就是:

- 添加自定义统计指标
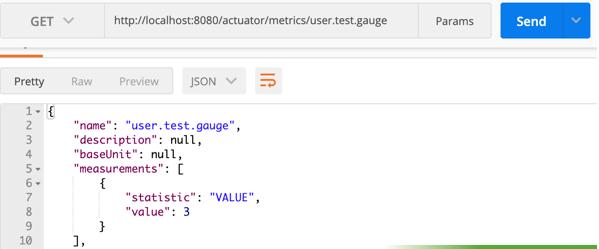
1,Gauge(计量器)
Gauge(计量器)是最简单的度量类型,只有一个简单的返回值,他用来记录一些对象或者事物的瞬时值。
@RestController
public class HelloController {
    @GetMapping("/hello")
    public void hello() {
        Metrics.gauge("user.test.gauge", 3);
    }
}
(2)通过 /actuator/metrics 接口可以看到我们自定义的这个指标:
2,Counter(计数器)
Counter(计数器)简单理解就是一种只增不减的计数器。它通常用于记录服务的请求数量、完成的任务数量、错误的发生数量等等。
(1)为方便使用首先我们自定义一个计数器服务:
@Service
public class MyCounterService {
    static final Counter userCounter = Metrics.counter("user.counter.total", "services", "demo");
    public void processCollectResult() {
        userCounter.increment(1D);
    }
}
(2)然后增加一个 controller,触发这个服务:
@RestController
public class HelloController {

    @Autowired
    MyCounterService myCounterService;

    @GetMapping("/hello")
    public void hello() {
        myCounterService.processCollectResult();
    }
}
(3)通过 /actuator/metrics 接口可以看到我们自定义的这个指标: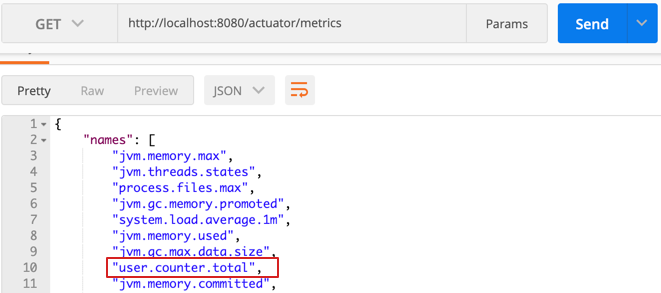
(4)假设我们访问了 3 次 /hello 接口,再次通过 /actuator/metrics/user.counter.total 这个自定义度量的消息信息,显示如下: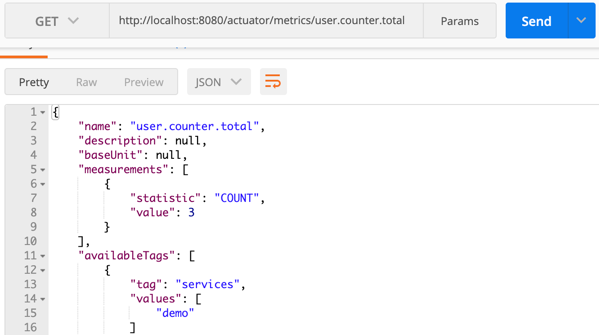
3,Timer(计时器)
Timer(计时器)可以同时测量一个特定的代码逻辑块的调用(执行)速度和它的时间分布。
简单来说,就是在调用结束的时间点记录整个调用块执行的总时间,适用于测量短时间执行的事件的耗时分布,例如消息队列消息的消费速率。
(1)假设我们在一个 Contoller 使用 Timer 来记录某个方法的执行时长:
注意:在实际生产环境中,可以通过 spring-aop 把记录方法耗时的逻辑抽象到一个切面中,这样就能减少不必要的冗余的模板代码。
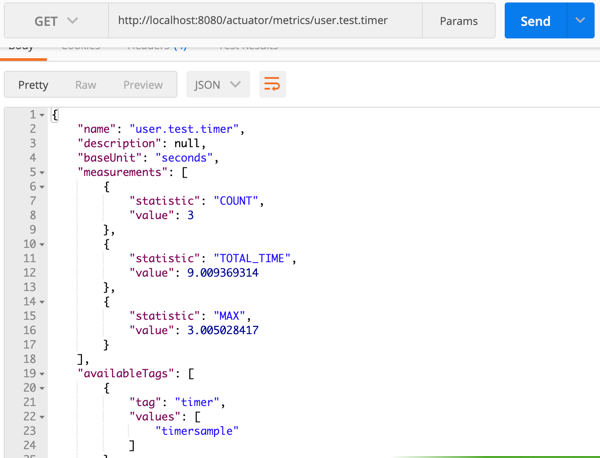
@RestController
public class HelloController {

    private Timer timer = Metrics.timer("user.test.timer","timer", "timersample");

    @GetMapping("/hello")
    public void hello() {

        // 执行createOrder方法并记录执行时间
        timer.record(() -> createOrder());
    }

    //模拟方法耗时
    private void createOrder() {
        try {
            TimeUnit.SECONDS.sleep(3);
        } catch (InterruptedException e) {
        }
    }
}
(2)假设我们访问了 3 次 /hello 接口,再次通过 /actuator/metrics/user.test.timer 这个自定义度量的消息信息,显示如下:
4,Summary(摘要)
Summary(摘要)用于跟踪事件的分布。它类似于一个计时器,但更一般的情况是,它的大小并不一定是一段时间的测量值。
在 micrometer 中,对应的类是 DistributionSummary,它的用法有点像 Timer,但是记录的值是需要直接指定,而不是通过测量一个任务的执行时间。
(1)假设我们在一个 Contoller 使用 Summary 来连续记录三次值:
@RestController
public class HelloController {

    private DistributionSummary summary = Metrics.summary("user.test.summary","summary", "summarysample");

    @GetMapping("/hello")
    public void hello() {
        summary.record(2D);
        summary.record(3D);
        summary.record(4D);
    }
}
(2)假设我们访问 /hello 接口后,再次通过 /actuator/metrics/user.test.summary 这个自定义度量的消息信息,显示如下:
/loggers 端点
- 查看日志等级
/loggers 端点暴露了我们程序内部配置的所有logger的信息。我们访问/actuator/loggers可以看到:
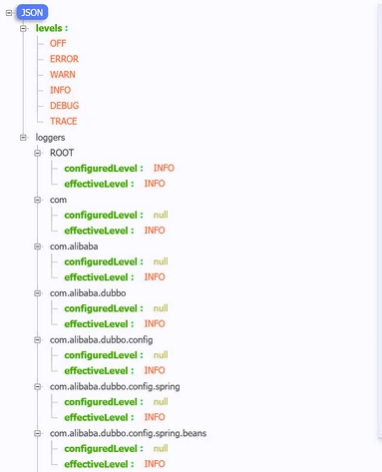
你也可以通过下述方式访问单独一个logger:
http://localhost:8080/actuator/loggers/{name}
比如我现在访问 root logger,http://localhost:8080/actuator/loggers/root:
{
    "configuredLevel": "INFO",
    "effectiveLevel": "INFO"
}
- 改变运行时日志等级
/loggers端点能够动态修改你的日志等级。
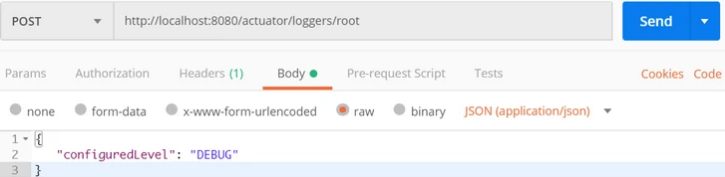
比如,我们可以通过以下几种方式来修改 root logger的日志等级。我们只需要发起一个URL 为http://localhost:8080/actuator/loggers/root的POST请求,POST报文如下:
{
   "configuredLevel": "DEBUG"
}
1、使用工具修改:
2、使用浏览器修改:
先在chrome浏览器中,按F12打开console(控制台);然后执行以下脚本(url参数根据自己需求进行修改),回车执行。
fetch(new Request('http://localhost:8080/masl/actuator/loggers/ROOT',{
method:'POST',
headers: {'Content-Type': 'application/json;charset=UTF-8'},
body:"{\"configuredLevel\": \"DEBUG\"}"
})).then((resp)=>{console.log(resp)})
3、使用shell脚本修改:
curl -X "POST" "http://localhost:8080/masl/actuator/loggers/ROOT" -H "Content-Type: application/json;charset=UTF-8" -d '{"configuredLevel": "DEBUG"}'
仔细想想,这个功能是不是非常有用。还可以只修改某个类的日志级别(把上面的ROOT替换成类的全路径,如:com.zat.asl.MaslApplication)
如果在生产环境中,你想要你的应用输出一些Debug信息以便于你诊断一些异常情况,你只需要按照上述方式就可以修改,而不需要重启应用。
/info 端点
/info端点可以用来展示应用信息,主要包含三大类:自定义信息、Git 信息、以及项目构建信息。下面主要介绍自定义信息。
(1)自定义信息可以在 application.properties 配置文件中添加,这些以 info 开头的信息将在 info 端点中显示出来:
info.app.name=actuator-test-demo
info.app.encoding=UTF-8
info.app.java.source=1.8
info.app.java.target=1.8
启动项目,访问http://localhost:8080/actuator/info:
{
    "app": {
        "encoding": "UTF-8",
        "java": {
            "source": "1.8.0_131",
            "target": "1.8.0_131"
        },
        "name": "actuator-test-demo"
    }
}
(2)我们也可以通过 Java 代码自定义信息,只需要将自定义类继承自 InfoContributor,然后实现该类中的 contribute 方法即可:
@Component
public class MyInfo implements InfoContributor {
    @Override
    public void contribute(Info.Builder builder) {
        Map<String, String> info = new HashMap<>();
        info.put("name", "航歌");
        info.put("email", "service@hangge.com");
        builder.withDetail("author", info);
    }
}
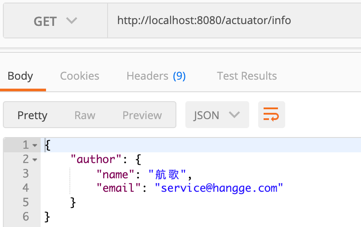
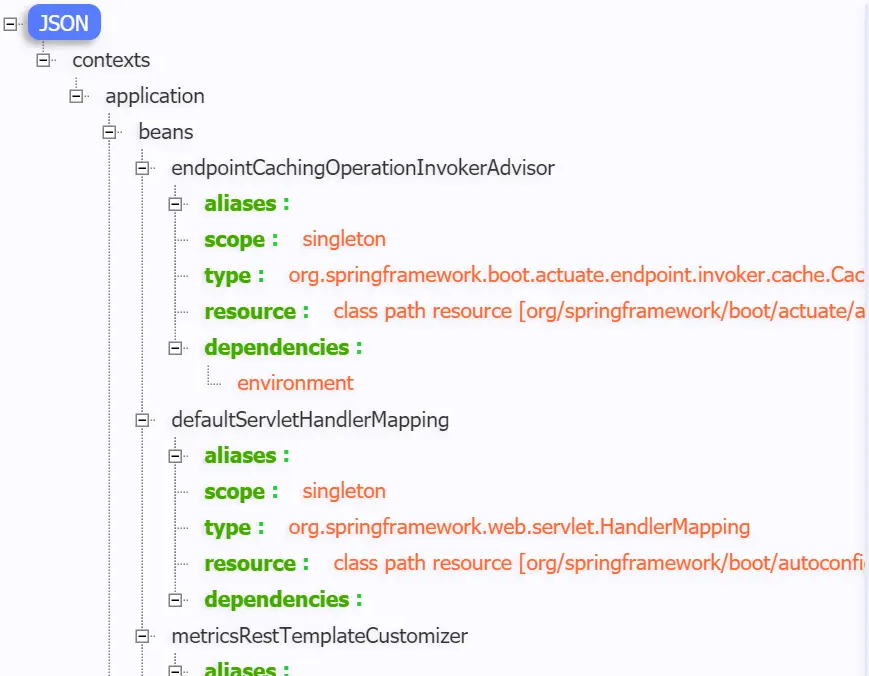
/beans 端点
/beans端点会返回Spring 容器中所有bean的别名、类型、是否单例、依赖等信息。
访问http://localhost:8080/actuator/beans,返回如下:
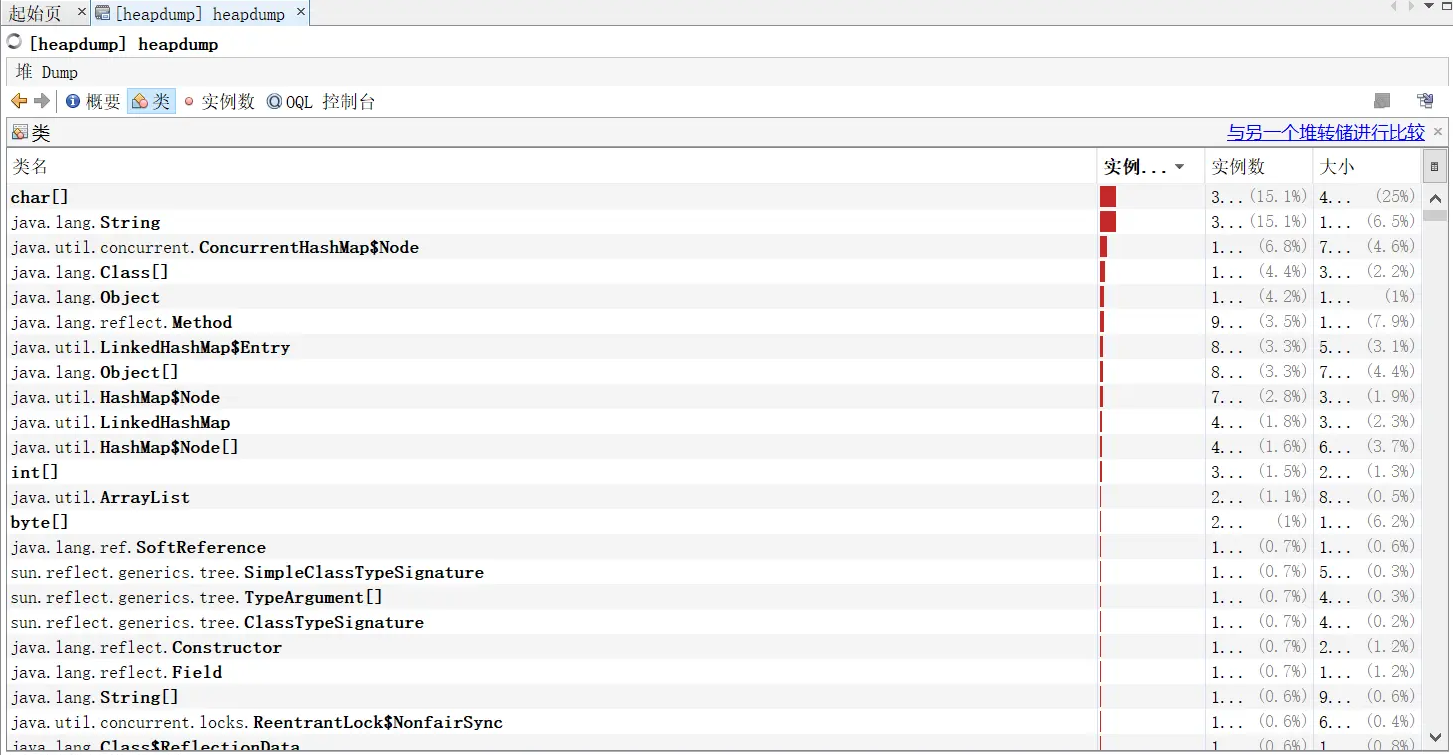
/heapdump 端点
访问:http://localhost:8080/actuator/heapdump会自动生成一个 Jvm 的堆文件 heapdump。我们可以使用 JDK 自带的 Jvm 监控工具 VisualVM 打开此文件查看内存快照。
/threaddump 端点
http://localhost:8080/actuator/threaddump返回如下: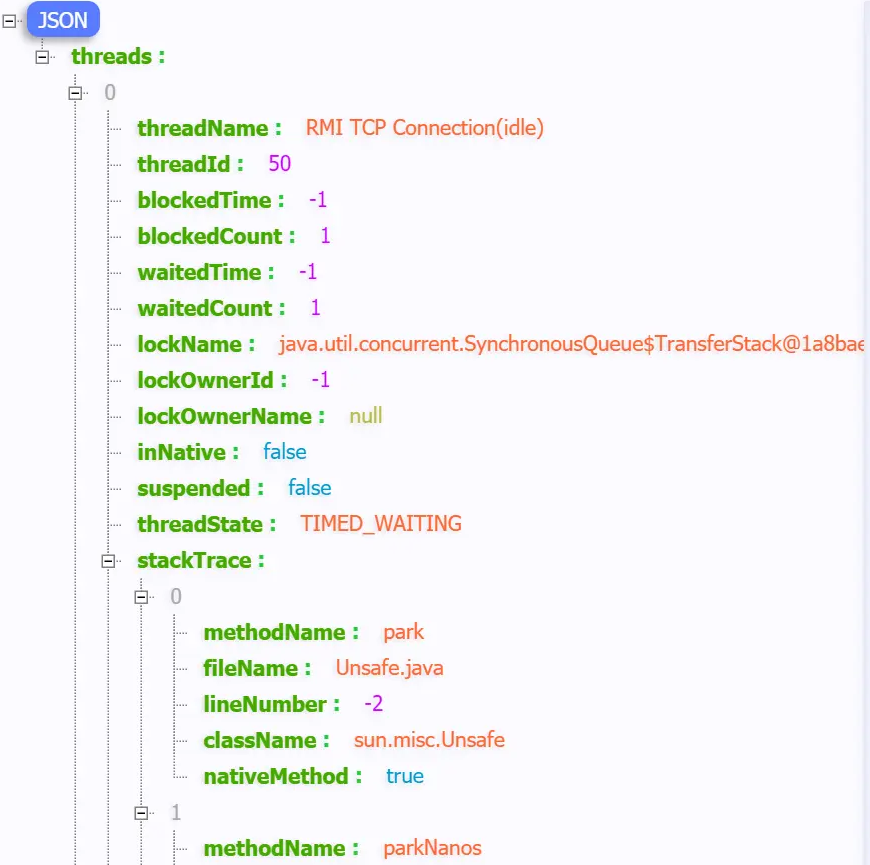
这个端点属于操作控制类端点,可以优雅关闭 Spring Boot 应用。要使用这个功能首先需要在配置文件中开启:
management.endpoint.shutdown.enabled=true
由于 shutdown 接口默认只支持 POST 请求,我们启动Demo项目,发起POST请求:
curl -X "POST" "http://localhost:8080/actuator/shutdown"
返回信息:
{
    "message": "Shutting down, bye..."
}
然后应用程序被关闭。类似停服的操作还有很多,比如restart、pause等。可根据具体版本进行配置。
由于开放关闭应用的操作本身是一件非常危险的事,所以真正在线上使用的时候,我们需要对其加入一定的保护机制,
比如:定制Actuator的端点路径、整合Spring Security进行安全校验等。(不是特别必要的话,这个端点不用开)。
定制Actuator的端点路径和端口:
-
management.endpoints.web.base-path 自定义shutdown的请求路径;
-
management.server.address 设置为本地ip,防止远程访问该连接进行关闭服务;
-
management.server.port 自定义shutdown请求路径的端口号;
调整后的配置文件如下:
management:
  endpoint:
    shutdown:
      enabled: true
  endpoints:
    web:
      exposure:
        include: '*'
    jmx:
      exposure:
        include: '*'
  server:
    # 自定义端口
    port: 8888
    # 不允许远程管理连接,安全性考虑
    address: 127.0.0.1
七、自定义Endpoint
默认的端点虽然可以满足大多数的需求,但一些特殊的需求还是需要能够支持自定义端点的。
自定义 Endpoint 端点,只需要在我们的新建Bean上使用 @Endpoint 注解即可, Bean 中的方法就可以通过 JMX 或者 HTTP 公开。
除此之外,还可以使用 @JmxEndpoint 或 @WebEndpoint 编写 EndPoint。但这些 EndPoint 仅限于各自的公开方式。例如,@WebEndpoint 仅通过HTTP公开,而不通过JMX公开。
那么是不是类中所有的方法都支持对外公开呢?
很明显不是的。Actuator提供了三个用于方法上的注解,只有加三个注解的方法才支持对外公开,并且每个注解都有支持它的HTTP method。
- @ReadOperation对应HTTP的GET请求
- @WriteOperation对应HTTP的POST请求
- @DeleteOperation对应HTTP的DELETE请求
来看一个简单的使用实例:
@Component
@Endpoint(id = "my")
public class EndpointCustom {

   @ReadOperation
   public String endpointCustomRead(String content) {
      return "请求的内容: " + content;
   }

   @WriteOperation
   public String endpointCustomWrite(String content) {
      return "写的内容: " + content;
   }

   @DeleteOperation
   public String endpointCustomDelete(String content) {
      return "删除的内容: " + content;
   }

}
对应GET请求:
curl -X GET http://localhost:8080/actuator/my?content=endpointGet
执行之后,会返回信息“请求的内容: endpointGet”。
同样的POST请求为:
curl -X POST http://localhost:8080/actuator/my?content=endpointPost
DELETE请求为:
curl -X DELETE http://localhost:8080/actuator/my?content=endpointDELETE
上面只是简单自定义实例,根据具体的业务场景,可以定义更加丰富的端点实现。


 浙公网安备 33010602011771号