
Prometheus + Grafana(一)Prometheus安装部署
1.下载安装
为您的平台下载最新版本的prometheus,然后将其解压缩:
tar xvfz prometheus-*.tar.gz
cd prometheus-*
2.配置
根目录下的prometheus.yml文件(默认配置):
# my global config
global:
  scrape_interval:     15s # Set the scrape interval to every 15 seconds. Default is every 1 minute.
  evaluation_interval: 15s # Evaluate rules every 15 seconds. The default is every 1 minute.
  # scrape_timeout is set to the global default (10s).

# Alertmanager configuration
alerting:
  alertmanagers:
  - static_configs:
    - targets:
      # - alertmanager:9093

# Load rules once and periodically evaluate them according to the global 'evaluation_interval'.
rule_files:
  # - "first_rules.yml"
  # - "second_rules.yml"

# A scrape configuration containing exactly one endpoint to scrape:
# Here it's Prometheus itself.
scrape_configs:
  # The job name is added as a label `job=<job_name>` to any timeseries scraped from this config.
  - job_name: 'prometheus'

    # metrics_path defaults to '/metrics'
    # scheme defaults to 'http'.

    static_configs:
    - targets: ['localhost:9090']
3.启动
根目录下执行以下命令:
./prometheus --config.file=prometheus.yml
正常情况下,你可以看到如下输出内容:
level=info ts=2018-10-23T14:55:14.499484Z caller=main.go:554 msg="Starting TSDB ..."
level=info ts=2018-10-23T14:55:14.499531Z caller=web.go:397 component=web msg="Start listening for connections" address=0.0.0.0:9090
level=info ts=2018-10-23T14:55:14.507999Z caller=main.go:564 msg="TSDB started"
level=info ts=2018-10-23T14:55:14.508068Z caller=main.go:624 msg="Loading configuration file" filename=prometheus.yml
level=info ts=2018-10-23T14:55:14.509509Z caller=main.go:650 msg="Completed loading of configuration file" filename=prometheus.yml
level=info ts=2018-10-23T14:55:14.509537Z caller=main.go:523 msg="Server is ready to receive web requests."
4.使用表达试浏览器
让我们看看prometheus收集到的一些关于自己的数据。要使用普罗米修斯的内置表达式浏览器,
请导航到 http://localhost:9090/graph 并在“graph”选项卡中选择“Console”视图。

您可以从 http://localhost:9090/metrics 收集,prometheus导出的关于其自身的一个度量称为 promhttp_metric_handler_requests_total (prometheus服务器已服务的/metrics请求总数)。
继续并将其输入到表达式控制台中:
promhttp_metric_handler_requests_total
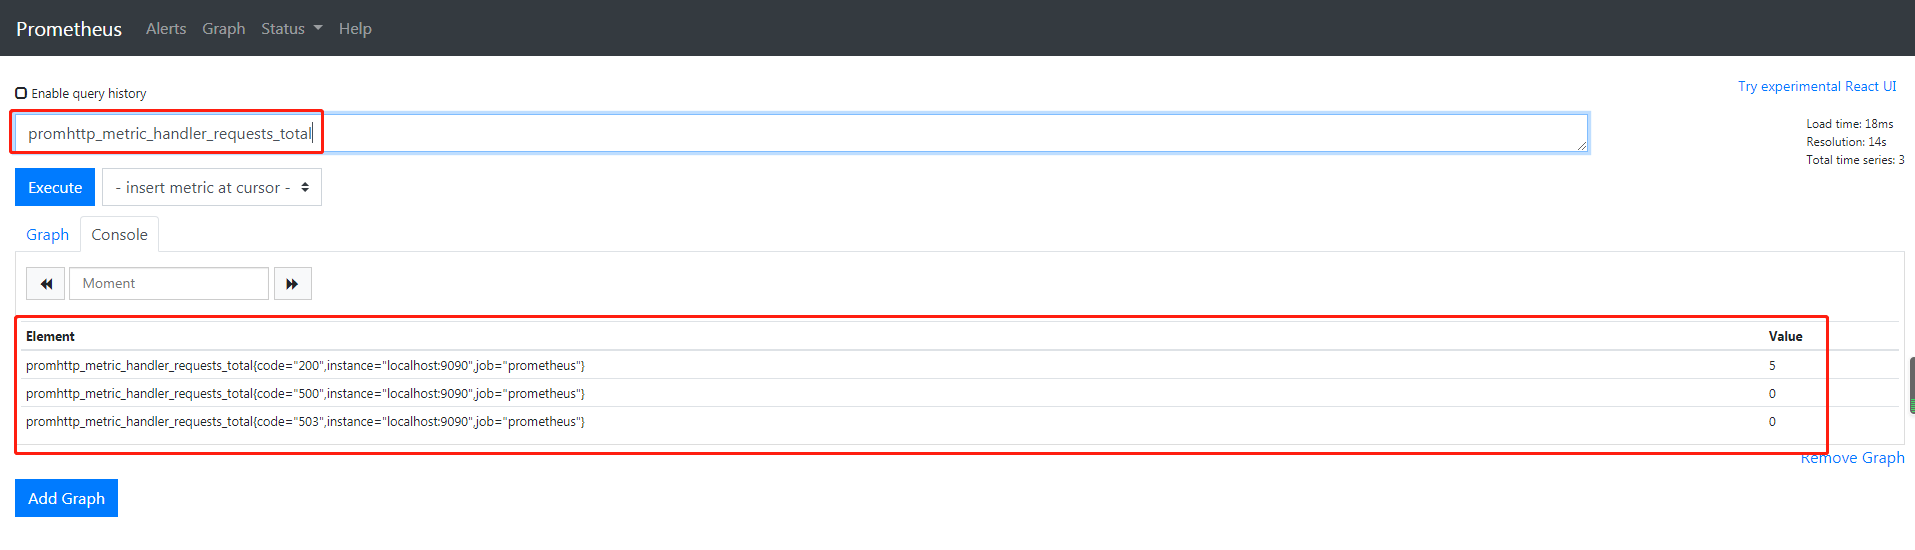
如果我们只对导致HTTP代码200的请求感兴趣,则可以使用此查询检索该信息:
promhttp_metric_handler_requests_total{code="200"}

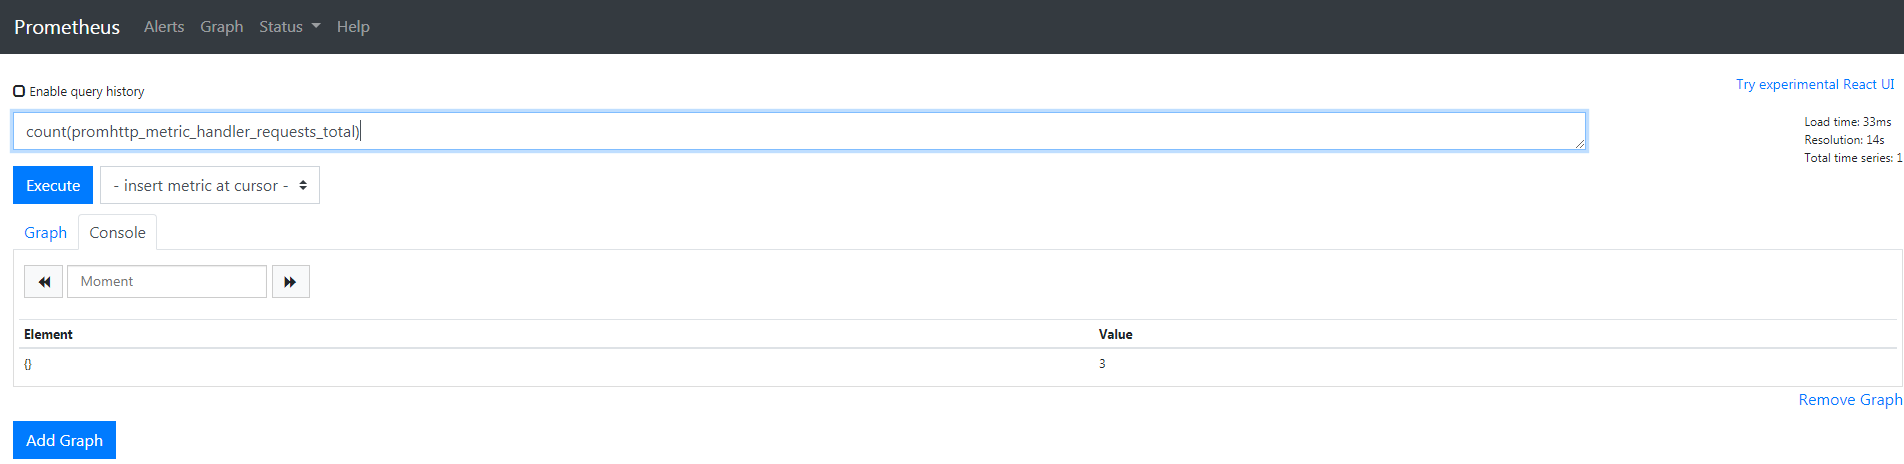
要计算返回的时间序列数,可以编写:
count(promhttp_metric_handler_requests_total)
有关表达式语言的更多信息,请参见: expression language documentation
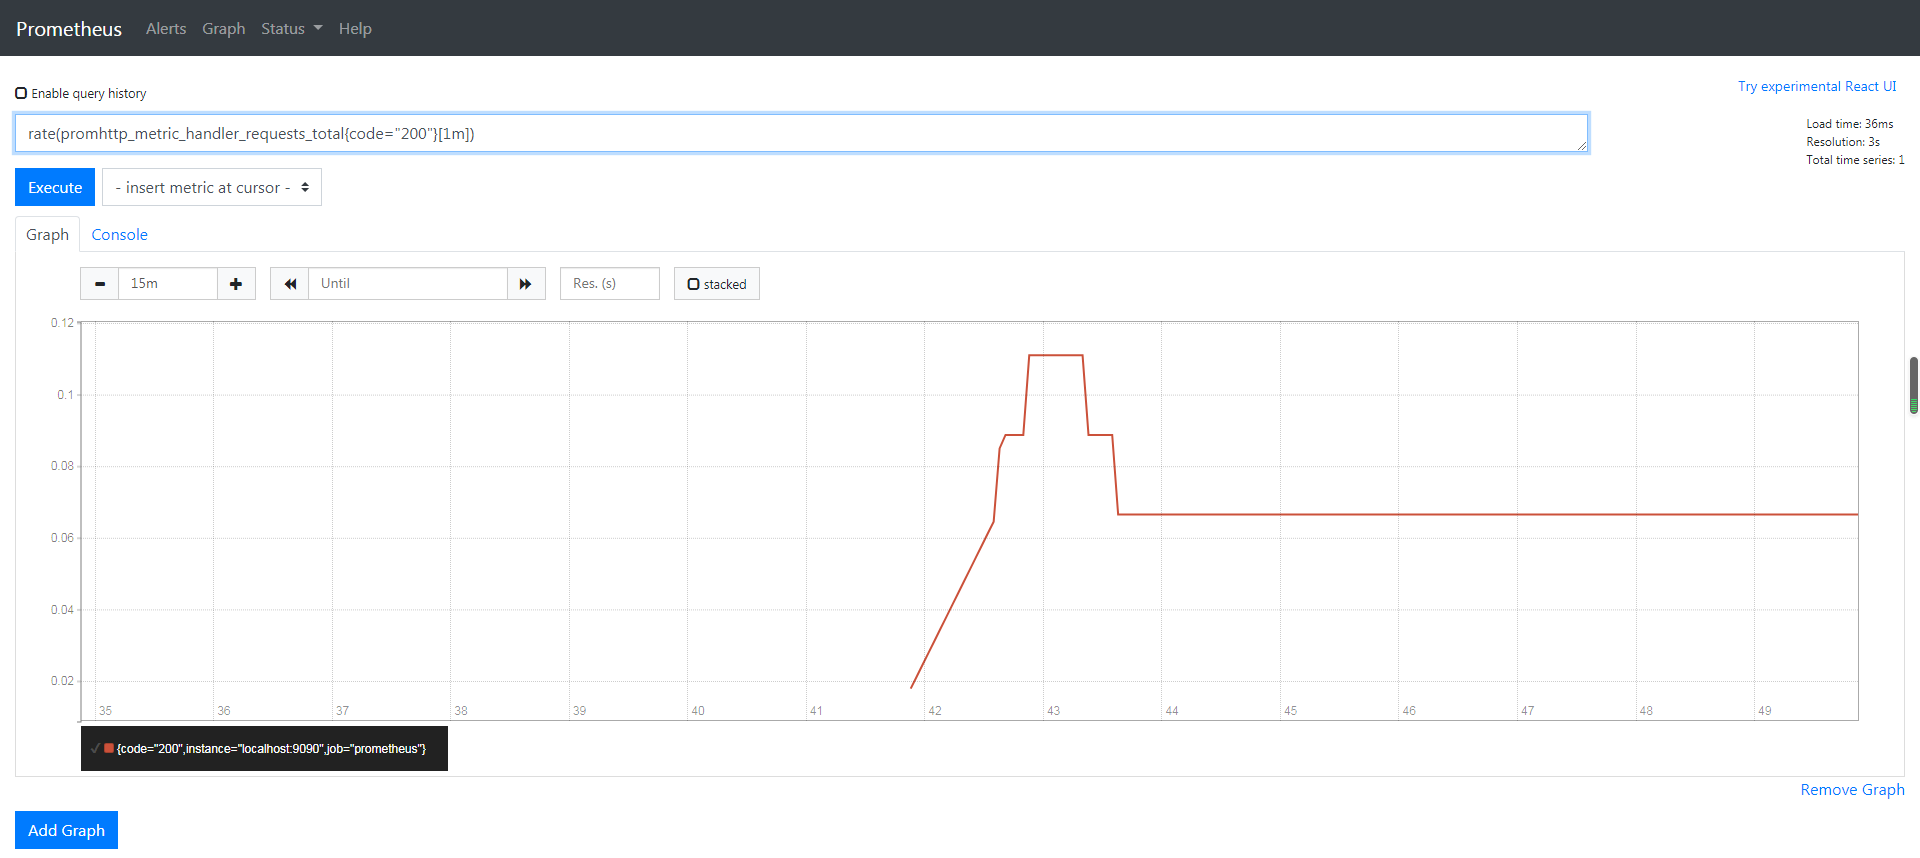
5.使用图形界面
要绘制表达式,请导航到http://localhost:9090/graph并使用“graph”选项卡。
例如,输入以下表达式以图形化每秒在prometheus中发生的返回状态代码200的HTTP请求速率:
rate(promhttp_metric_handler_requests_total{code="200"}[1m])


 浙公网安备 33010602011771号