生成数据(matplotlib初步)
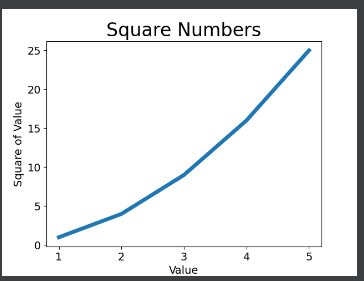
一、绘制简单的折线图
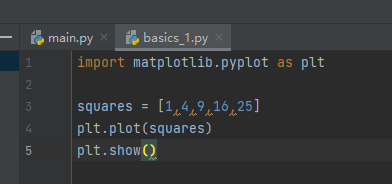
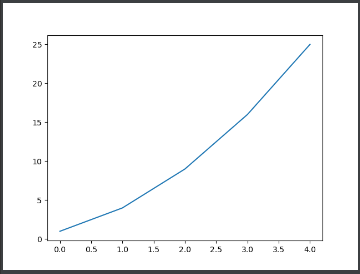
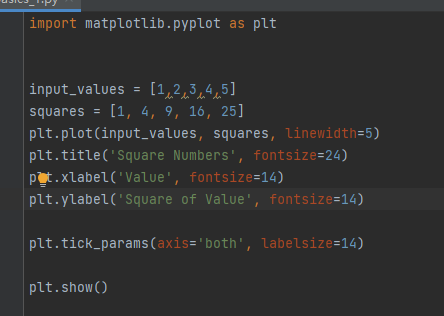
1、修改标签文字和线条粗细

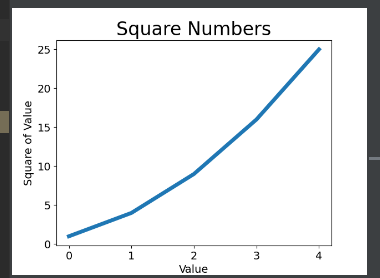

2、校正图形

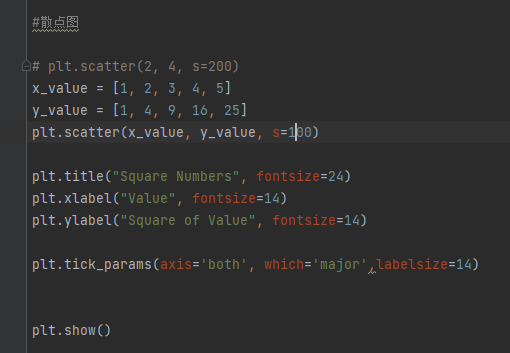
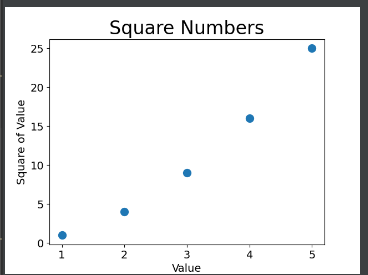
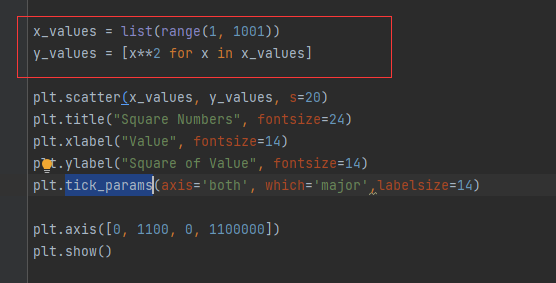
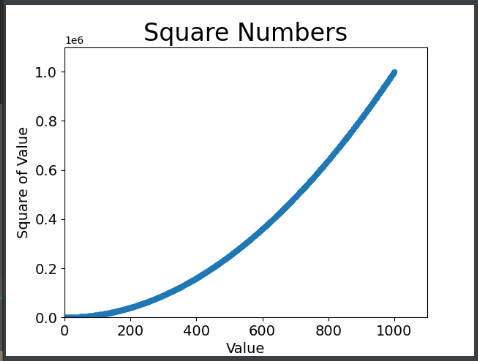
3、使用scatter() 绘制散点图并设置其样式
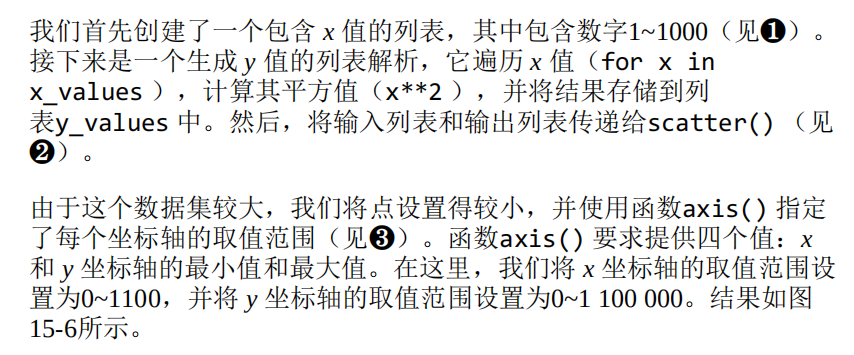
4、自动计算数据

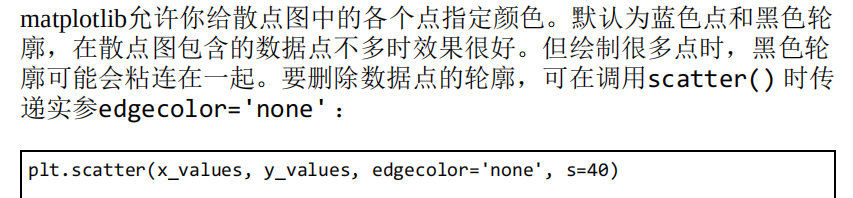
5、删除数据点的轮廓
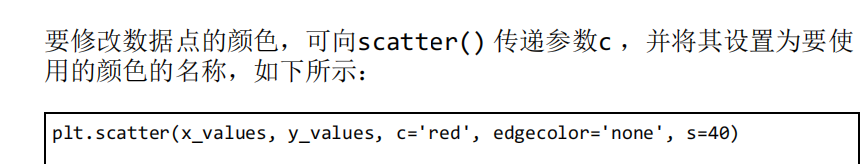
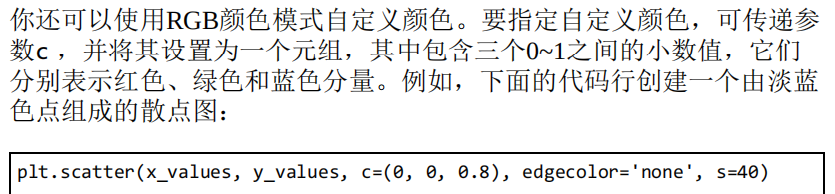
6、自定义颜色
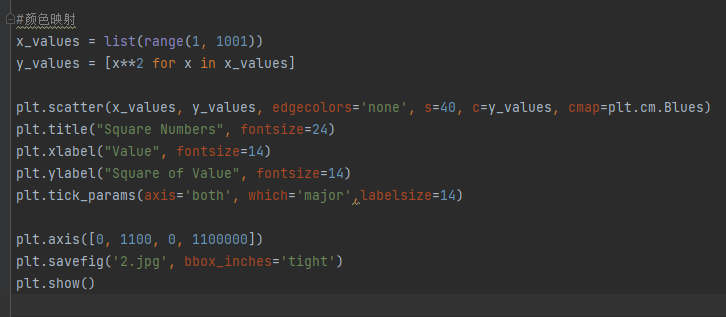
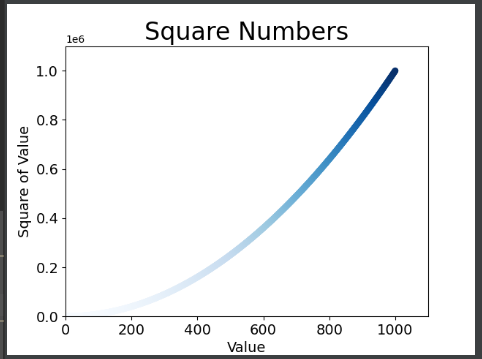
7、使用颜色映射

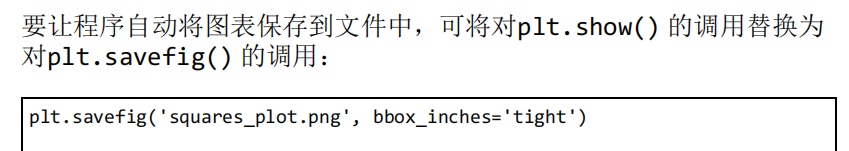
8、自动保存图表

二、随机漫步
在本节中,我们将使用Python来生成随机漫步数据,再使用matplotlib以引人瞩目的方式将这些数据呈现出来。随机漫步 是这样行走得到的路
径:每次行走都完全是随机的,没有明确的方向,结果是由一系列随机决策决定的。你可以这样认为,随机漫步就是蚂蚁在晕头转向的情况
下,每次都沿随机的方向前行所经过的路径。在自然界、物理学、生物学、化学和经济领域,随机漫步都有其实际用途。例如,漂浮在水滴上的花粉因不断受到水分子的挤压而在水面上移
动。水滴中的分子运动是随机的,因此花粉在水面上的运动路径犹如随机漫步。我们稍后将编写的代码模拟了现实世界的很多情形。
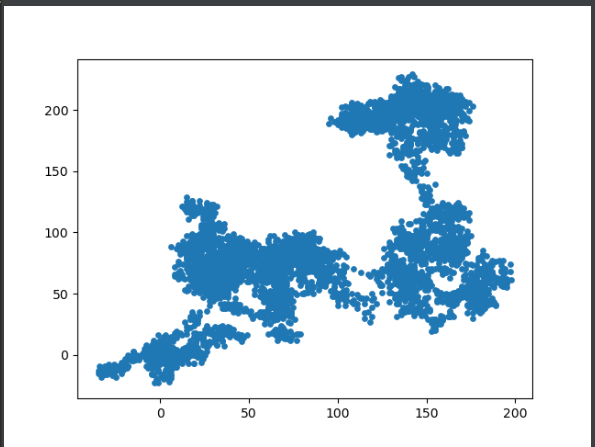
1、RandomWalk()
from random import choice

class RandomWalk():

    def __init__(self, num_points=5000):
        self.num_points = num_points
        self.x_value = [0]
        self.y_value = [0]


    def fill_walk(self):

        while len(self.x_value)<self.num_points:

            x_direction = choice([1,-1])
            x_distance = choice([0,1,2,3,4])
            x_step = x_distance * x_direction

            y_direction = choice([1,-1])
            y_distance = choice([0,1,2,3,4])
            y_step = y_distance * y_direction

            if x_step == 0 and y_step == 0:
                continue

            next_x = self.x_value[-1] + x_step
            next_y = self.y_value[-1] + y_step

            self.x_value.append(next_x)
            self.y_value.append(next_y)
import matplotlib.pyplot as plt

import random_walk

rw = random_walk.RandomWalk()
rw.fill_walk()
plt.scatter(rw.x_value, rw.y_value, s=15)
plt.show()
2、多次随机漫步
import matplotlib.pyplot as plt

import random_walk

while True:
    rw = random_walk.RandomWalk()
    rw.fill_walk()
    plt.scatter(rw.x_value, rw.y_value, s=15)
    plt.show()

    keep = input("还要继续吗?y/n")
    if keep == 'n':
        break
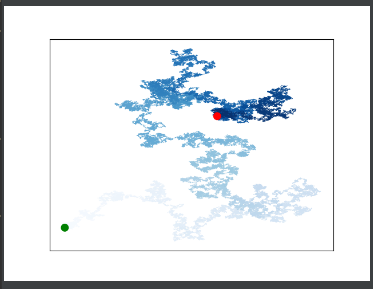
3、最终随机漫步
使用了5万个点,隐藏了坐标轴,突出了起点和终点
import matplotlib.pyplot as plt

import random_walk

#循环随机漫步
while True:
    rw = random_walk.RandomWalk(50000)
    rw.fill_walk()


    #隐藏坐标轴

    current_axes=plt.axes()
    current_axes.xaxis.set_visible(False)
    current_axes.yaxis.set_visible(False)

    point_numbers = list(range(rw.num_points))
    plt.scatter(rw.x_value, rw.y_value, c=point_numbers, cmap=plt.cm.Blues, edgecolors='none', s=1)

    #突出起点和终点
    plt.scatter(0, 0, c='green', edgecolors='none', s=100)
    plt.scatter(rw.x_value[-1], rw.y_value[-1], c='red', edgecolors='none', s=100)


    #隐藏坐标轴,这样写会出错
    # plt.axes().get_xaxis().set_visible(False)
    # plt.axes().get_yaxis().set_visible(False)

    plt.show()
    keep = input("还要继续吗?y/n")
    if keep == 'n':
        break
三、使用Pygal模拟掷骰子
1、创建 骰子类
from random import randint

class Die():

    def __init__(self, num_sides=6):
        self.num_sides = num_sides

    def roll(self):
        return randint(1, self.num_sides)
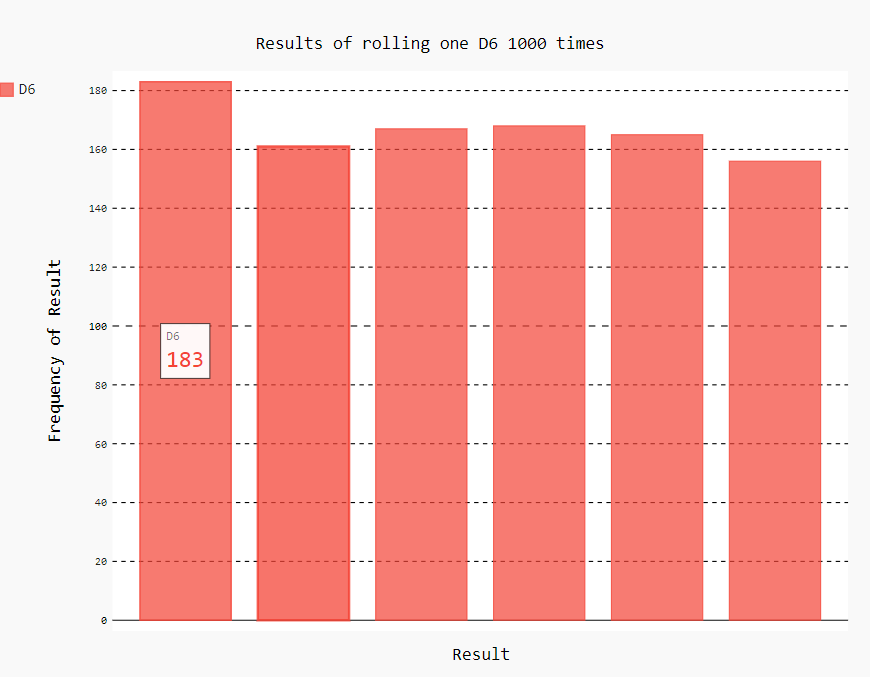
2、使用直方图对掷骰子的情况进行可视化
from die import Die
import pygal

  #掷骰子
die = Die()
results=[]
for roll_num in range(1000):
    result = die.roll()
    results.append(result)

 #分析结果
frequencies = []
for value in range(1,die.num_sides+1):
    frequency = results.count(value)
    frequencies.append(frequency)

# print(frequencies)

#对结果进行可视化
hist = pygal.Bar()
hist.title = "Results of rolling one D6 1000 times"
hist.x_laels = ['1', '2', '3', '4', '5', '6']
hist.x_title = "Result"
hist.y_title = "Frequency of Result"

hist.add('D6', frequencies)
hist.render_to_file('die_visual.svg')
可视化情况(svg文件使用web浏览器打开)
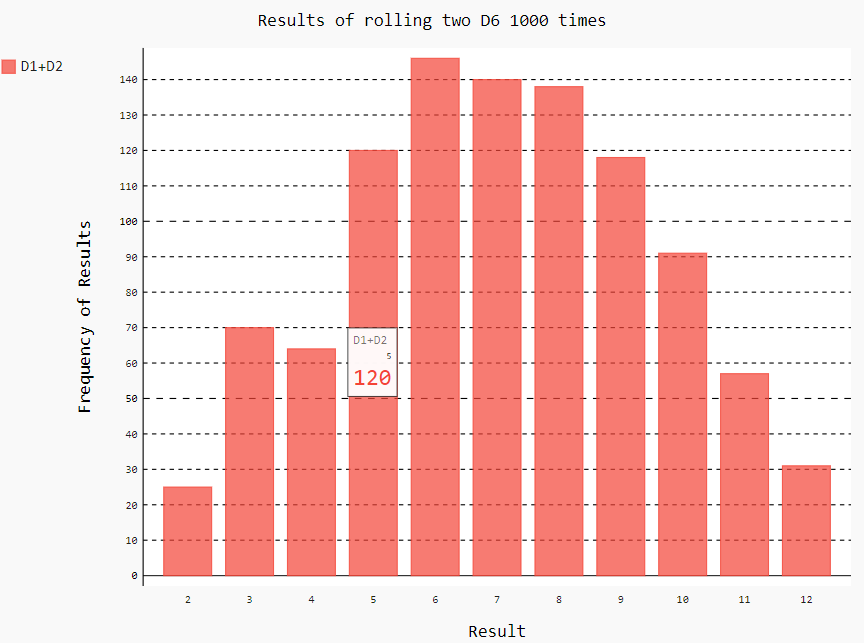
3、掷两个骰子
#掷两个骰子
die1 = Die()
die2 = Die()
results=[]

for roll_num in range(1000):
    result = die1.roll()+die2.roll()
    results.append(result)

fres=[]
max = die1.num_sides+die2.num_sides
for value in range(2,max+1):
    fre=results.count(value)
    fres.append(fre)
# print(fres)
hist = pygal.Bar()
hist.title='Results of rolling two D6 1000 times'
hist.x_labels=['2', '3', '4', '5', '6', '7', '8', '9', '10', '11', '12']
hist.x_title="Result"
hist.y_title="Frequency of Results"

hist.add('D1+D2', fres)
hist.render_to_file('die2.svg')

 浙公网安备 33010602011771号