![]()
import bresenham
import os
os.environ['OMP_NUM_THREADS'] = '1'
import matplotlib.patches as patches
from sklearn.cluster import KMeans
import numpy as np
from typing import List, Tuple
from kneed import KneeLocator
def get_global_bounds(all_routes: List[List[Tuple[float, float]]]) -> Tuple[float, float, float, float]:
"""获取所有路线的经纬度范围"""
all_lons = [p[0] for route in all_routes for p in route]
all_lats = [p[1] for route in all_routes for p in route]
lon_min, lon_max = min(all_lons), max(all_lons)
lat_min, lat_max = min(all_lats), max(all_lats)
# 处理零跨度情况
delta_lon = lon_max - lon_min
delta_lat = lat_max - lat_min
if delta_lon == 0:
delta_lon = 1e-9
lon_max = lon_min + delta_lon
if delta_lat == 0:
delta_lat = 1e-9
lat_max = lat_min + delta_lat
return lon_min, lon_max, lat_min, lat_max
def project_route_to_matrix(
points: List[Tuple[float, float]],
rows: int,
cols: int,
lon_min: float,
lon_max: float,
lat_min: float,
lat_max: float
) -> np.ndarray:
"""将单条路线投影到矩阵"""
matrix = np.zeros((rows, cols), dtype=int)
if not points:
return matrix
delta_lon = lon_max - lon_min
delta_lat = lat_max - lat_min
converted = []
for lon, lat in points:
# 经度转列索引
col = ((lon - lon_min) / delta_lon) * (cols - 1)
col = int(round(col))
col = np.clip(col, 0, cols - 1)
# 纬度转行索引(保持北纬在上)
row = ((lat_max - lat) / delta_lat) * (rows - 1)
row = int(round(row))
row = np.clip(row, 0, rows - 1)
converted.append((row, col))
# Bresenham算法生成路径
for i in range(len(converted) - 1):
start_row, start_col = converted[i]
end_row, end_col = converted[i + 1]
# line_points = bresenham(start_col, start_row, end_col, end_row)
line_points = bresenham.bresenham(start_col, start_row, end_col, end_row)
for col, row in line_points:
if 0 <= col < cols and 0 <= row < rows:
matrix[row, col] = 1
return matrix
def calculate_route_scores(route_matrices: List[np.ndarray], total_matrix: np.ndarray) -> List[int]:
"""计算每条路线的得分"""
return [np.sum(total_matrix * mat).tolist() for mat in route_matrices]
def extract_post_turn_points(route: List[Tuple[float, float]], turn_index: int = 2) -> List[Tuple[float, float]]:
"""提取右转后的路径点,并验证索引有效性"""
if len(route) <= turn_index:
raise ValueError(f"路径长度不足,无法从索引 {turn_index} 开始提取右转后的点")
return route[turn_index:]
def cluster_lanes(all_routes: List[List[Tuple[float, float]]],
rows: int,
cols: int,
lon_min: float,
lon_max: float,
lat_min: float,
lat_max: float,
turn_index: int = 2,
n_clusters: int = 3) -> Tuple[np.ndarray, List[int], float]:
features = []
for route in all_routes:
try:
post_turn = extract_post_turn_points(route, turn_index)
except ValueError as e:
print(f"警告: {e}, 已跳过该路径")
continue
matrix_points = []
for lon, lat in post_turn:
try:
delta_lon = lon_max - lon_min
delta_lat = lat_max - lat_min
col = int(round(((lon - lon_min) / delta_lon) * (cols - 1)))
row = int(round(((lat_max - lat) / delta_lat) * (rows - 1)))
matrix_points.append([col, row])
except ZeroDivisionError:
continue
if matrix_points:
median_col = np.median([p[0] for p in matrix_points])
median_row = np.median([p[1] for p in matrix_points])
features.append([median_col, median_row])
if len(features) < 2:
raise ValueError(f"有效特征数量不足 ({len(features)}), 至少需要3个路径生成特征")
kmeans = KMeans(n_clusters=n_clusters, random_state=0).fit(features)
# print(f"聚类轮廓: {kmeans.inertia_}")
return kmeans.cluster_centers_.tolist(), kmeans.labels_.tolist(), kmeans.inertia_
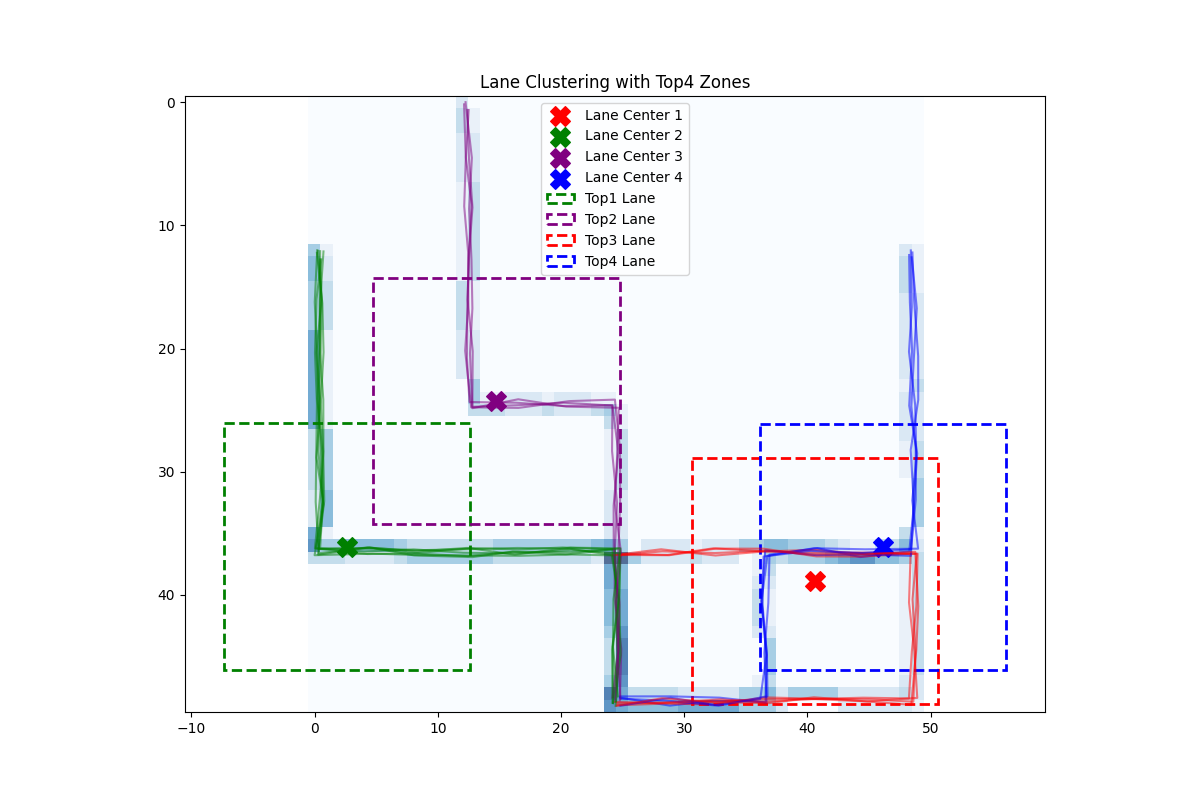
def visualize_lanes(total_matrix: np.ndarray,
cluster_centers: np.ndarray,
lane_labels: List[int],
all_routes: List[List[Tuple[float, float]]],
rows: int,
cols: int):
plt.figure(figsize=(12, 8))
# 显示总覆盖热力图
plt.imshow(total_matrix, cmap='Blues', alpha=0.7)
# 标注聚类中心
colors = ['red', 'green', 'purple', 'blue', 'orange', 'gray', 'pink', 'brown', 'yellow']
for i, center in enumerate(cluster_centers):
col, row = center
plt.scatter(col, row, s=200, c=colors[i], marker='X', label=f'Lane Center {i + 1}')
# 绘制路线颜色区分车道
for idx, route in enumerate(all_routes):
lane_id = lane_labels[idx]
# 转换路线坐标
x = [((lon - lon_min) / (lon_max - lon_min)) * (cols - 1) for lon, _ in route]
y = [((lat_max - lat) / (lat_max - lat_min)) * (rows - 1) for _, lat in route]
plt.plot(x, y, color=colors[lane_id], alpha=0.5)
# 标注Top n车道区域
sorted_lanes = sorted(enumerate(cluster_centers),
key=lambda x: x[1][0]) # 按列坐标排序
for rank, (orig_idx, center) in enumerate(sorted_lanes[:4]):
col, row = center
plt.gca().add_patch(
patches.Rectangle(
(col - 10, row - 10), 20, 20,
linewidth=2,
edgecolor=colors[orig_idx],
facecolor='none',
linestyle='--',
label=f'Top{rank + 1} Lane'
))
plt.legend()
plt.title(f"Lane Clustering with Top{len(set(lane_labels))} Zones")
plt.show()
# 示例使用
if __name__ == "__main__":
# 模拟三条测试路线
# all_routes =[[[30.274111, 120.155781], [30.274109, 120.155925], [30.274094, 120.156235], [30.274082, 120.156815], [30.274106, 120.157246]], [[30.273936, 120.155886], [30.273962, 120.156043], [30.274018, 120.15635], [30.274049, 120.156828], [30.274034, 120.157598]], [[30.273995, 120.155873], [30.274011, 120.156024], [30.274046, 120.156306], [30.274079, 120.156801], [30.274101, 120.157548]], [[30.274113, 120.155758], [30.274099, 120.155916], [30.274106, 120.156222], [30.274095, 120.156802], [30.274111, 120.157601]], [[30.274079, 120.15586], [30.274063, 120.156003], [30.27405, 120.156306], [30.274051, 120.156836], [30.27404, 120.157489]], [[30.274206, 120.15574], [30.27417, 120.155894], [30.274144, 120.156173], [30.274108, 120.156814], [30.274099, 120.157415]], [[30.27418, 120.155807], [30.274159, 120.155966], [30.274136, 120.156261], [30.274083, 120.156831], [30.27407, 120.157366]], [[30.274219, 120.155805], [30.274188, 120.155958], [30.274159, 120.156269], [30.274092, 120.156833], [30.274095, 120.157482]], [[30.273965, 120.155842], [30.274011, 120.155989], [30.274058, 120.156307], [30.274113, 120.156818], [30.274133, 120.157562]], [[30.274097, 120.155762], [30.274094, 120.155916], [30.274113, 120.156212], [30.27411, 120.156797], [30.27409, 120.157581]], [[30.274135, 120.155844], [30.27412, 120.156002], [30.274105, 120.15628], [30.274091, 120.156817], [30.274073, 120.157304]], [[30.274213, 120.155852], [30.274186, 120.155993], [30.274149, 120.156297], [30.274115, 120.156827], [30.274097, 120.157327]], [[30.274213, 120.155849], [30.274179, 120.155994], [30.274166, 120.156313], [30.274115, 120.156797], [30.274096, 120.157248]], [[30.27412, 120.155791], [30.274127, 120.155943], [30.274125, 120.156222], [30.274115, 120.156818], [30.274134, 120.157486]], [[30.273993, 120.155785], [30.274019, 120.155936], [30.274033, 120.156252], [30.274088, 120.156828], [30.274116, 120.157493]]]
with open('routes.txt', 'r') as f:
all_routes = eval(f.read())
# 计算全局基准坐标
lon_min, lon_max, lat_min, lat_max = get_global_bounds(all_routes)
# 设置矩阵尺寸
rows, cols = 50, 50
# 生成各路线矩阵
route_matrices = []
for route in all_routes:
mat = project_route_to_matrix(
route, rows, cols,
lon_min, lon_max, lat_min, lat_max
)
route_matrices.append(mat)
# 生成总覆盖矩阵
total_matrix = np.sum(route_matrices, axis=0)
# 计算得分
scores = calculate_route_scores(route_matrices, total_matrix)
# 显示结果
print(f"总覆盖矩阵最大值: {np.max(total_matrix)}")
print(f"各路线得分: {scores}")
print(f"最优路线索引: {np.argmax(scores)}")
# 显示路线
import matplotlib.pyplot as plt
plt.imshow(total_matrix, cmap='gray')
# 显示每条路线
# for i, mat in enumerate(route_matrices):
# plt.imshow(mat, cmap='gray', alpha=0.5)
# plt.title(f"Route {i+1} Score: {scores[i]}")
# plt.show()
# 步骤1:聚类车道
n_clus_range = range(2, 8)
n_clus_scores = []
for _n_clus in n_clus_range:
centers, labels, inertia = cluster_lanes(
all_routes, rows, cols,
lon_min, lon_max, lat_min, lat_max,
turn_index=2, # 假设第3个点开始为右转后
n_clusters=_n_clus # 假设有4个车道
)
label_static = [{f'标签': label, '数量': labels.count(label)} for label in set(labels)]
print(f"k = {_n_clus}, inertia: {inertia}, 车道标签: {label_static}")
n_clus_scores.append(inertia)
# 步骤2:计算车道得分(假设使用总覆盖频次)
lane_scores = [0] * _n_clus
for route_idx, lane_id in enumerate(labels):
lane_scores[lane_id] += np.sum(route_matrices[route_idx])
# 步骤3:获取Top n车道ID
top_n_lanes = sorted(enumerate(lane_scores), key=lambda x: -x[1])[:_n_clus]
# print(f"Top{_n_clus}车道ID及得分: {top_n_lanes}")
# 步骤4:可视化
visualize_lanes(total_matrix, centers, labels, all_routes, rows, cols)
# 使用Kneedle算法自动检测拐点(需安装kneed库)
kneedle = KneeLocator(n_clus_range, n_clus_scores, curve="convex", direction="decreasing")
best_k = kneedle.elbow
print(f"最佳聚类数: {best_k}")
plt.xticks(n_clus_range)
plt.plot(n_clus_range, n_clus_scores, marker="o")
plt.show()


 浙公网安备 33010602011771号