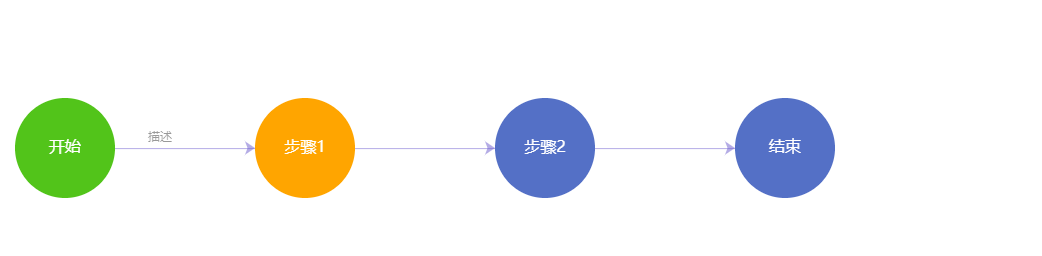
ECharts 流程图示例
<!DOCTYPE html>
<html>
<head>
<meta charset="UTF-8">
<title>ECharts 流程图示例</title>

    <script src="https://cdn.jsdelivr.net/npm/echarts@5.4.3/dist/echarts.min.js"></script>
</head>
<body>
<div id="main" style="width: 900px; height: 1500px;"></div>
<script type="text/javascript">
var myChart = echarts.init(document.getElementById('main'));
var option = {
    tooltip: {
        trigger: 'item',
        triggerOn: 'mousemove'
    },
    series: [{
        type: 'graph',
        layout: 'none', // 不使用自动布局,手动指定节点位置
        symbolSize: 100,
        roam: true, // 允许缩放和平移
        label: {
            show: true,
            fontSize: 16,
            color: '#FFF'
        },
        edgeSymbol: ['none', 'arrow'],
        symbol:"circle",
        edgeSymbolSize: [4, 10],
        edgeLabel: {
            fontSize: 12
        },
    data: [
        { name: '开始',
            x: 100,
            y: 100 ,
            //category: 0,
            itemStyle: {
                color: '#52c41a'
            }
        },
        { name: '步骤1', x: 300, y: 100,itemStyle: { color: 'orange' }},
        { name: '步骤2', x: 500, y: 100 },
        { name: '结束', x: 700, y: 100 }
    ],
    links: [
        { source: '开始', target: '步骤1' ,label: {
                                show: true,
                                formatter: '描述'
                            }},
        { source: '步骤1', target: '步骤2' },
        { source: '步骤2', target: '结束' }
    ],
    lineStyle: {
        color: '#6A5ACD'
    }
    }]
};
myChart.setOption(option);
</script>
</body>
</html>
![image]()

 posted on

 浙公网安备 33010602011771号