
实验七
实验1
实验源码


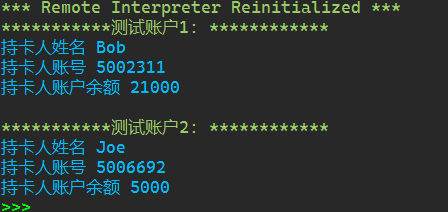
 1 class Account:
 2     def __init__(self,name,account_number,initial_amount = 10):
 3         self._name = name
 4         self._card_no = account_number
 5         self._balance = initial_amount
 6
 7     def deposit(self,amount):
 8         self._balance += amount
 9     def withdraw(self,amount):
10         if self._balance < amount:
11             print('余额不足')
12             return
13
14         self._balance -= amount
15     def info(self):
16         print('持卡人姓名', self._name)
17         print('持卡人账号', self._card_no)
18         print('持卡人账户余额', self._balance)
19     def get_balance(self):
20         return self._balance
21
22 def main():
23     print('测试账户1: '.center(30,'*'))
24     a1 = Account('Bob','5002311',20000)
25     a1.deposit(5000)
26     a1.withdraw(4000)
27     a1.info()
28
29     print()
30
31     print('测试账户2: '.center(30,'*'))
32     a2 = Account('Joe','5006692',20000)
33     a2.withdraw(10000)
34     a2.withdraw(5000)
35     a2.info()
36
37 if __name__ == '__main__':
38     main()
实验截图
实验2
shape.py
实验源码
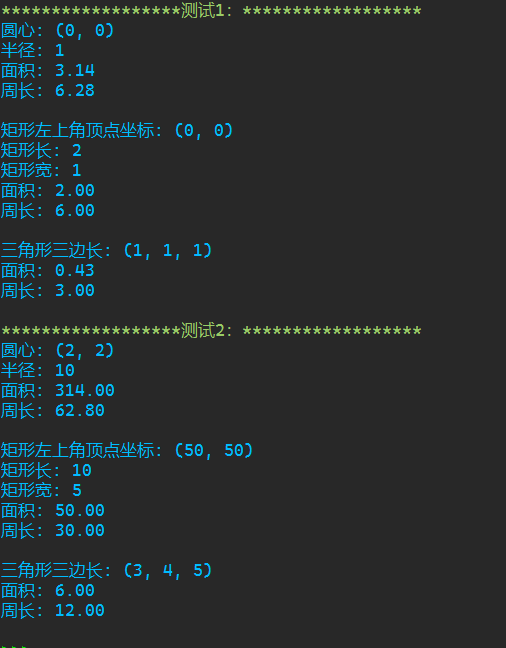
 1 class Shape:
 2     def info(self):
 3         pass
 4     def area(self):
 5         pass
 6     def preimeter(self):
 7         pass
 8 class Rect(Shape):#矩形类
 9     def __init__(self, x = 0, y = 0, length = 2, width = 1):
10         self._x = x
11         self._y = y
12         self._width = width
13         self._length = length
14     def info(self):#打印图片信息
15         print(f'矩形左上角顶点坐标: ({self._x}, {self._y})')
16         print(f'矩形长: {self._length}')
17         print(f'矩形宽: {self._width}')
18     def area(self):#面积
19         return self._length * self._width
20     def perimeter(self):#周长
21         return (self._length + self._width) * 2
22 class Circle(Shape):
23     def __init__(self, x = 0, y = 0, radius = 1):
24         self._x = x
25         self._y = y
26         self._r = radius
27     def info(self):
28         print(f'圆心: ({self._x}, {self._y})')
29         print(f'半径: {self._r}')
30     def area(self):
31         return 3.14 * self._r * self._r
32     def perimeter(self):
33         return 2 * 3.14 * self._r
34 class Triangle(Shape):
35     def __init__(self, a = 1, b = 1, c = 1):
36         self._a, self._b, self._c = a, b, c
37     def info(self):
38         print(f'三角形三边长: ({self._a}, {self._b}, {self._c})')
39     def area(self):
40         s = (self._a + self._b + self._c) / 2
41         ans = (s*(s - self._a)*(s - self._b)*(s - self._c)) ** 0.5
42         return ans
43     def perimeter(self):
44         return (self._a + self._b + self._c)
45 def main():
46     print('测试1:'.center(40, '*'))
47     shapes_lst1 = [Circle(), Rect(), Triangle()]
48     for t in shapes_lst1:
49         t.info()
50         print(f'面积: {t.area():.2f}')
51         print(f'周长: {t.perimeter():.2f}')
52         print()
53     print('测试2:'.center(40, '*'))
54     shapes_lst2 = [Circle(x = 2, y = 2, radius = 10),
55                    Rect(x = 50, y = 50, length = 10, width = 5),
56                    Triangle(a = 3, b = 4, c = 5)]
57     for t in shapes_lst2:
58         t.info()
59         print(f'面积: {t.area():.2f}')
60         print(f'周长: {t.perimeter():.2f}')
61         print()
62 if __name__ == '__main__':
63     main()
实验截图
task2.py
实验源码
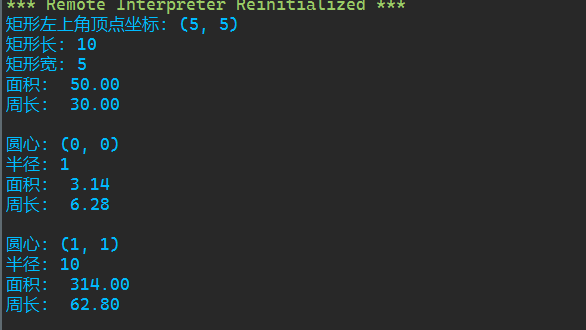
1 from shape import Rect, Circle
2
3 shape_lst = [Rect(5,5,10,5),Circle(),Circle(1,1,10)]
4
5 for i in shape_lst:
6     i.info()
7     print(f'面积: {i.area(): .2f}')
8     print(f'周长: {i.perimeter(): .2f}')
9     print()
实验截图
实验3
实验源码
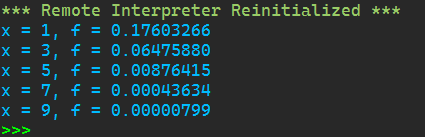
 1 from math import*
 2
 3 def func(x):
 4     m = 0
 5     s = 2
 6     a = 1/(s* (2*pi)**0.5)
 7     b = exp(-0.5* (x/s)**2)
 8     return a*b
 9
10 for i in [1,3,5,7,9]:
11     print(f'x = {i}, f = {func(i):.8f}')
实验截图
实验4
random_walk.py
实验源码
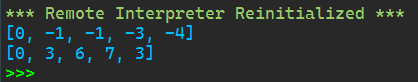
 1 from random import choice
 2
 3 class RandomWalk():
 4     def __init__(self,num_points = 5000):
 5         self.num_points = num_points
 6
 7         self.x_values = [0]
 8         self.y_values = [0]
 9     def fill_walk(self):
10         while len(self.x_values) < self.num_points:
11             x_direction = choice([1,-1])
12             x_distanse = choice([0,1,2,3,4])
13             x_step = x_direction * x_distanse
14
15             y_direction = choice([1,-1])
16             y_distanse = choice([0,1,2,3,4])
17             y_step = y_direction * y_distanse
18
19
20             if x_step == 0 and y_step == 0:
21                 continue
22
23             next_x = self.x_values[-1] + x_step
24             next_y = self.y_values[-1] + y_step
25
26             self.x_values.append(next_x)
27             self.y_values.append(next_y)
28
29 def main():
30     rw = RandomWalk(5)
31     rw.fill_walk()
32     print(rw.x_values)
33     print(rw.y_values)
34
35 if __name__ == '__main__':
36     main()
实验截图
task4
实验源码
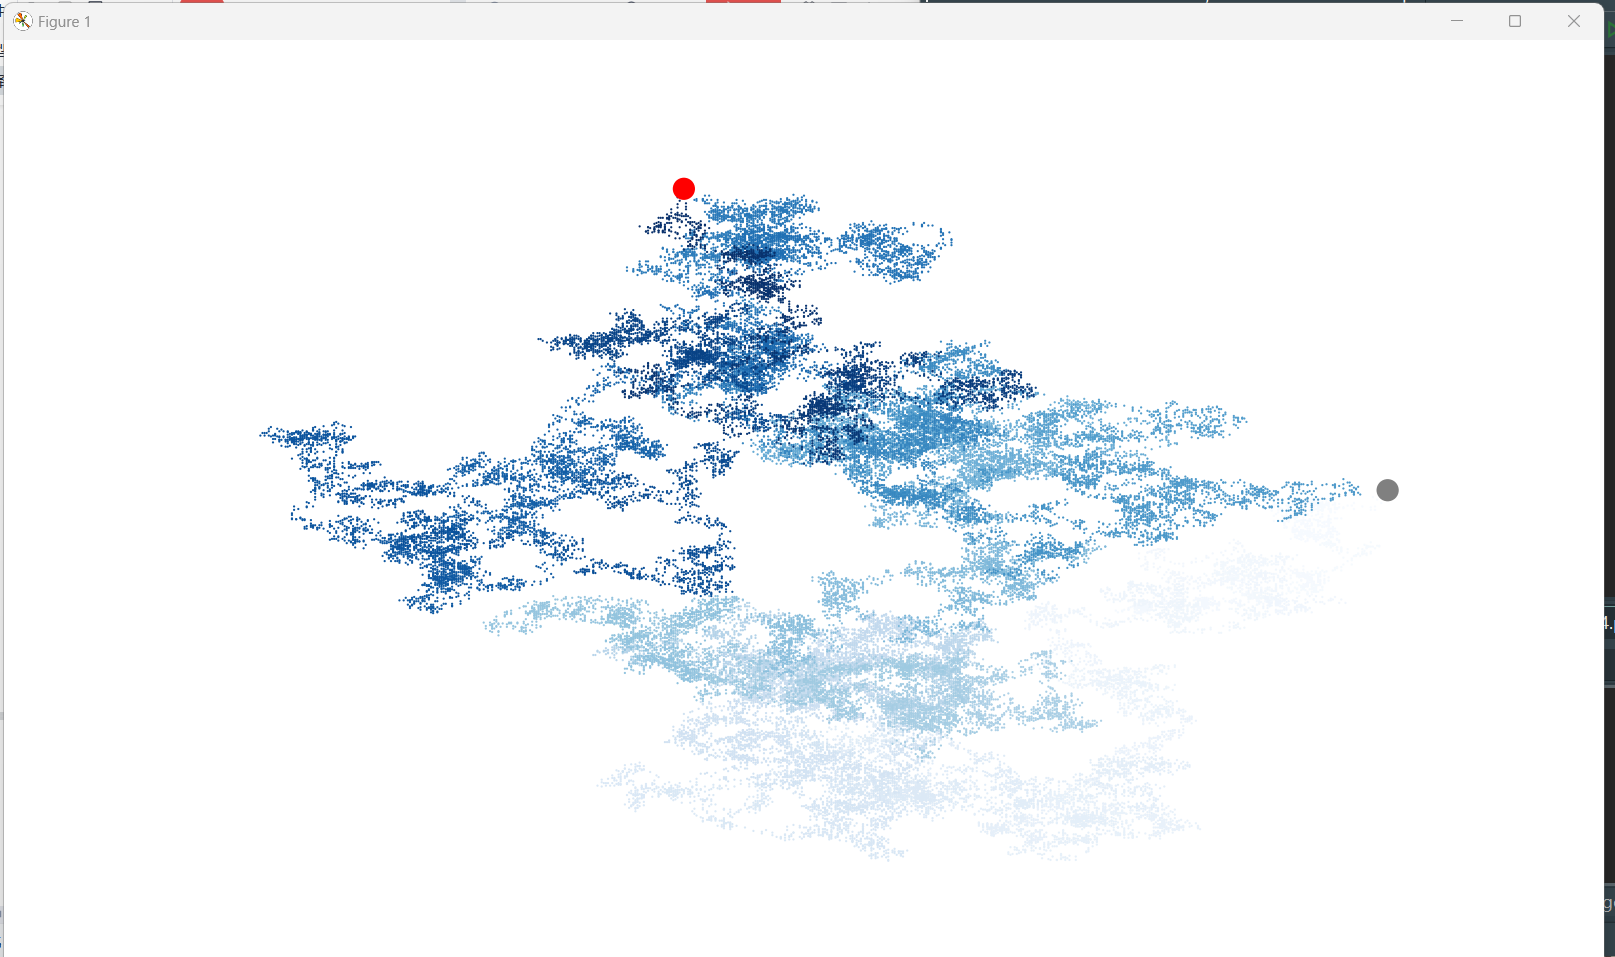
 1 from matplotlib import pyplot as plt
 2 from random_walk import RandomWalk
 3 from time import sleep
 4
 5 # 代码范例中,模拟两次随机漫步过程
 6 n = 0
 7 while n < 2:
 8     n += 1
 9 # 创建一个RandomWalk对象,调用其方法生成随机游走坐标
10     rw = RandomWalk(50000)
11     rw.fill_walk()
12 # 用散点图进行可视化绘制
13     plt.figure(figsize=(10,6), dpi= 128)
14     point_numbers = list(range(rw.num_points))
15     plt.scatter(rw.x_values,rw.y_values,c = point_numbers,
16     cmap = plt.cm.Blues,edgecolor='none',s = 1)
17 # 终点和起点
18     plt.scatter(0,0,c = 'grey', edgecolors='none', s=100)
19     plt.scatter(rw.x_values[-1],rw.y_values[-1],c = 'red',
20     edgecolors='none',s=100)
21 # 隐藏坐标轴
22     plt.axis('off')
23     plt.show()
实验截图

 浙公网安备 33010602011771号