数据挖掘实战 - 天池新人赛o2o优惠券使用预测
数据挖掘实战 - o2o优惠券使用预测
一、前言
大家好,家人们。今天是2021/12/14号。上次更新是2021/08/29。上篇文章中说到要开两个专题,果不其然我鸽了,这一鸽就是三个多月。今天,我不鸽(还要鸽)。那两个专题关于ResNet和GoogLeNet的文章还等缓缓一缓(一月份一定发),今天这篇文章是关于数据挖掘实战入门的例子,题目及数据集来源于 天池新人实战赛o2o优惠券使用预测,题目地址:https://tianchi.aliyun.com/competition/entrance/231593/introduction?spm=5176.12281973.1005.2.3dd52448rilGd8
二、赛题简介
赛题的主要任务就是,根据提供的数据来分析建模,精准预测用户在2016年7月领取优惠券15以内的使用情况,是否会在规定时间内使用相应优惠券。官网给的数据集主要有:
- ccf_offline_stage1_test_revised.csv : 用户线下优惠券使用预测样本
- cff_offline_stage1_train.zip:用户线下消费和优惠券领取行为
- cff_online_stage1_train.zip:用户线上点击/消费和优惠券领取行为
- sample_submission.csv:提交格式
具体属性特征详情请自行在网站中浏览:https://tianchi.aliyun.com/competition/entrance/231593/information,还有评价指标等这些信息大家自己在天池比赛官网里看一下吧,就不多说了。
三、代码实例
- 导入第三方库以及读入数据
import os, sys, pickle
import numpy as np
import pandas as pd
import matplotlib.pyplot as plt
from datetime import date
from sklearn.linear_model import SGDClassifier, LogisticRegression
import seaborn as sns
# 显示中文
plt.rcParams['font.sans-serif'] = [u'SimHei']
plt.rcParams['axes.unicode_minus'] = False

dfoff = pd.read_csv('./ccf_offline_stage1_train.csv')
dftest = pd.read_csv('./ccf_offline_stage1_test_revised.csv')
dfon = pd.read_csv('./ccf_online_stage1_train.csv')
print('data read end.')
2. 简单观察数据特征
# 简单的观察数据特征
print("dfoff的shape是",dfoff.shape)
print("dftest的shape是",dftest.shape)
print("dfon的shape是",dfon.shape)
print(dfoff.describe())
print(dftest.describe())
print(dfon.describe())
dfoff.head()
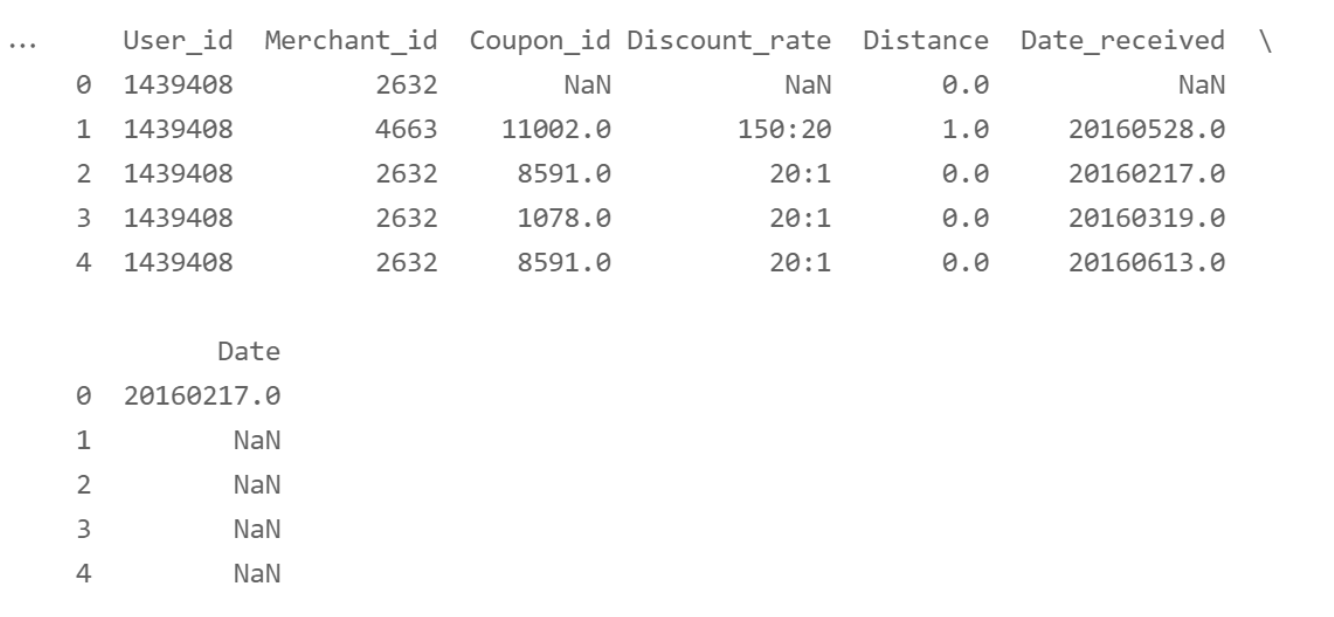
3. 用户线下消费和优惠券领取行为以及简单
-
User_id 用户ID
-
Merchant_id 商户ID
-
Coupon_id : null表示无优惠券消费,此时Discount_rate和Date_received字段无意义。"fixed"表示该交易时限时低价活动
-
Discount_rate 优惠率: \(x\in [0,1]\)代表折扣率; x:y表示满x减y;fixed表示低价限时优惠
-
Distance :user经常活动的地点离该merchant的最近门店距离时x*500米(如果是连锁店,则取最近的一家门店), \(x\in[0,10]\); null表示无此信息,0表示低于500米,10表示大于5公里
-
Date_received 领取优惠券时间 消费日期:如果Date=null & Coupon_id != null,该记录表示领取优惠券但没有使用;
-
Date:消费日期:如果Date=null & Coupon_id != null,该记录表示领取优惠券但没有使用;如果Date!=null & Coupon_id = null,则表示普通消费日期;如果Date!=null & Coupon_id != null,则表示用优惠券消
4. 简单的特征工程及数据处理
-
将满xx减yy类型(
xx:yy)的券变成优惠率 :\(1 - \frac{yy}{xx}\),同时提取出优惠券相关的三个新的特征discount_rate, discount_man, discount_jian, discount_type -
将距离
str转为intconvert Discount_rate and Distance -
补充Null值
def convertRate(row):
# 将满xx减yy变成折扣率
"""Convert discount to rate"""
if pd.isnull(row):
return 1.0
elif ':' in str(row):
rows = row.split(':')
return 1.0 - float(rows[1])/float(rows[0])
else:
return float(row)
# 从discount_rate中提取三个新的特征,把满xx减yy的xx和yy各自作为两个特征,是否有优惠券作为一个特征。
def getDiscountMan(row):
if ':' in str(row):
rows = row.split(':')
return int(rows[0])
else:
return 0
def getDiscountJian(row):
if ':' in str(row):
rows = row.split(':')
return int(rows[1])
else:
return 0
def getDiscountType(row):
# 对优惠率特征进行处理,返回的是空、1(有优惠)、0(没有优惠)
if pd.isnull(row):
return np.nan
elif ':' in row: # 则代表存在折扣
return 1
else:
return 0
def processData(df):
# convert discunt_rate
df['discount_rate'] = df['Discount_rate'].apply(convertRate)
df['discount_man'] = df['Discount_rate'].apply(getDiscountMan)
df['discount_jian'] = df['Discount_rate'].apply(getDiscountJian)
df['discount_type'] = df['Discount_rate'].apply(getDiscountType)
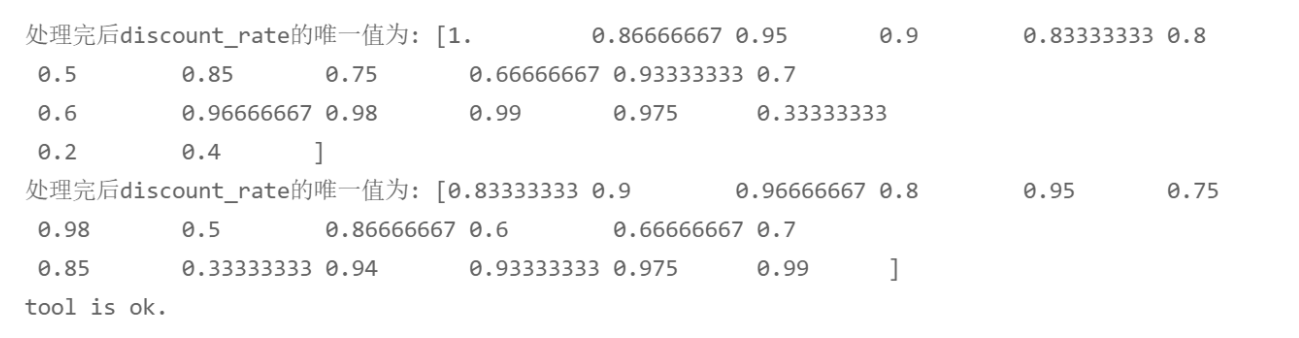
print("处理完后discount_rate的唯一值为:",df['discount_rate'].unique())
# convert distance
# 用-1填充,并转换成int类型
df['distance'] = df['Distance'].fillna(-1).astype(int)
return df
dfoff = processData(dfoff)
dftest = processData(dftest)
print("tool is ok.")
当处理到这里的时候你可以自己尝试去可视化优惠率区间的一个频率直方图。
5. 继续观察Data_received、Data的特征并进行以下处理
# 观察Date_received、Date特征并进行以下处理:
-
提取出date_received和date的唯一值并进行排序
-
提出两个新的特征:couponbydate和buybydate
-
当用户有优惠券时,通过领取优惠券时间分组时每个日期的数量
-
当用户消费并且领取了优惠券的时候,通过领取优惠券时间分组时每个日期的数量
-
将其转换为年月日的时间序列
-
通过转换后的时间序列,提取周一到周日新特征weekday_type
-
对weekday-type进行one-hot编码
-
提取标签y,-1表示没有领取优惠券,1表示15天内进行过消费(没有很好的考虑到那些没有优惠券且进行消费的人)
# 对领域优惠券时间的特征进行处理
date_received = dfoff['Date_received'].unique()
date_received = sorted(date_received[pd.notnull(date_received)]) # 提取出非空值的时间,并排序

# 对消费日期的特征进行处理
date_buy = dfoff['Date'].unique()
date_buy = sorted(date_buy[pd.notnull(date_buy)])
date_buy = sorted(dfoff[dfoff['Date'].notnull()]['Date'])

# 当用户有优惠券时,通过领取优惠券时间分组,并计算数量。提取为新的特征。
couponbydate = dfoff[dfoff['Date_received'].notnull()][['Date_received', 'Date']].groupby(['Date_received'], as_index=False).count()
couponbydate.columns = ['Date_received','count']

# 当用户消费并且领取了优惠券的时候,通过领取优惠券时间分组,并计算数量。提取为新的特征。
buybydate = dfoff[(dfoff['Date'].notnull()) & (dfoff['Date_received'].notnull())][['Date_received', 'Date']].groupby(['Date_received'], as_index=False).count()
buybydate.columns = ['Date_received','count']

def getWeekday(row):
    # 转换为年月日的时间序列
    if row == 'nan':
        return np.nan
    else:
        return date(int(row[0:4]), int(row[4:6]), int(row[6:8])).weekday() + 1
dfoff['weekday'] = dfoff['Date_received'].astype(str).apply(getWeekday)
dftest['weekday'] = dftest['Date_received'].astype(str).apply(getWeekday)
# weekday_type :  周六和周日为1,其他为0
dfoff['weekday_type'] = dfoff['weekday'].apply(lambda x : 1 if x in [6,7] else 0 )
dftest['weekday_type'] = dftest['weekday'].apply(lambda x : 1 if x in [6,7] else 0 )

# 对weekday_type进行one-hot编码
weekdaycols = ['weekday_' + str(i) for i in range(1,8)]
tmpdf = pd.get_dummies(dfoff['weekday'].replace('nan', np.nan)) # one-hot编码
tmpdf.columns = weekdaycols
dfoff[weekdaycols] = tmpdf

tmpdf = pd.get_dummies(dftest['weekday'].replace('nan', np.nan))
tmpdf.columns = weekdaycols
dftest[weekdaycols] = tmpdf


def label(row):
    if pd.isnull(row['Date_received']):
        return -1
    if pd.notnull(row['Date']):
        td = pd.to_datetime(row['Date'], format='%Y%m%d') -  pd.to_datetime(row['Date_received'], format='%Y%m%d')
        if td <= pd.Timedelta(15, 'D'):
            return 1
    return 0
dfoff['label'] = dfoff.apply(label, axis = 1)


print("end")
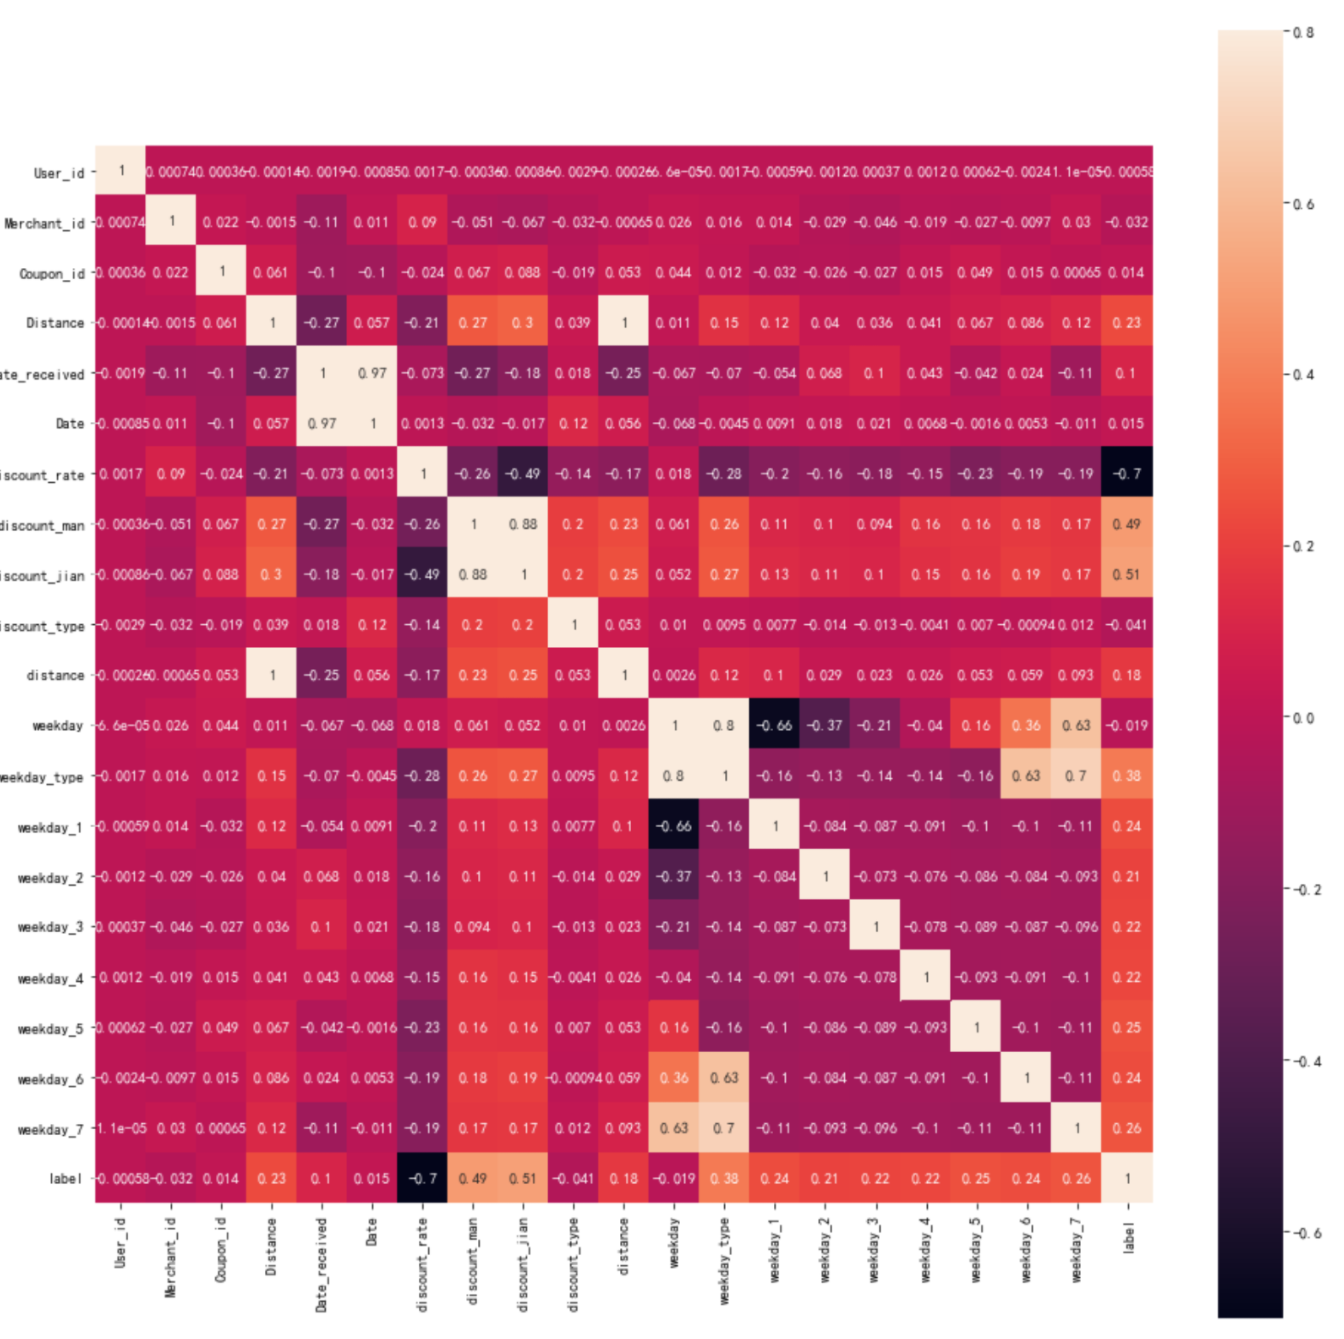
6. 可视化处理后的线下数据的相关系数图
corr = dfoff.corr()
print(corr)
plt.subplots(figsize=(16, 16))
sns.heatmap(corr, vmax=.8, square=True, annot=True)
7. 划分训练集和验证集
# 根据用户领取优惠券的日期划分为 训练集、验证集
print("-----data split------")
df = dfoff[dfoff['label'] != -1].copy()
train = df[(df['Date_received'] < 20160516)].copy()
valid = df[(df['Date_received'] >= 20160516) & (df['Date_received'] <= 20160615)].copy()
print("end")
8. 使用SGD随机梯度下降算法
# feature 使用线性模型SGD方法
model = SGDClassifier(#lambda:
    loss='log',
    penalty='elasticnet',
    fit_intercept=True,
    max_iter=100,
    shuffle=True,
    alpha = 0.01,
    l1_ratio = 0.01,
    n_jobs=-1,
    class_weight=None
)
model.fit(train[original_feature], train['label'])
# #### 预测以及结果评价
print(model.score(valid[original_feature], valid['label']))
print("---save model---")
with open('1_model.pkl', 'wb') as f:
    pickle.dump(model, f)
with open('1_model.pkl', 'rb') as f:
    model = pickle.load(f)

# 保存要提交的csv文件
y_test_pred = model.predict_proba(dftest[original_feature])
dftest1 = dftest[['User_id','Coupon_id','Date_received']].copy()
dftest1['label'] = y_test_pred[:,1]
dftest1.to_csv('submit1.csv', index=False, header=False)
dftest1.head()
9. 使用500个决策树模型集成,每次从数据集中随机采样100个训练实例
# 使用500个决策树模型集成,每次从数据集中随机采样100个训练实例
from sklearn.tree import DecisionTreeClassifier
from sklearn.ensemble import BaggingClassifier

original_feature = ['discount_rate','discount_type','discount_man', 'discount_jian','distance', 'weekday', 'weekday_type'] + weekdaycols
print("----train-----")
model = BaggingClassifier(
    DecisionTreeClassifier(),n_estimators=500,max_samples=100,bootstrap=True,n_jobs=-1
)
model.fit(train[original_feature], train['label'])

# #### 预测以及结果评价
print(model.score(valid[original_feature], valid['label']))

print("---save model---")
with open('1_model.pkl', 'wb') as f:
    pickle.dump(model, f)
with open('1_model.pkl', 'rb') as f:
    model = pickle.load(f)

# test prediction for submission
y_test_pred = model.predict_proba(dftest[original_feature])
dftest1 = dftest[['User_id','Coupon_id','Date_received']].copy()
dftest1['label'] = y_test_pred[:,1]
dftest1.to_csv('submit2.csv', index=False, header=False)
dftest1.head()
这种算法相比于上个SGD算法,在天池提交上上升了千分之二个点。
10. 以Boosting + 网格搜索为例
# 以Boosting方法
from sklearn.ensemble import GradientBoostingClassifier
model = GradientBoostingClassifier(
    max_depth=2,
    n_estimators=100, # 太小容易欠拟合,太大容易过拟合
    learning_rate=0.1)
model.fit(train[original_feature], train['label'])

# 使用网格搜索的方法调参,虽然线上的成绩没有太大的上升,但是过拟合的情况得到了很大的改善。
from sklearn.model_selection import GridSearchCV
param_test1 = {'n_estimators':range(20,81,10)}
gsearch1 = GridSearchCV(
    estimator = GradientBoostingClassifier(
        learning_rate=0.1, min_samples_split=300,
        min_samples_leaf=20,
        max_depth=8,
        max_features='sqrt',
        subsample=0.8,
        random_state=10),
        param_grid = param_test1, scoring='roc_auc',cv=5,n_jobs=-1)
gsearch1.fit(train[original_feature], train['label'])

# gsearch1.grid_scores_, gsearch1.best_params_, gsearch1.best_score_
print(gsearch1.score(valid[original_feature], valid['label']))
print("---save model---")
with open('1_model.pkl', 'wb') as f:
    pickle.dump(gsearch1, f)
with open('1_model.pkl', 'rb') as f:
    model = pickle.load(f)

# test prediction for submission
y_test_pred = gsearch1.predict_proba(dftest[original_feature])
dftest1 = dftest[['User_id','Coupon_id','Date_received']].copy()
dftest1['label'] = y_test_pred[:,1]
dftest1.to_csv('submit6.csv', index=False, header=False)
dftest1.head()
4. 总结
本文以天池新人赛o2o优惠券使用预测赛题为题,在对数据探索和分析后,本文主要对Discount_rate、Distance、Data_received、Date特征进行处理,将其转换成模型训练能够使用的数值型数据,并在此基础上提取出了新的特征discount_rate、discount_man、discount_jian、couponbydate、buybydate和weekday-type这些特征,同时我们将weekday-type特征进行one-hot编码,最后我们以是否领取优惠券、是否在15天内进行消费提取标签y的特征为-1和1。
根据实验结果来看,我们在进行特征提取后,从一开始的SGD模型、Bagging模型所出现的过拟合情况,到Boosting模型+网格搜索极大的缓解了模型的过拟合情况,说明较为适合的还是Boosting模型,它能够很好的利用分类器的残差来作为新的训练集,进而实现更优的模型。(当然我觉得SGD一定也是可以的,不过得调整一些参数,本次实验中对于SGD的使用太简陋了)
同时,由于处理时间较为仓促,我们的模型还有很多能够提高的地方。首先是特征处理方面,我们还可以使用聚类或者主成分分析的方法判断各个特征的相关性,将相关性较大的特征进行降维,同时我们还可以深层次的去探索特征关系,进行特征工程的建立。比如我们可以结合用户线上、线下的相关特征以及用户-商家的交互特征等。除此之外,我们在训练集上label的选择也是有待完善的,我们只是单独考虑了没有优惠券的为-1,15天购买的为1,并没有考虑到没有又回去但是15天内购买的情况以及其它复杂情况。
进一步的,在选择特征的时候,根据天池某位大佬的思路,我们可以考虑使用过拟合训练的方法,使用100%数据集训练,使用100%数据集测试,观察auc,当auc距离1越远的时候,说明特征不够多,继续探索更多的特征,直到这里的auc接近1,在过拟合训练完成后输出特征重要性,删除特征重要性低的特征,不断过拟合训练,保持auc基本不变,最后得到是尽可能少的特征数量但是又能够表示这批数据的特性。
对于数据集的划分,此次实验中也做的很简洁,只是单纯的根据时间顺序划分为两个数据集,而这样划分数据集的劣势很大(但是由于时间仓促,这样最简单)。如果这段时间内外界环境有较大波动则很可能对数据集样本的正负性产生极大的影响。后期会尝试在一开始的数据集划分时就采用交叉验证,而不仅仅是在模型训练时采用交叉验证,这样可能充分利用数据集的所有讯息,提高模型的泛化能力。
在模型建立方面后期也应该更多的去尝试Xgboost集成模型。集成模型的“三个臭皮匠顶个诸葛亮”的理念是十分成功的,很多上分成功的大佬也是用到了Xgboost模型的方法。同时我将进一步使用网格搜索的方法,每次网格搜索都将根据上一次搜索出的结果来缩小范围,最后确定最优的参数。
Anyway,整篇文章的定位是小白入门级,大致了解一下数据处理与清洗、特征工程啊、模型训练以及非常NB的集成学习。如果你想在这个比赛里刷更高的分数,建议去天池论坛里找一下其它大佬分享的文章~
数据集、代码我把它放到了网盘里,大家有需要可以自提:链接:https://pan.baidu.com/s/1CZB8fErDygtdFc5TWvIk9w 提取码:er1b

 浙公网安备 33010602011771号