
Grafana+Prometheus打造全方位立体监控系统
Grafana+Prometheus打造全方位立体监控系统
概述:
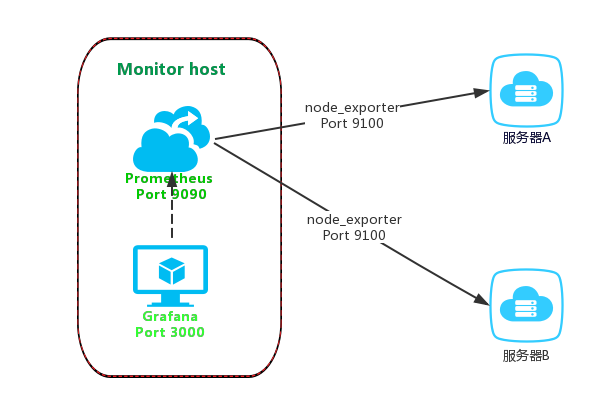
Prometheus是一个开源的服务监控系统,它通过HTTP协议从远程的机器收集数据并存储在本地的时序数据库上
Prometheus通过安装在远程机器上的exporter来收集监控数据,后面我们将使用到node_exporter收集系统数据。
Grafana 是一个开箱即用的可视化工具,具有功能齐全的度量仪表盘和图形编辑器,有灵活丰富的图形化选项,可以混合多种风格,支持多个数据源特点。
架构图:
安装方法:前提具备 centos7的环境
收集数据 node_Exporter:https://www.cnblogs.com/blog-123/category/1905865.html
创建安装目录 mkdir /opt/node_exporter-0.18.1/

# 官方下载
wget https://github.com/prometheus/node_exporter/releases/download/v0.18.1/node_exporter-0.18.1.linux-amd64.tar.gz

# 解压
tar -zxvf node_exporter-0.15.0.linux-amd64.tar.gz


# 或者百度网盘安装 我为你下载好的包
链接:https://pan.baidu.com/s/1q34U3S1gf2foe56mbV394Q
提取码:mhag

# 解压
tar -zxvf node_exporter-0.18.1.linux-amd64.tar.gz

# 配置安装目录(也可忽略)
[root@es01 prometheus]# cd /opt/node_exporter-0.18.1/

[root@es01 node_exporter-0.18.1]# mkdir config bin logs data

[root@es01 node_exporter-0.18.1]# mv node_exporter bin/

# 或者直接后台启动 ./node_exporter & (启动之后可以看见端口:浏览器访问ip:9100 )
安装:prometheus https://www.cnblogs.com/blog-123/category/1905863.html
创建安装目录:mkdir /opt/prometheus

# 官方下载 https://prometheus.io/download
wget https://github.com/prometheus/prometheus/releases/download/v2.0.0-rc.3/prometheus-2.0.0-rc.3.linux-amd64.tar.gz

# 可自定义解压目录
tar -xvf prometheus-2.0.0-rc.3.linux-amd64.tar.gz

# 切换目录
cd /opt/prometheus/prometheus-2.0.0-rc.3.linux-amd64
修改配置文件底部监控本机
vim prometheus.yml
# 如下的配置

scrape_configs:
  - job_name: 'prometheus'
    static_configs:
    # 监控本地及端口
    - targets: ['xiangsikai:9090']

注:Prometheus从目标机上通过http方式拉取采样点数据, 它也可以拉取自身服务数据并监控自身的健康状况。

注:当然Prometheus服务拉取自身服务采样数据,并没有多大的用处,但是它是一个好的DEMO。

global:
  # 默认情况下,每15s拉取一次目标采样点数据。
  scrape_interval:     15s
  # 我们可以附加一些指定标签到采样点度量标签列表中, 用于和第三方系统进行通信, 包括:federation, remote storage, Alertmanager
  external_labels:
    # 下面就是拉取自身服务采样点数据配置
    monitor: 'codelab-monitor'
scrape_configs:
  # job名称会增加到拉取到的所有采样点上,同时还有一个instance目标服务的host:port标签也会增加到采样点上
  - job_name: 'prometheus'
    # 覆盖global的采样点,拉取时间间隔5s
    scrape_interval: 5s
    static_configs:
      - targets: ['localhost:9090']
# 后台启动服务
./prometheus --config.file=prometheus.yml &

# 指定配置文件
--config.file="prometheus.yml"
# 指定监听地址端口
--web.listen-address="0.0.0.0:9090"
# 最大连接数
--web.max-connections=512
# tsdb数据存储的目录,默认当前data/
--storage.tsdb.path="data/"
# premetheus 存储数据的时间,默认保存15天
--storage.tsdb.retention=15d
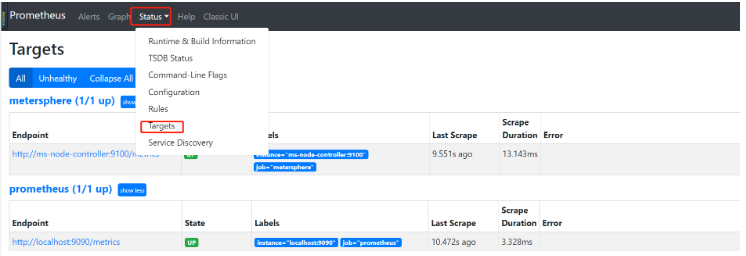
测试访问: http://localhost:9090
将Prometheus配置为系统服务
cd /opt/systemd/system
vim prometheus.service
  [Unit]
  Description=https://prometheus.io

  [Service]
  Restart=on-failure
  ExecStart=/usr/local/prometheus/prometheus --config.file=/usr/local/prometheus/prometheus.yml

  [Install]
  WantedBy=multi-user.target
生效系统system文件**
systemctl daemon-reload
启动服务**
systemctl stop prometheus.service
systemctl start prometheus.service
安装 Grafana
## 安装依赖grafana运行需要go环境
yum install  go -y
## 安装 grafana
yum install https://s3-us-west-2.amazonaws.com/grafana-releases/release/grafana-4.6.1-1.x86_64.rpm -y
安装包信息:
二进制文件: /usr/sbin/grafana-server
init.d 脚本: /etc/init.d/grafana-server
环境变量文件: /etc/sysconfig/grafana-server
配置文件: /etc/grafana/grafana.ini
启动项: grafana-server.service
日志文件:/var/log/grafana/grafana.log
默认配置的sqlite3数据库:/var/lib/grafana/grafana.db
启动命令
service grafana-server start
# 启动grafana,并设置开机启动
systemctl daemon-reload
systemctl start grafana-server
systemctl status grafana-server
systemctl enable grafana-server.service
服务器端图像(PNG)渲染是可选的功能,但在共享可视化时非常有用,例如在警报通知中。
如果图像缺少文本,请确保已安装字体包。
yum install fontconfig
yum install freetype*
yum install urw-fonts
访问Grafana通过Nginx代理,默认登录用户名密码:admin/admin,需及时修改。
server {
        listen       80;
        server_name  grafana.52itstyle.com;

        charset utf-8;

        location / {
            default_type text/html;
            proxy_pass http://127.0.0.1:3000;
        }

}
编辑配置文件/etc/grafana/grafana.ini ,修改dashboards.json段落下两个参数的值:
[dashboards.json]
enabled = true
path = /var/lib/grafana/dashboards
安装仪表盘JSON模版:
git clone https://github.com/percona/grafana-dashboards.git
cp -r grafana-dashboards/dashboards /var/lib/grafana/
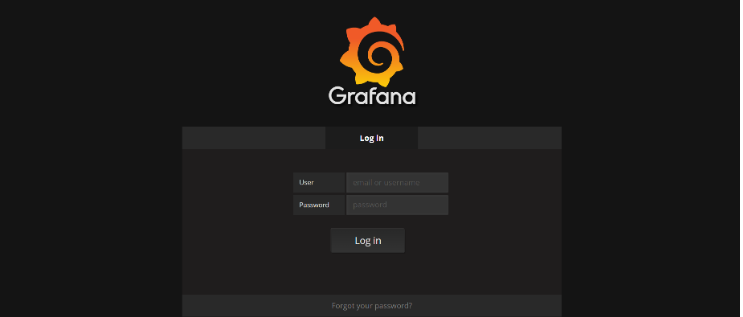
最后,通过service grafana-server start命令启动服务,访问地址:ip:3000
初始账号密码 :admin admin
然后在Data Sources选项中添加数据源:
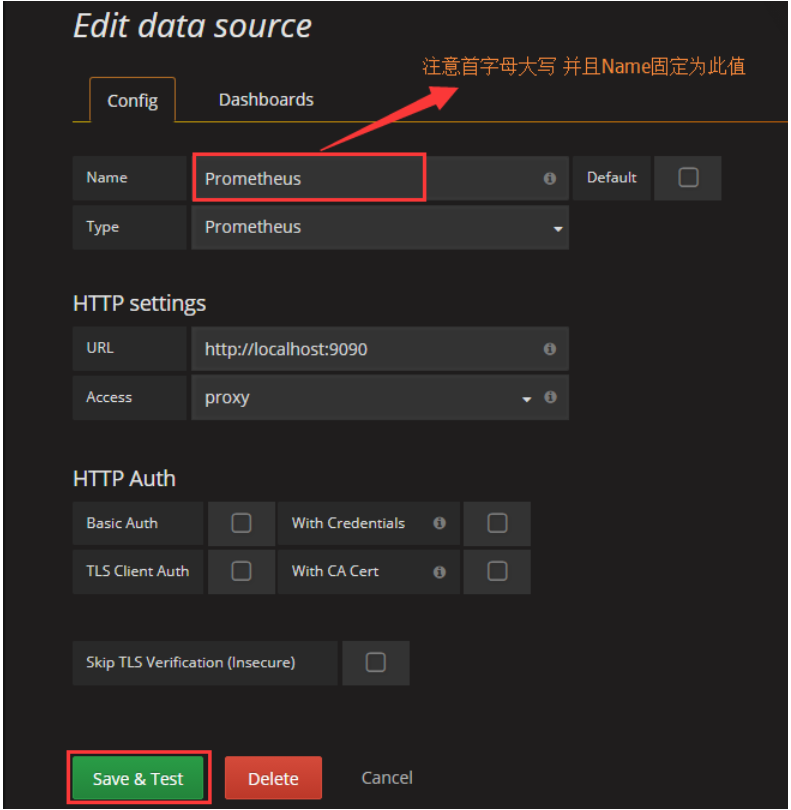
自此,就关联完毕了
嗨~今天你暴躁了吗?
~~~关注我,更多精彩内容带给你,关注私聊带走绝密知识~~~

 浙公网安备 33010602011771号