Echarts服务端渲染以及客户端懒加载实现方案
为了提升首屏的加载速度,考虑先用服务端渲染快速输出首屏图表,然后等待 echarts.js 加载完后,通过注水操作(Hydration),重新在客户端渲染同样的图表
tips:在客户端渲染的时候,应开启 tooltip: { show: true } 之类的交互组件,并且用 animation: 0 关闭初始动画(初始动画应由服务端渲染结果的 SVG 动画完成)
服务端渲染方案,以Nuxt为例:
// 服务端代码
import * as echarts from 'echarts';
// 注册地图
import chinaJson from '~/assets/JSON/cn.json';
export default defineEventHandler(async (event) => {
  if (process.server) {
    try{
      // 注册地图
    echarts.registerMap("china", chinaJson);
    const option = {
      animation:false,
      // 地理坐标系组件用于地图的绘制
      geo: {
        // 使用 registerMap 注册的地图名称。
        map: "china",
        label:{
          // show:true, // 地图文字是否显示
          color: '#333', // 地图文字颜色
        },
        itemStyle:{
          areaColor: '#ffffff', // 地图背景色
          borderColor:'#fd6b6c',// 地图边框颜色
          borderWidth: 0.6 // 地图边框线宽
        }
      },
      series: [
        {
          type: "map",
          map: "china",
          geoIndex: 0,
        },
      ...其他配置项
      ],
      };
        // 在 SSR 模式下第一个参数不需要再传入 DOM 对象
    let chart = echarts.init(null, null, {
    renderer: 'svg', // 必须使用 SVG 模式
    ssr: true, // 开启 SSR
    width: 300, // 需要指明高和宽
    height:400
    });
      // 像正常使用一样 setOption
    chart.setOption(option,true);
    // 输出字符串
    const svgStr = chart.renderToSVGString();

    // 如果不再需要图表,调用 dispose 以释放内存
    chart.dispose();
    chart = null;

    event.node.res.writeHead(200, { 'Content-Type': 'application/xml' });
    //通过svg字符串形式发送给客户端
    event.node.res.write(svgStr);
    event.node.res.end();
  }catch(error){
    console.log(error);
  }
  }
})
客户端接收:
const { data } = await useFetch('/api/hello');
if (process.client) {
    document.getElementById('svg').innerHTML = data.value;
}
懒加载方案:
//引入组件
import * as echarts from 'echarts';
import chinaJson from '@/assets/JSON/china.json';
//注册地图
echarts.registerMap("china", chinaJson);
//创建图表引用对象
const chartsRef = ref(null);
//创建加载标识
const isLoading = ref(false);
//创建引用来存储图表实例
const chartInstance = ref(null);
//创建配置项
const option = {
 animation:0,
 tooltip: {
    show:true,
  },
...其他配置项
}


//到达可视区域函数
function isVisible() {
    const containerHeight = document.getElementById('container').clientHeight;
    const elementHeight = document.getElementById('svg').getBoundingClientRect();
    if (elementHeight.y < containerHeight) {
        isLoading.value = true;
    }
}

//加载实例化图表函数
function renderLoad() {
    isVisible();
    if (isLoading.value && !chartInstance.value) { // Check if the chart is already initialized
        chartInstance.value = echarts.init(chartsRef.value);
        chartInstance.value.setOption(option);
        isLoading.value = false;
    }
}

//通过scroll到可视区域实例化图标
if (import.meta.client) {
    const container = document.getElementById('container');
    container.addEventListener('scroll', throttle(renderLoad), false);
}

onMounted(() => {
    renderLoad(); // 初始化渲染
});

//销毁避免内存泄漏
onBeforeUnmount(() => {
    if (chartInstance.value) {
        echarts.dispose(chartInstance.value);
        chartInstance.value = null;
    }
    const container = document.getElementById('container');
    container.removeEventListener('scroll', throttle(renderLoad));
});
懒加载方案有很多,交叉观察器等,但是兼容性没有scroll好
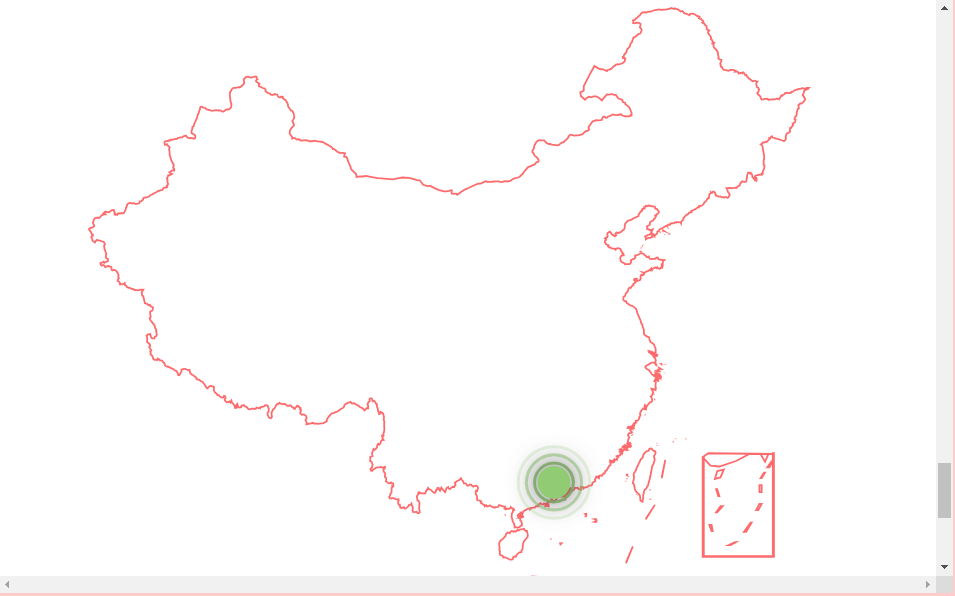
客户端渲染csr:
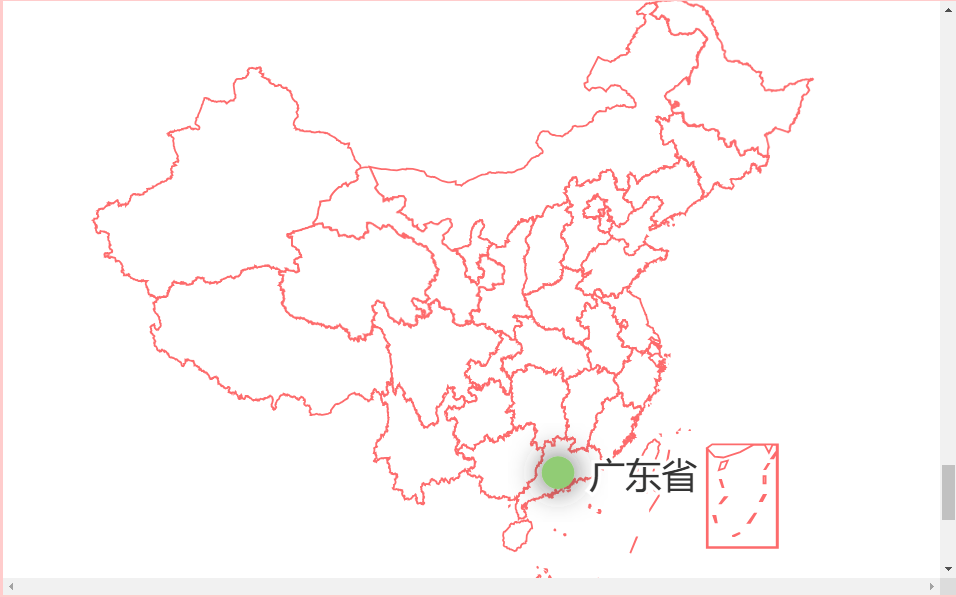
服务端渲染ssr:
可以通过阿里云数据可视化平台获取最新的geoJson数据

 浙公网安备 33010602011771号