
手把手带你部署Prometheus+Grafana+Mysql监控系统
环境准备:
Prometheus 192.168.60.100
被控节点客户端:192.168.60.101
Grafana: 192.168.60.102
【部署Prometheus】
# tar xvf prometheus-2.5.0.linux-amd64.tar.gz -C /usr/local/
# mv /usr/local/prometheus-2.5.0.linux-amd64/ /usr/local/prometheus
#vim /lib/systemd/system/prometheus.service #注册prometheus启动服务
[Unit]
Description=Prometheus
Documentation=https://prometheus.io/
After=network.target

[Service]
Type=simple
User=root
ExecStart=/usr/local/prometheus/prometheus --config.file=/usr/local/prometheus/prometheus.yml --web.enable-lifecycle
ExecStop=/usr/bin/killall -9 prometheus


[Install]
WantedBy=multi-user.target
#systemctl daemon-reload
#systemctl start prometheus
#systemctk enable prometheus
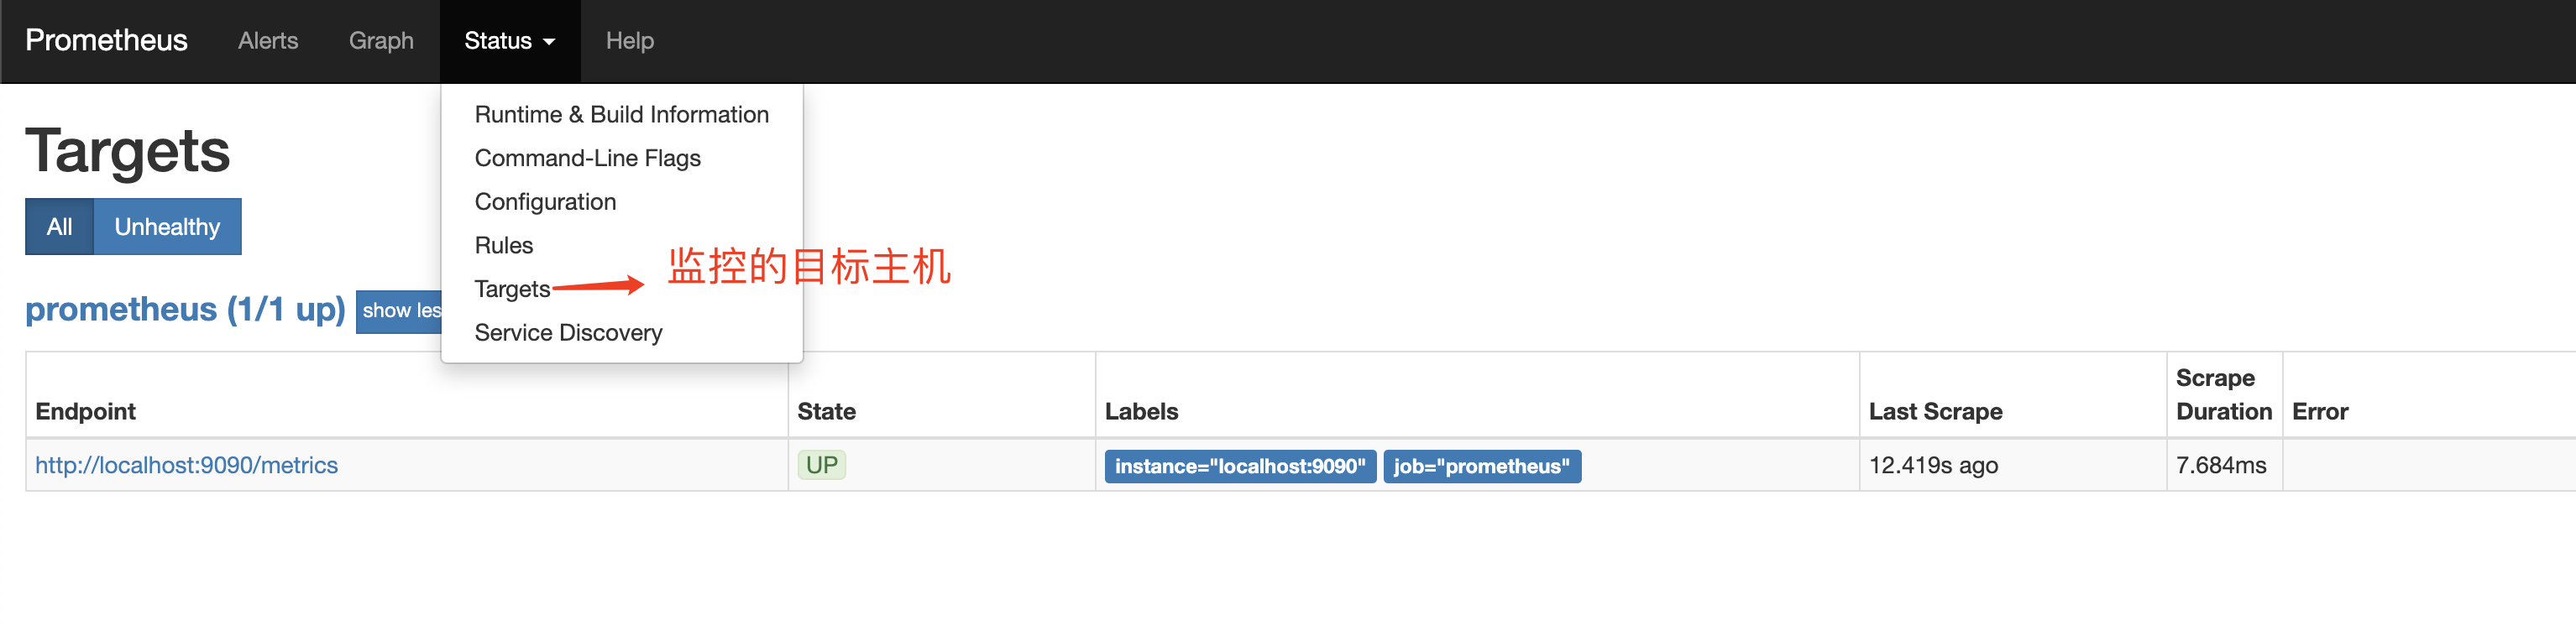
#访问192.168.60.100:9090即可访问prometheus页面
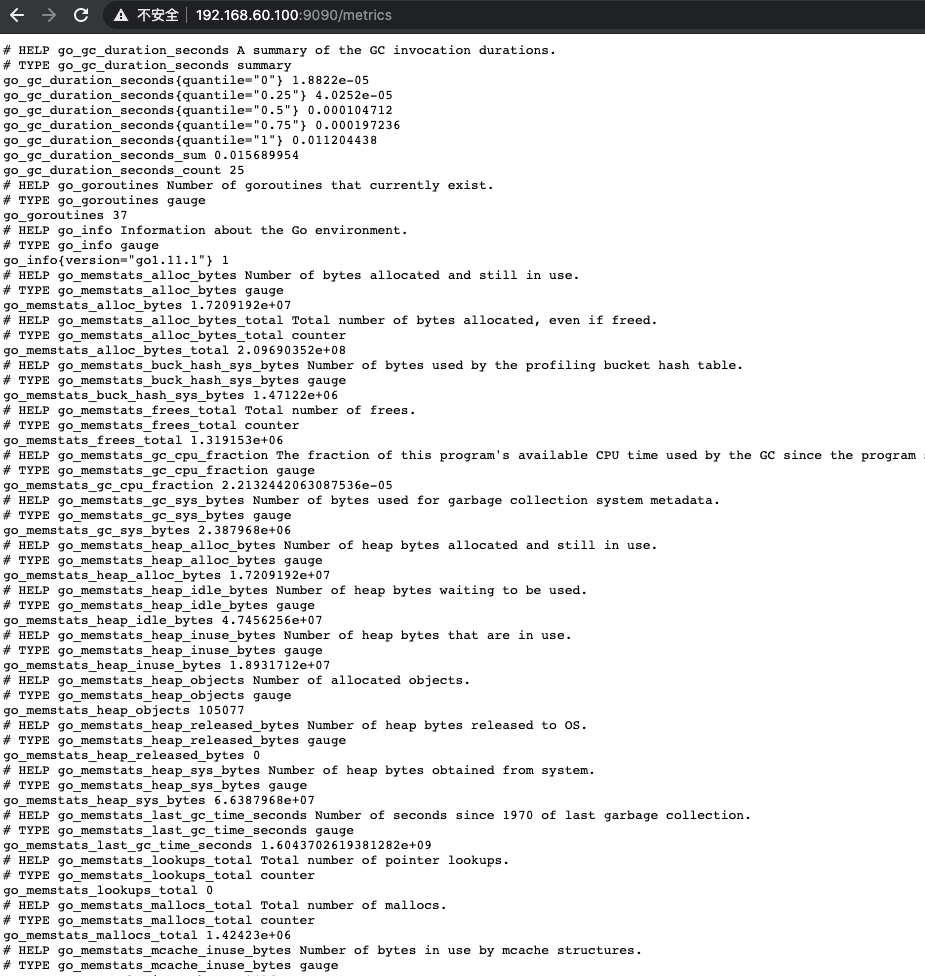
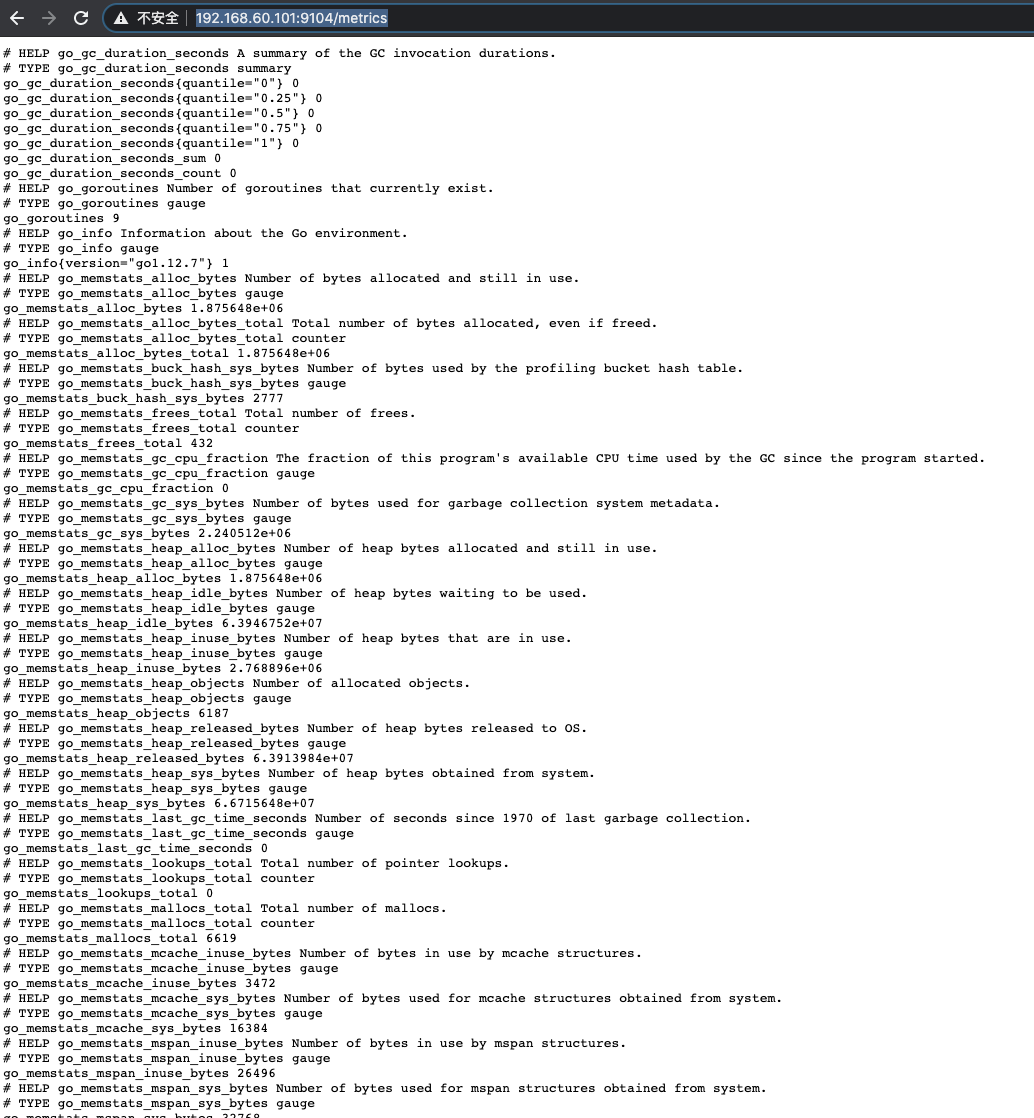
#通过http://192.168.60.100:9090/metrics可以查看到监控的数据
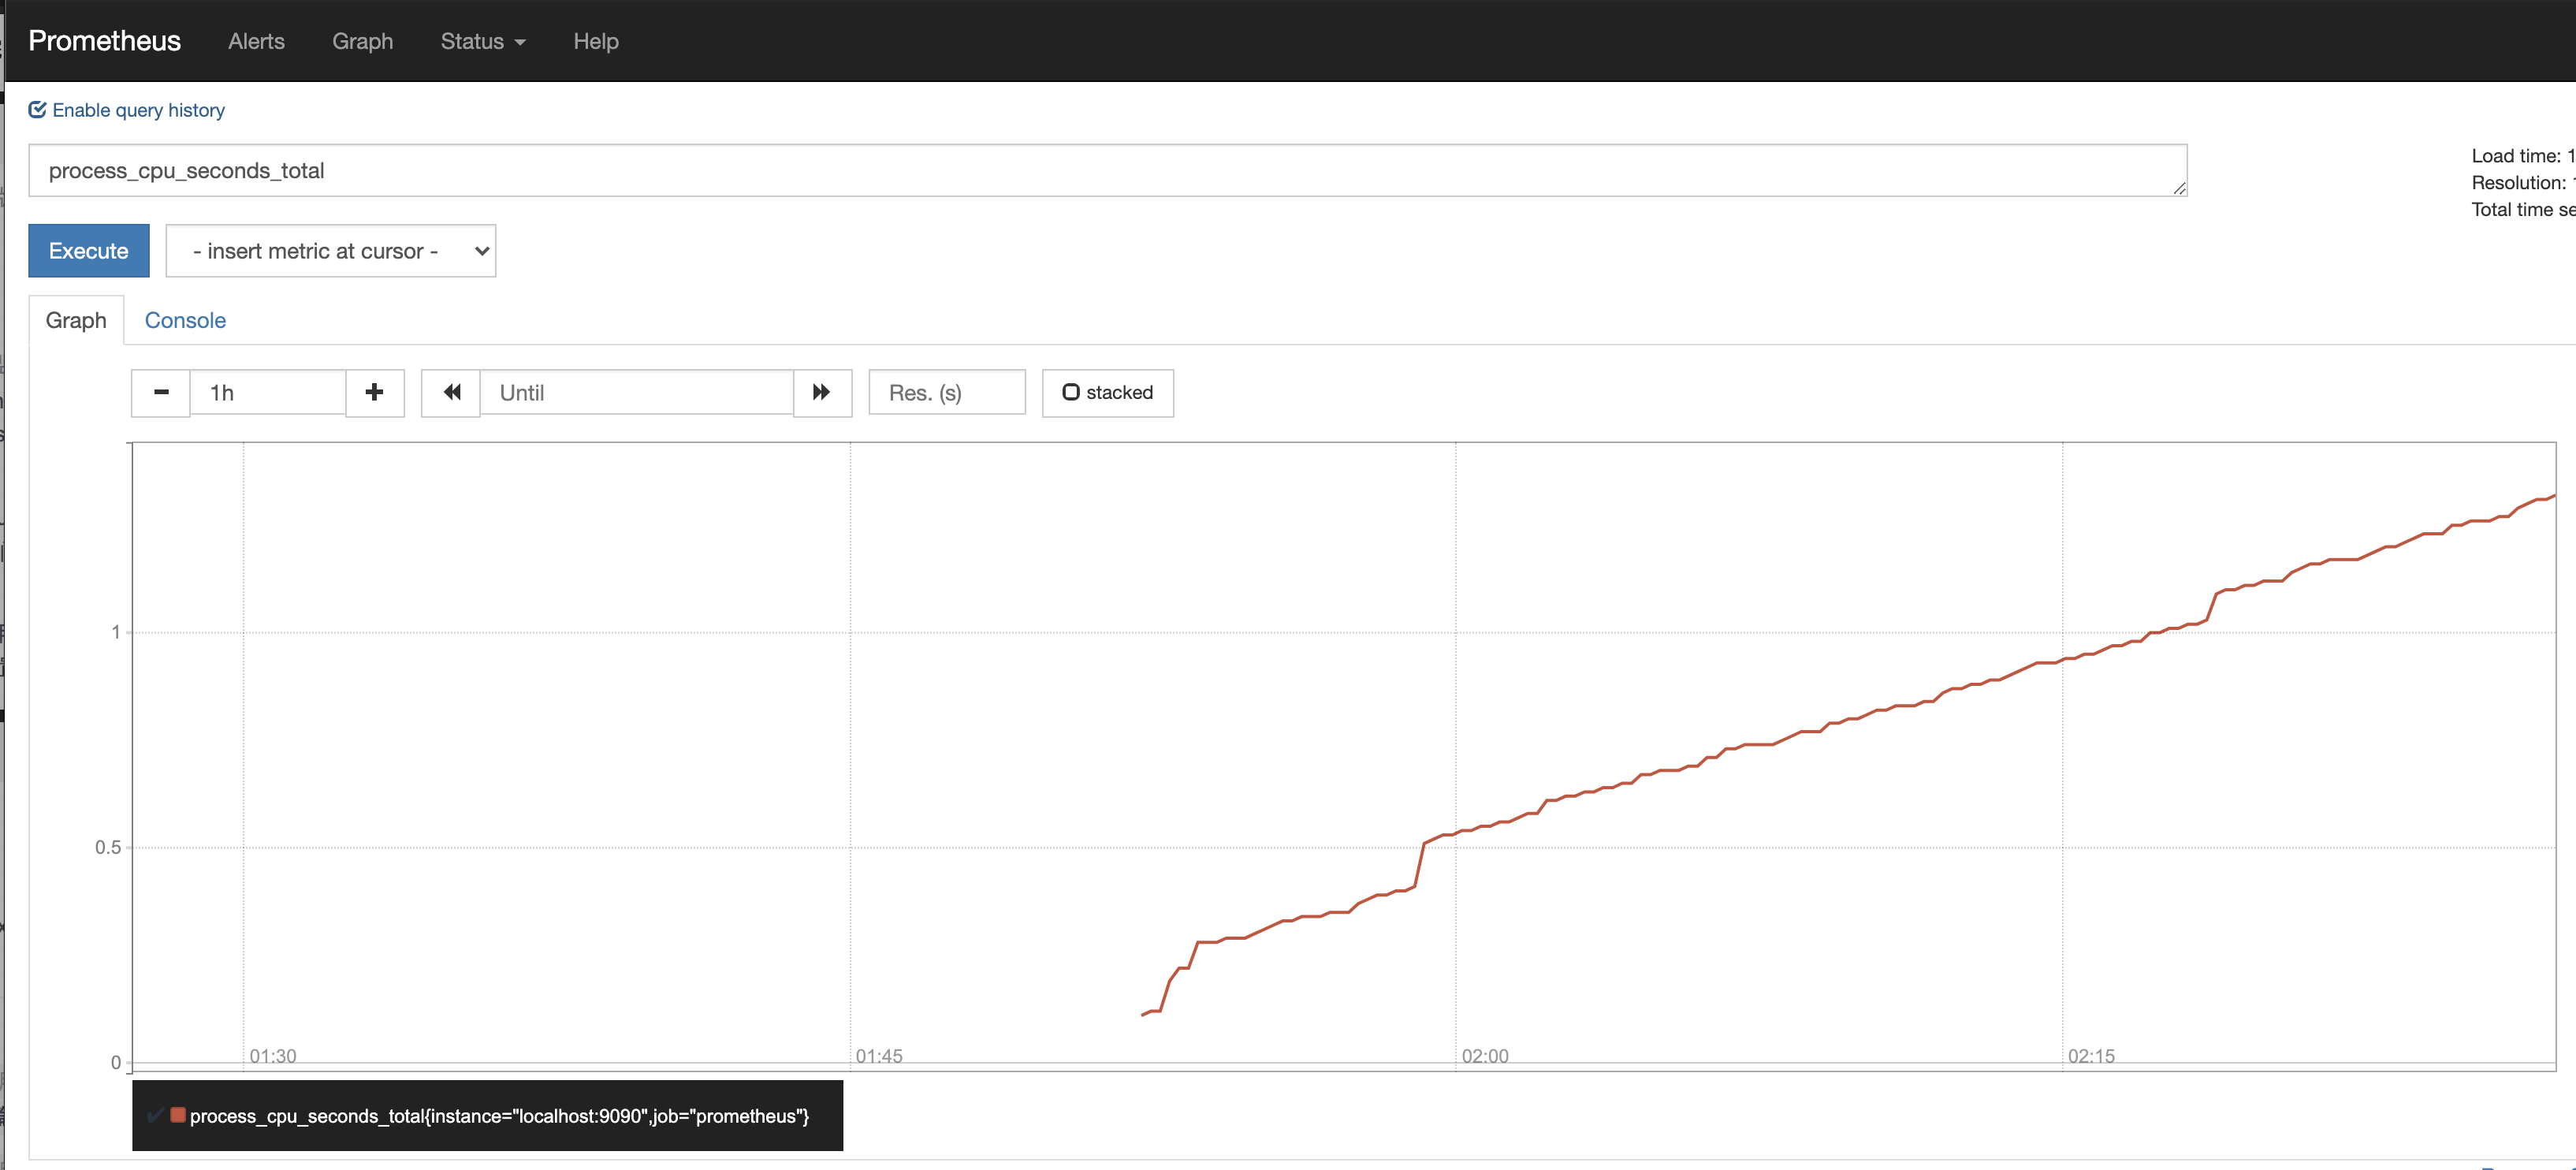
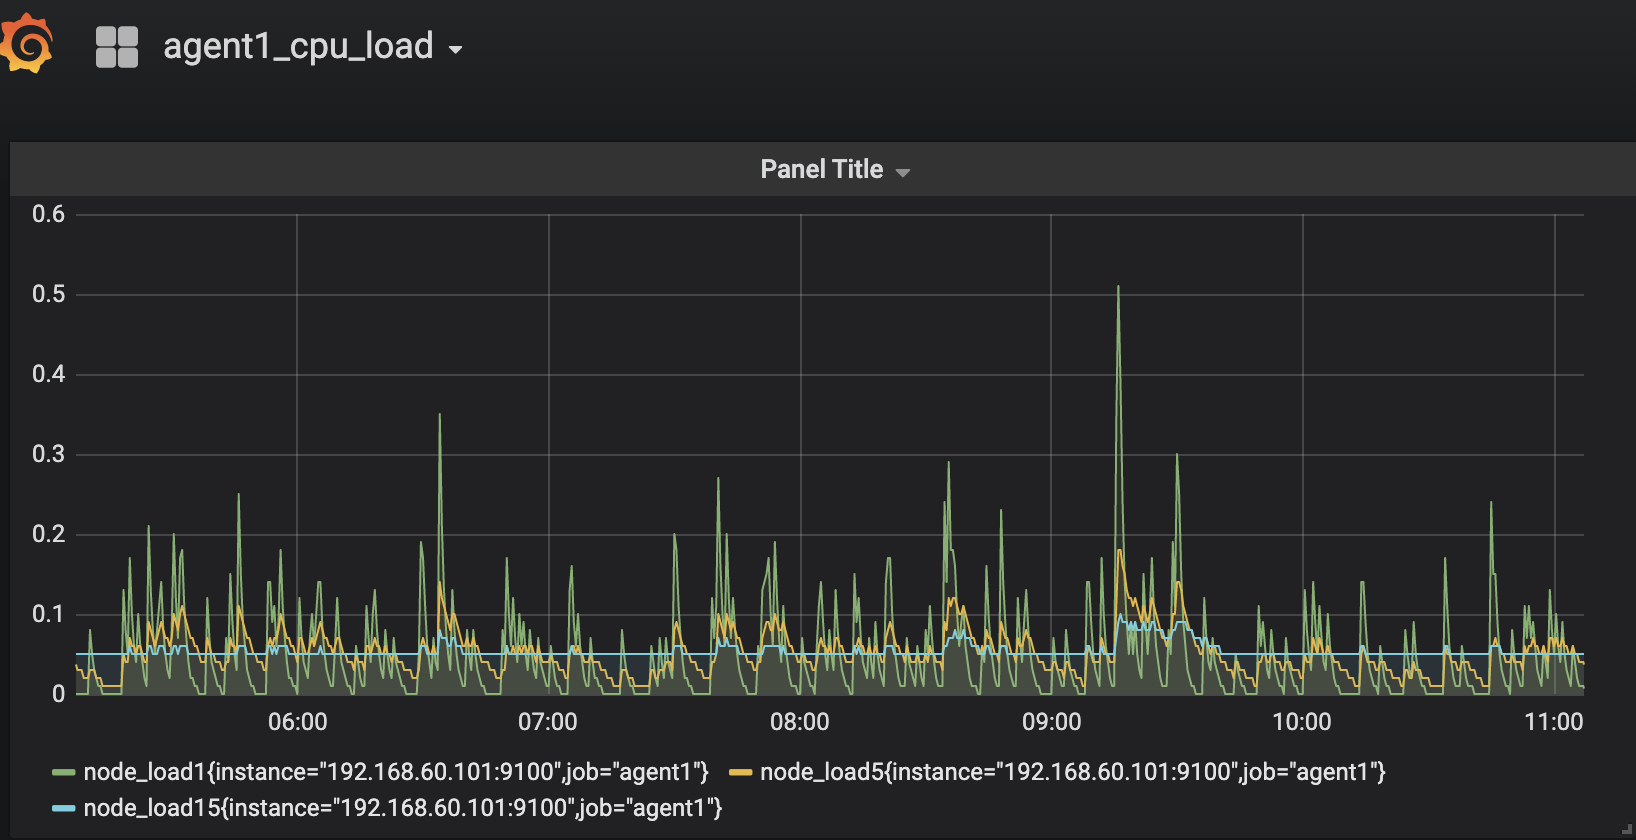
#在Prometheus界面可以通过关键词查询监控项,点击Graph图标,然后点击Execute即可看到所查询的监控项所汇成的图标;
【部署prometheus的被控节点】
# tar xvf node_exporter-0.16.0.linux-amd64.tar.gz
## mv /usr/local/node_exporter-0.16.0.linux-amd64/ /usr/local/node_exporter
# vim /usr/lib/systemd/system/node_exporter.service
[Service]
User=prometheus
Group=prometheus
ExecStart=/usr/local/node_exporter/node_exporter

[Install]
WantedBy=multi-user.target

[Unit]
Description=node_exporter
After=network.target
# systemctl start node_exporter
#systemctl enable node_exporter
回到Prometheus服务节点指定被控agent的IP地址信息
# vim /usr/local/prometheus/prometheus.yml
 - job_name: "agent1"
    static_configs:
    - targets: ['192.168.60.101:9100']
#systemctl restart prometheus
访问http://168.63.136.238:9090即可看到监控状态信息

【监控mysql数据库】
在192.168.60.101被控节点上部署mariadb数据库,并安装监控数据库的prometheus插件,以便后续能正常监控mysql数据库性能指标
# wget https://github.com/prometheus/mysqld_exporter/releases/download/v0.12.1/mysqld_exporter-0.12.1.linux-amd64.tar.gz
# tar xvf mysqld_exporter-0.12.1.linux-amd64.tar.gz
# mv /usr/local/mysqld_exporter-0.12.1.linux-amd64/ /usr/local/mysqld_exporter
MariaDB [(none)]> grant select,replication client,process on *.* to 'mysql_monitor'@'localhost' identified by '123.com';
MariaDB [(none)]> flush privileges;
#vim cat /usr/local/mysqld_exporter/.my.cnf
[client]
user=mysql_monitor
password=123.com
#vim /usr/lib/systemd/system/mysqld_exporter.service
[Unit]
Description=mysqld_exporter
After=network.target
[Service]
Type=simple
User=mysql
Environment=DATA_SOURCE_NAME=mysql_montor:123.com(localhost:3306)/
ExecStart=/usr/local/mysqld_exporter/mysqld_exporter --web.listen-address=0.0.0.0:9104
 --config.my-cnf /etc/my.cnf \
# --collect.slave_status \
# --collect.slave_hosts \
  --log.level=error \
# --collect.info_schema.processlist \
# --collect.info_schema.innodb_metrics \
# --collect.info_schema.innodb_tablespaces \
# --collect.info_schema.innodb_cmp \
# --collect.info_schema.innodb_cmpmem
Restart=on-failure
[Install]
WantedBy=multi-user.targe
启动exporter插件
#systemctl daemon-reload
#systemctl enable mysqld_exporter.service
#systemctl start mysqld_exporter.service
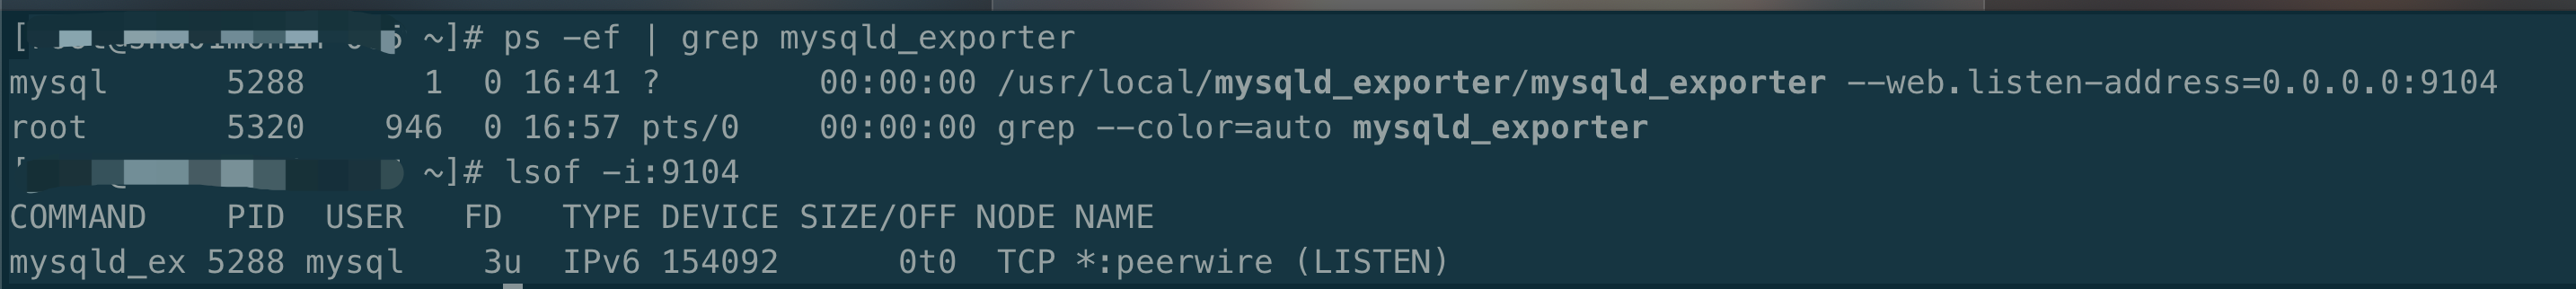
测试:http://192.168.60.101:9104/metrics #访问被控节点的9104端口,即可查看监控信息
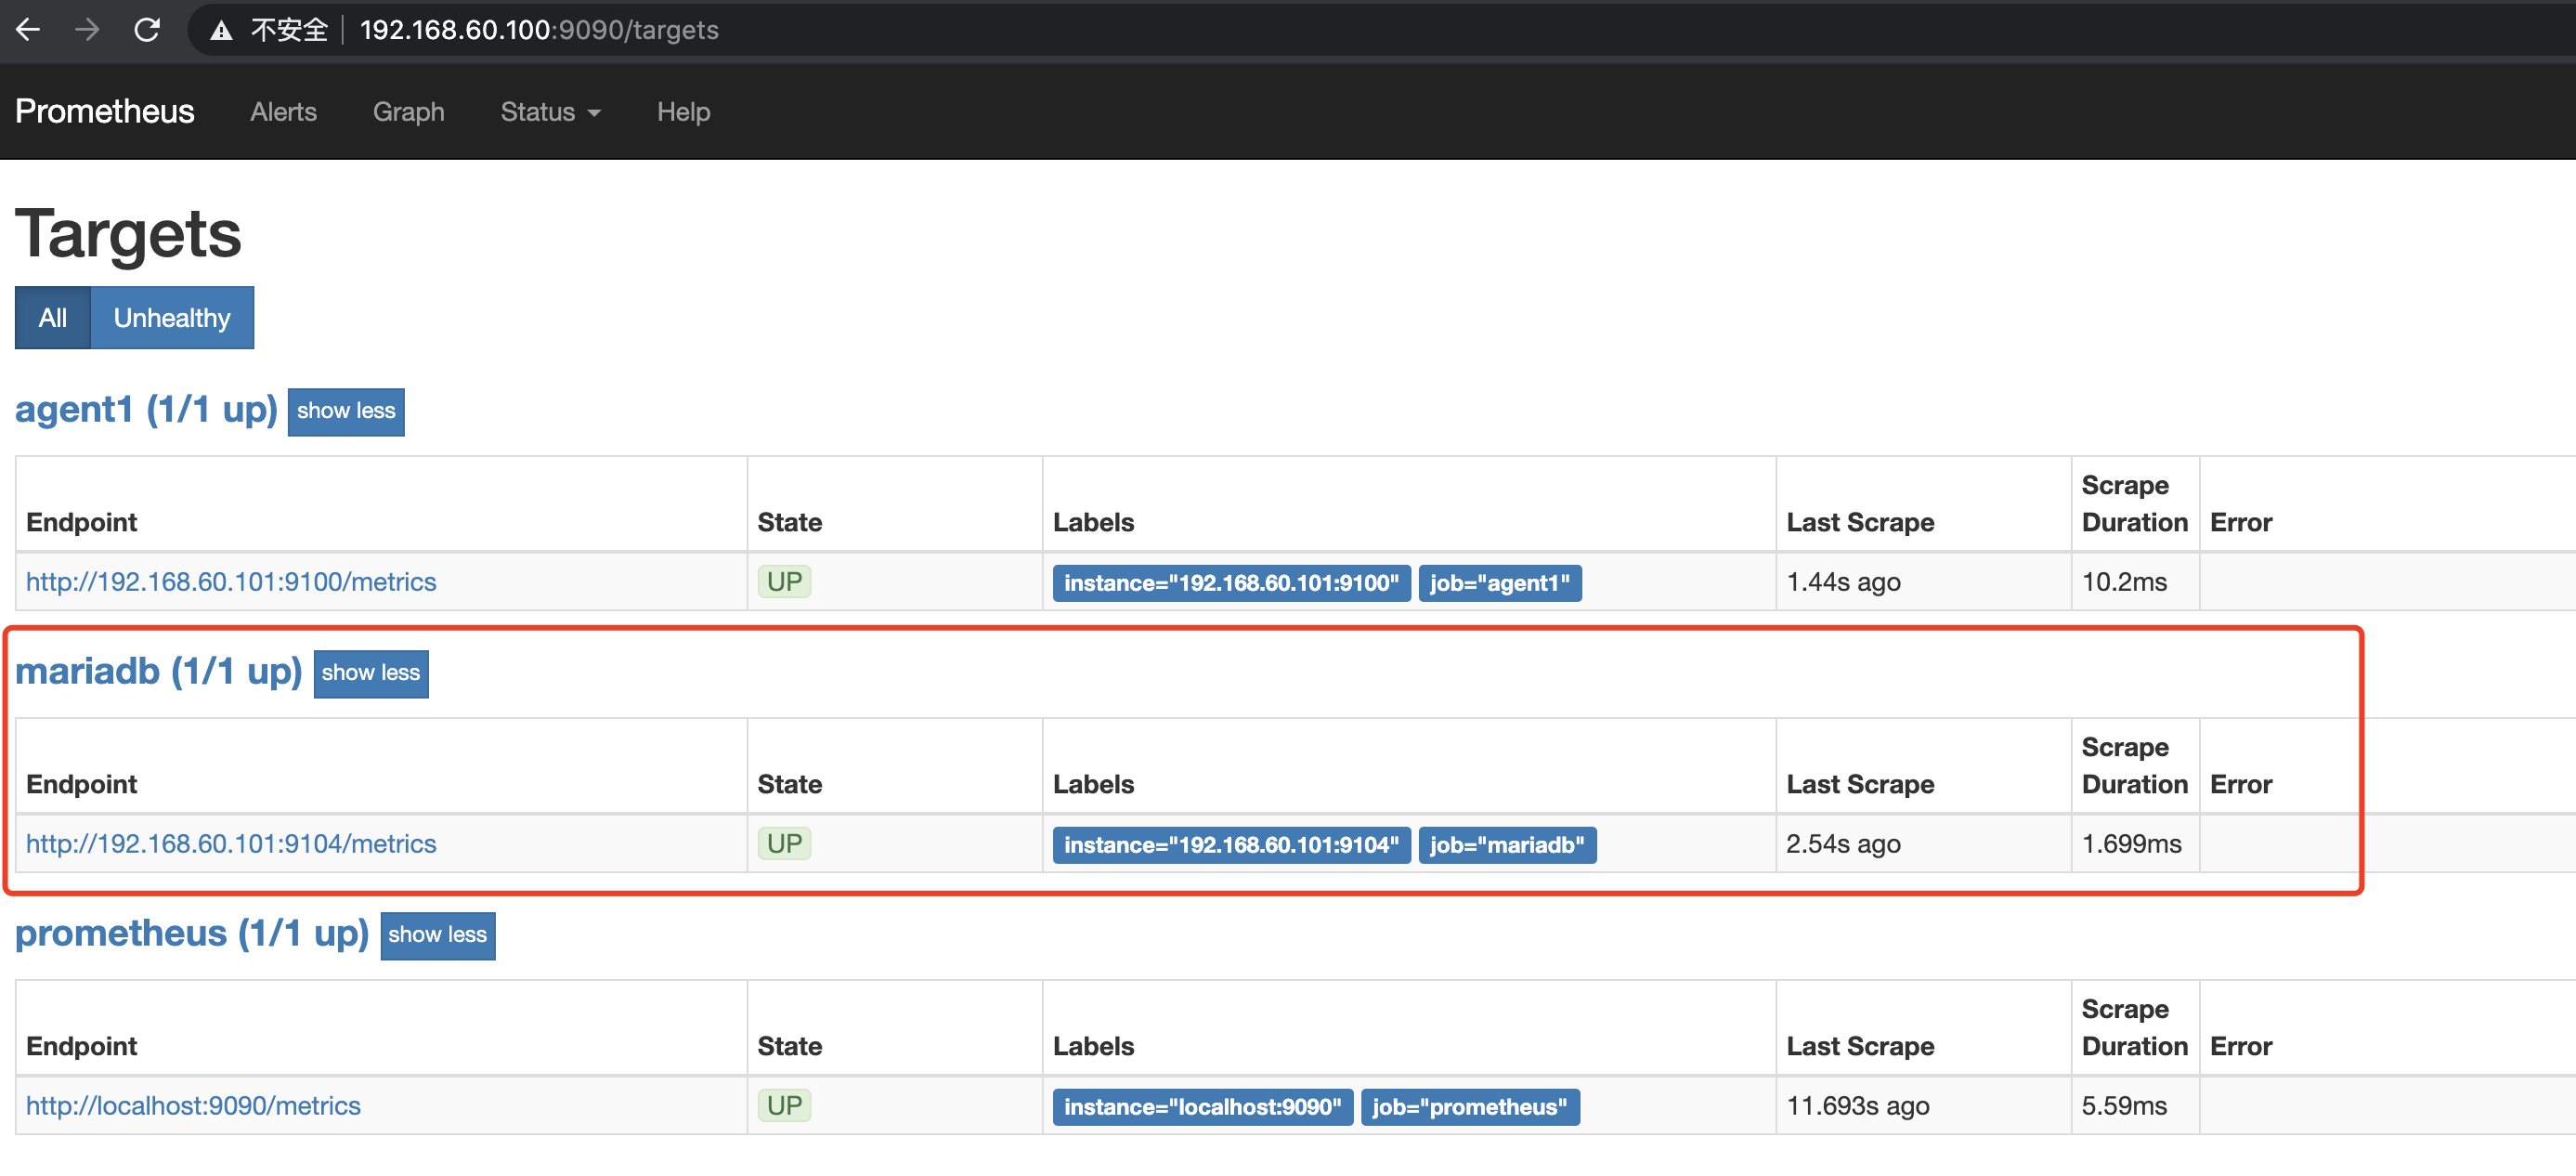
回到promethues服务节点,在配置文件中添加被控节点的mariadb配置段
# vim /usr/local/prometheus/prometheus.yml
 - job_name: 'mariadb'
    static_configs:
    - targets: ['192.168.60.101:9104']

【部署Grafana监控】
192.168.60.102节点部署Granfana
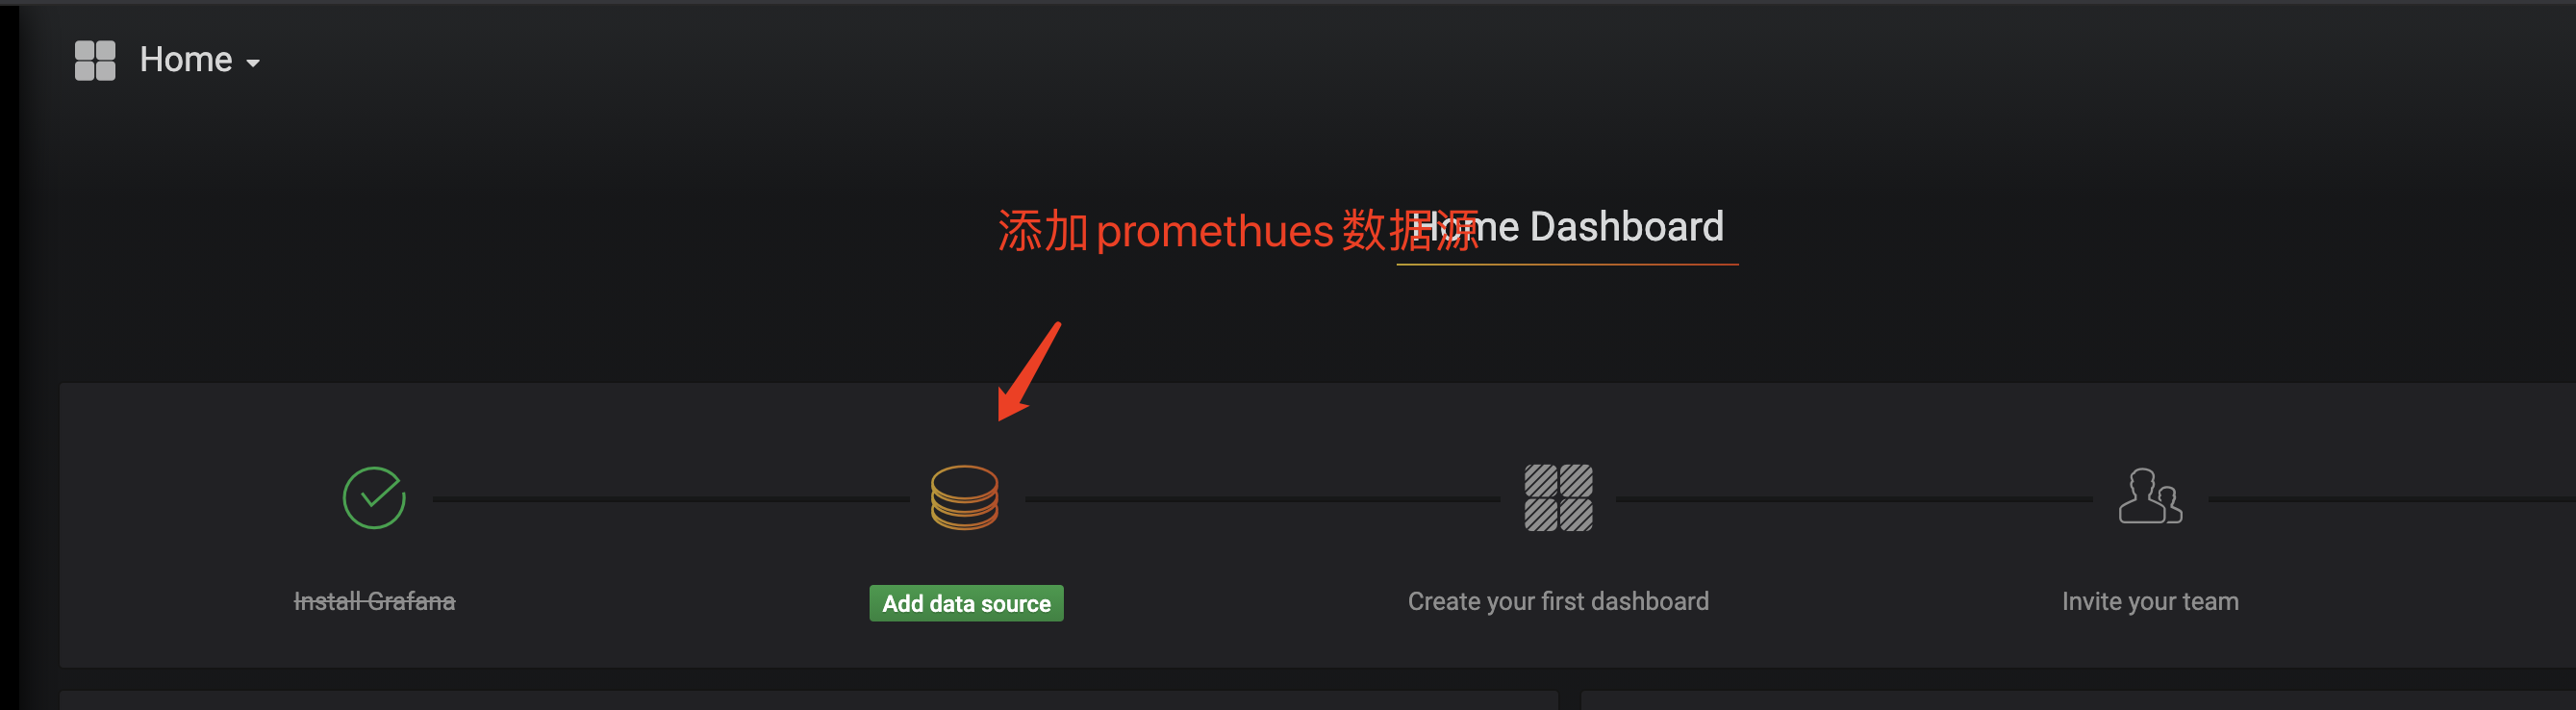
使用Grafana连接Promethues监控
# rpm -ivh grafana-5.3.4-1.x86_64.rpm
# systemctl enable grafana-server
# systemctl start grafana-serve

【Grafana展示Mysql的数据】
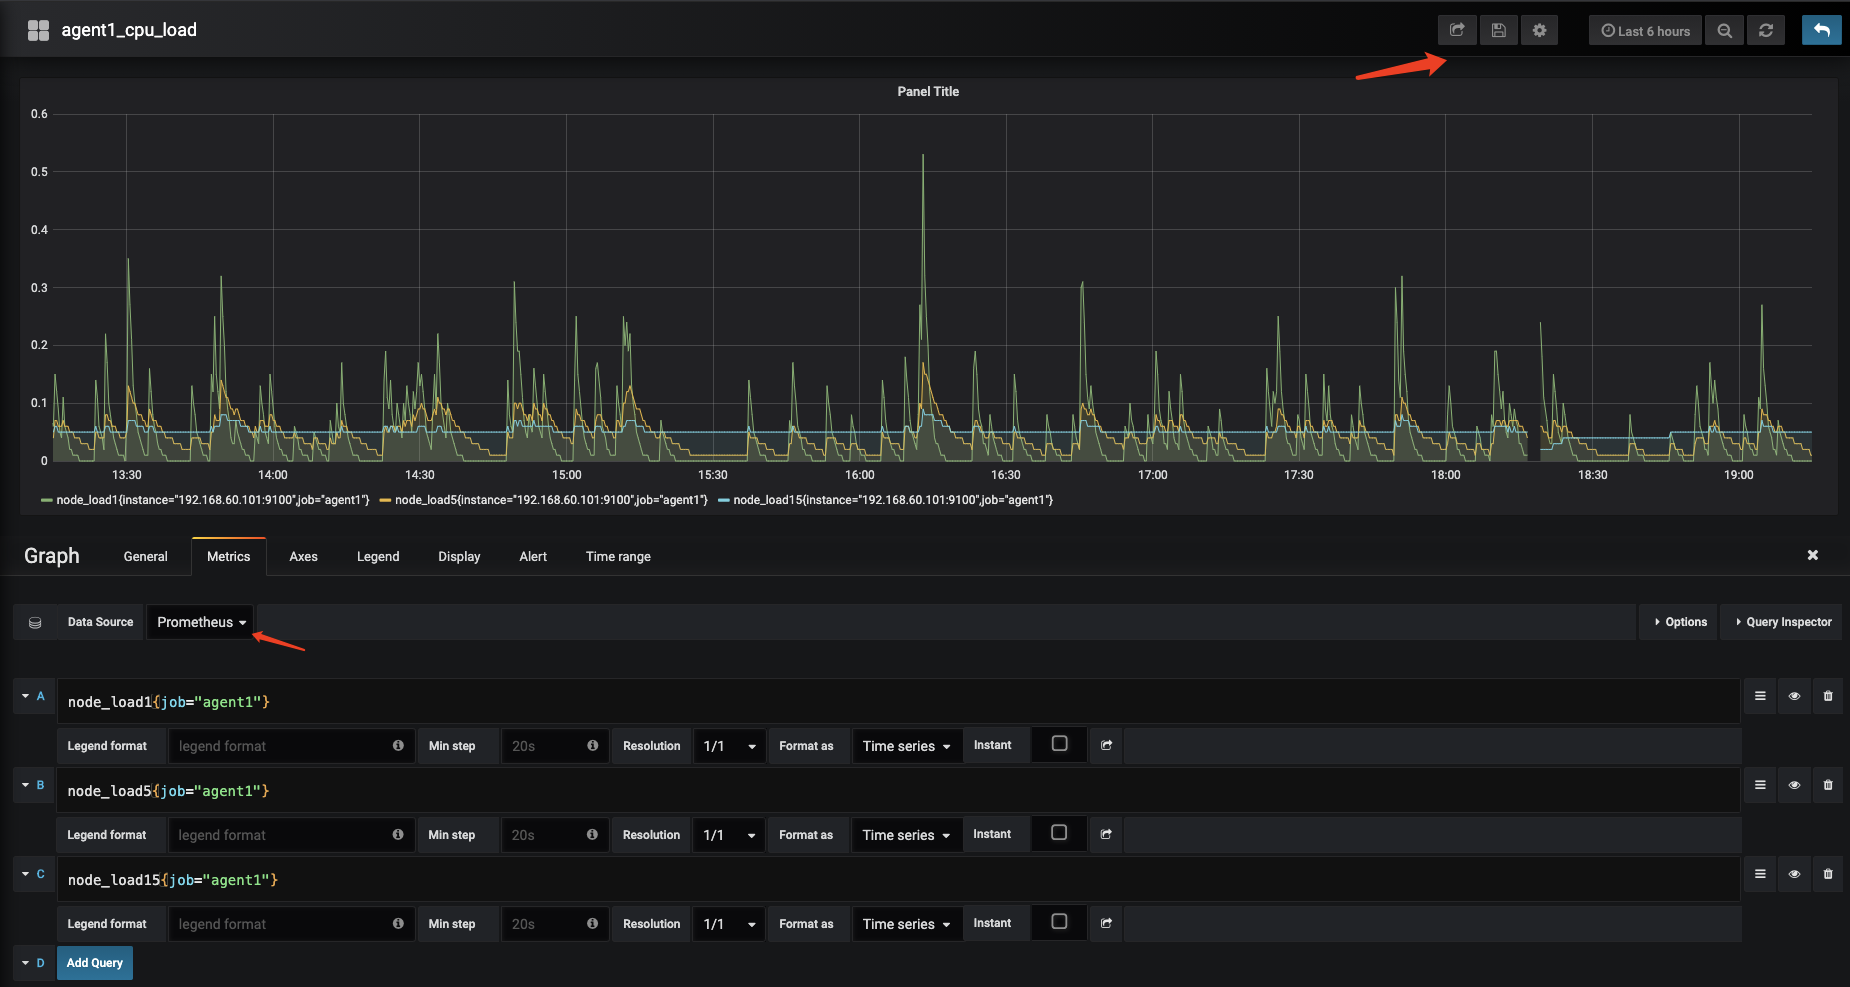
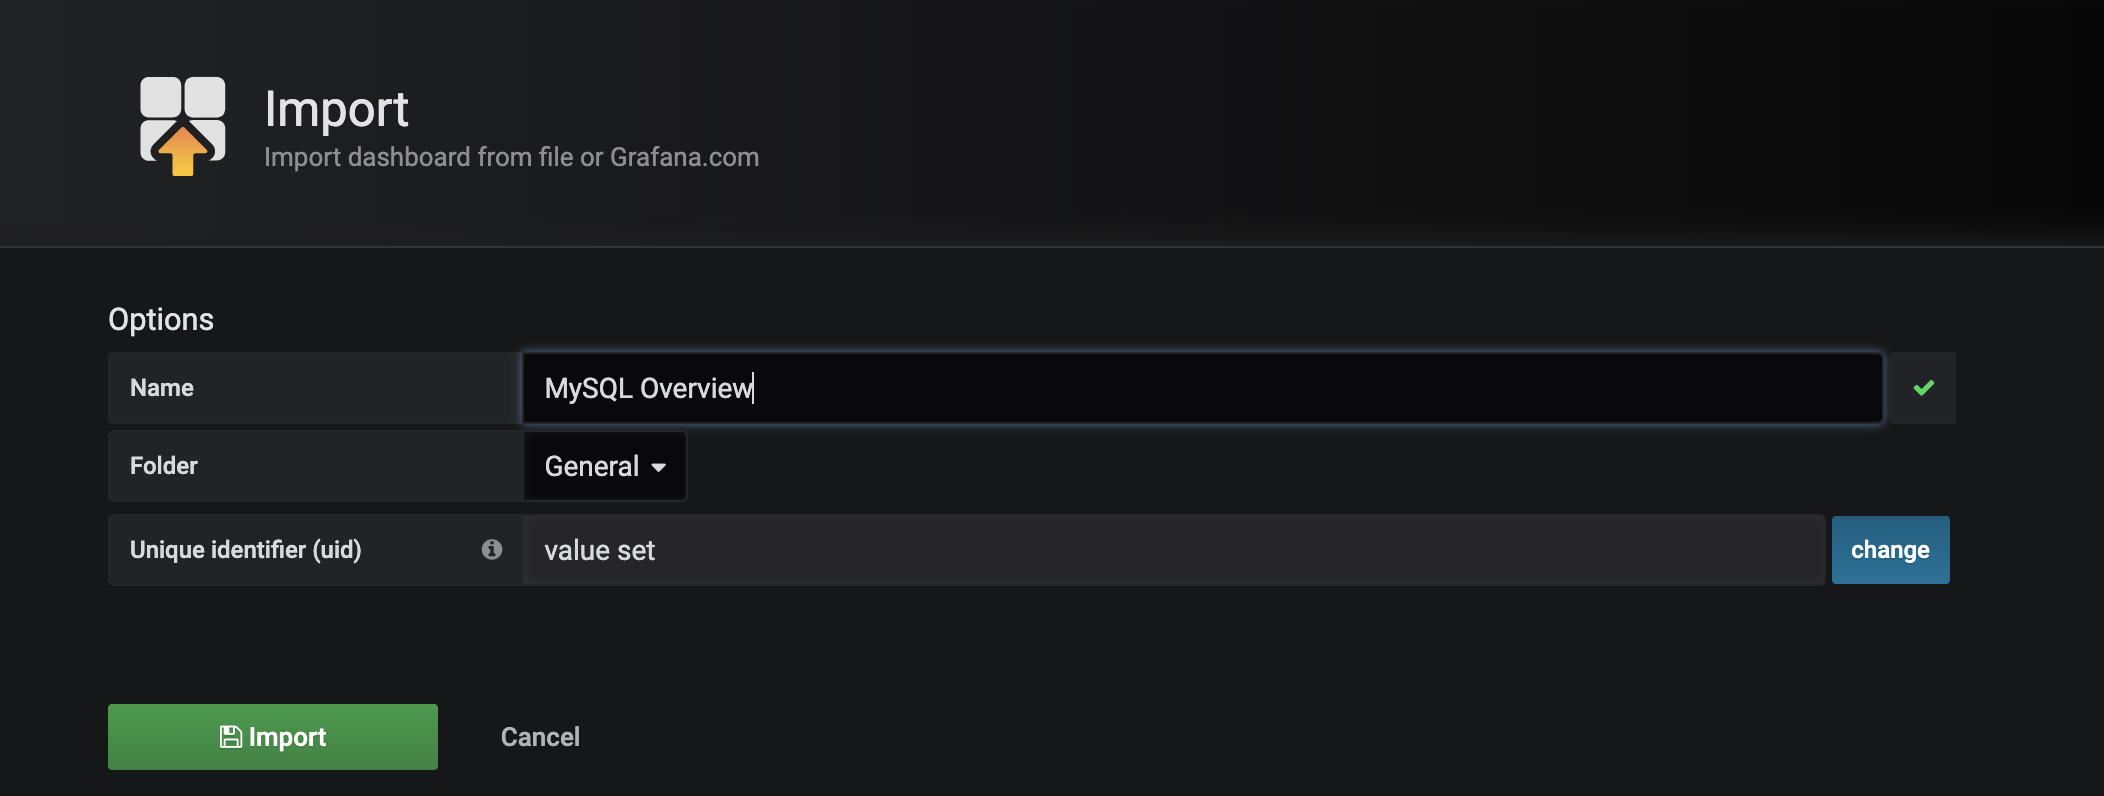
上述已经将Granfana和Prometheus的数据源关联起来,现在是要做的就是将Prometheus收集到的数据进行图形化展示,操作如下:
1、修改grafana配置文件 #添加以下内容
[dashboards.json]
enabled= true
path=/var/lib/grafana/dashboards
[root@sha01monin-006 ~]#
#git clone https://github.com/percona/grafana-dashboards.git
#cp -r /var/lib/grafana/grafana-dashboards/dashboards/ /var/lib/grafana/
#systemctl restart grafana-server

验证Grafana数据收集是否正常.
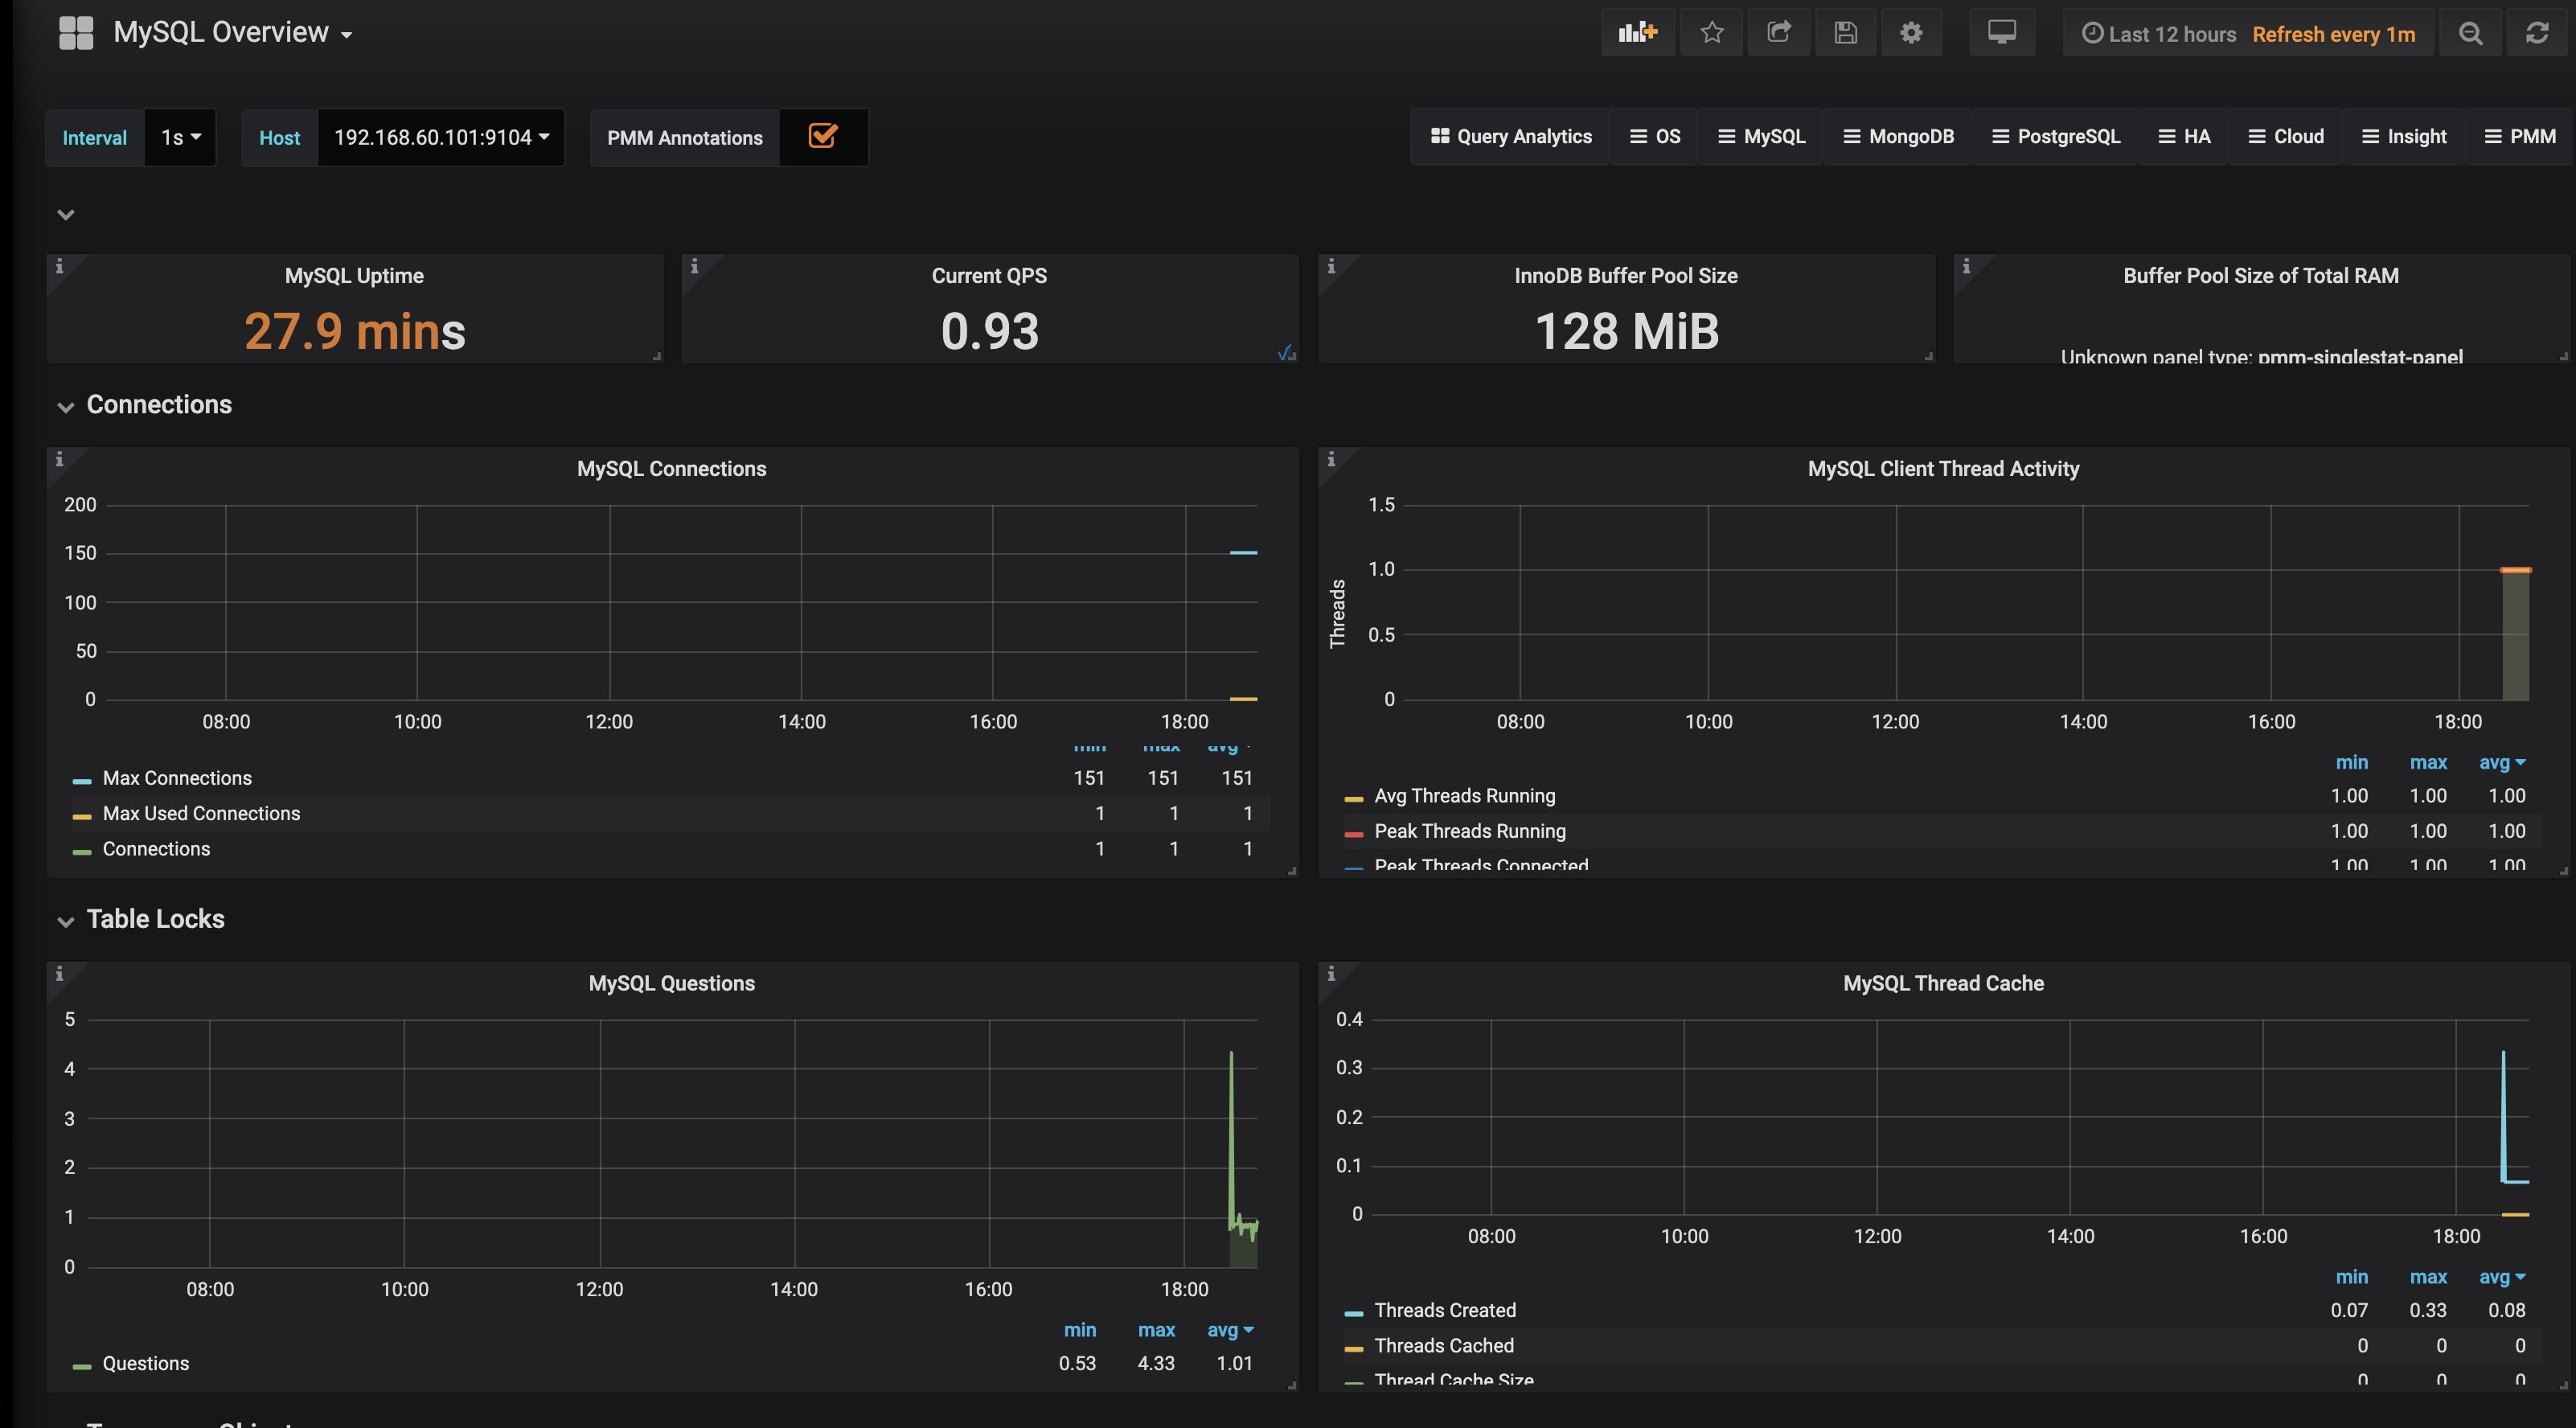
END!

 浙公网安备 33010602011771号