Kubernetes 之 Prometheus - pushgateway【八】
pushgateway 是采用被动推送的方式,而不是类似于 prometheus server 主动连接 exporter 获取监控数据

pushgateway 可以单独运行在一个节点,然后需要自定义监控脚本把需要监控的主动推送给 pushgatewa的API接口,
然后 pushgateway 再等待 prometheus server 抓取数据,即 pushgateway 本身没有任何折取监控数据的功能,
目前 pushgateway 只是被动的等待数据从客户端推送过来。

-persistence.file="#数据保存的文件,默认只保存在内存中
-persistence.interval=5m #数据持久化的间隔时间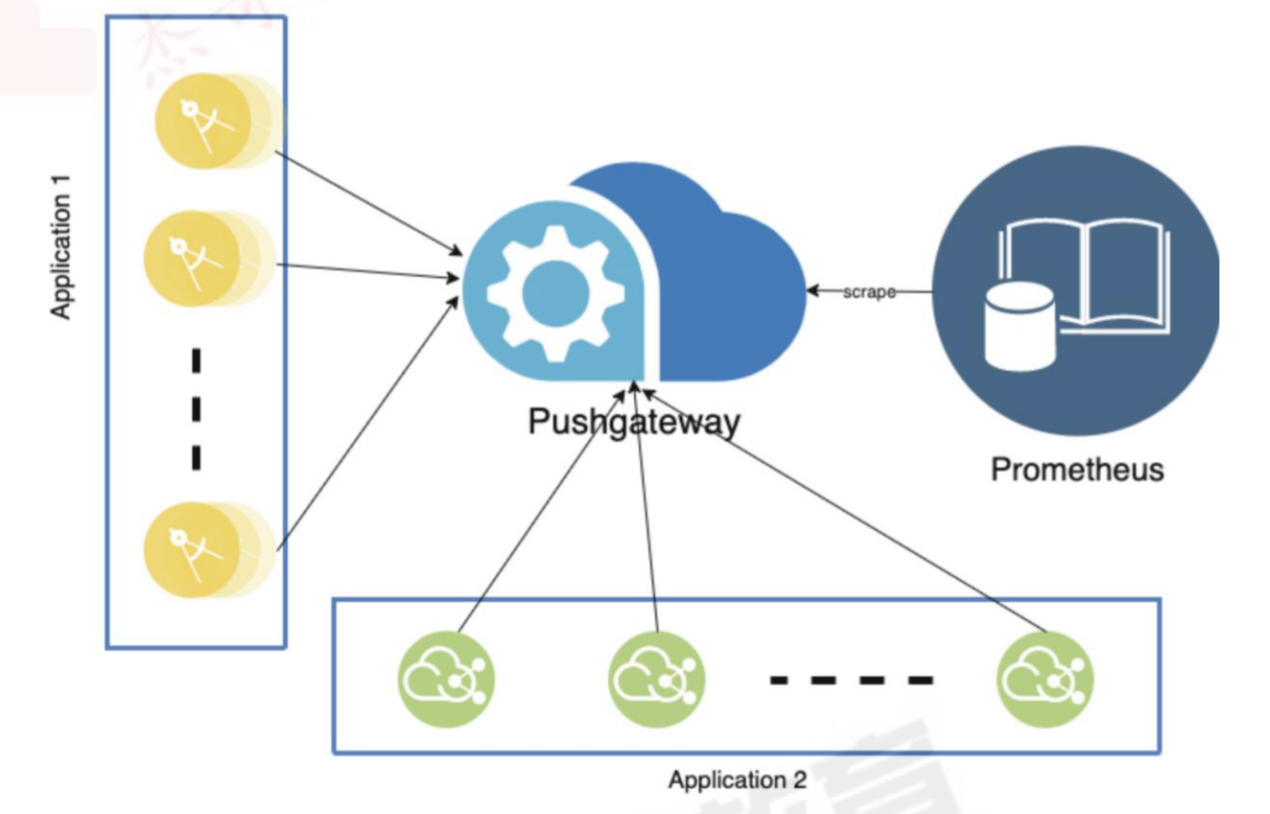
#1、下载地址
https://prometheus.io/download/#pushgateway

[root@xianchaomaster1 prometheus]# wget https://github.com/prometheus/pushgateway/releases/download/v1.5.1/pushgateway-1.5.1.linux-amd64.tar.gz
[root@xianchaomaster1 prometheus]# tar zxvf pushgateway-1.5.1.linux-amd64.tar.gz
pushgateway-1.5.1.linux-amd64/
pushgateway-1.5.1.linux-amd64/LICENSE
pushgateway-1.5.1.linux-amd64/NOTICE
pushgateway-1.5.1.linux-amd64/pushgateway
[root@xianchaomaster1 prometheus]# cp pushgateway-1.5.1.linux-amd64/pushgateway /usr/local/bin/

#2、直接启动或者写一个service文件启动 9091端口
[root@xianchaomaster1 prometheus]# pushgateway
ts=2023-04-28T14:00:39.558Z caller=main.go:100 level=info msg="starting pushgateway" version="(version=1.5.1, branch=HEAD, revision=7afc96cfc5e2b278f3b20e56968ff30eea22b70e)"
ts=2023-04-28T14:00:39.558Z caller=main.go:101 level=info build_context="(go=go1.19.3, user=root@fc81889ee1a6, date=20221129-16:30:38)"
ts=2023-04-28T14:00:39.560Z caller=tls_config.go:232 level=info msg="Listening on" address=[::]:9091
ts=2023-04-28T14:00:39.560Z caller=tls_config.go:235 level=info msg="TLS is disabled." http2=false address=[::]:9091

#3、访问 192.168.40.180:9091
192.168.40.180:9091
192.168.40.180:9091/metrics

#4、配置Prometheus文件
[root@xianchaomaster1 prometheus]# cat /apps/prometheus/prometheus.yml
添加以下
  - job_name: "pushgateway-monitor"
    scrape_interval: 5s
    static_configs:
    - targets: ["192.168.40.180:9091"]
    honor_labels: true

#5、测试从客户端推送单挑数据
#要 Push 数据到 PushGateway 中,可以通过其提供的 API 标准接口来添加
#默认 URL 地址为:http://<ip>:9091/metrics/job/<JOBNAME>{/<LABEL NAME>/<LABEL VALUE>}
#其中<JOBNAME>是必填项,为 job 标签值,后边可以跟任意数量的标签对,一般我们会添加一个instance/<INSTANCE NAME>实例名称标签,来方便区分各个指标。
#推送一个job 名称为 mytest_job,key 为mytest_metric 值为 2022
#Job名:mytest_job_he 检查项:mytest_metric、mytest_metric_num1、mytest_metric_num2
[root@xianchaomaster1 prometheus]# echo "mytest_metric 1220" | curl --data-binary @- http://192.168.40.180:9091/metrics/job/mytest_job_he
[root@xianchaomaster1 prometheus]# echo "mytest_metric_num1 8888888" | curl --data-binary @- http://192.168.40.180:9091/metrics/job/mytest_job_he
[root@xianchaomaster1 prometheus]# echo "mytest_metric_num2 99" | curl --data-binary @- http://192.168.40.180:9091/metrics/job/mytest_job_he

#增加一个Job:mytest_job_xks
[root@xianchaomaster1 prometheus]# echo "mytest_metric_num1 0319" | curl --data-binary @- http://192.168.40.180:9091/metrics/job/mytest_job_xks

#6、测试从客户端推送多条数据
[root@xianchaomaster1 prometheus]# cat <<EOF | curl --data-binary @- http://192.168.40.180:9091/metrics/job/xks_multi_line_job/instance/192.168.40.180
#TYPE node_memory_usage gauge
node_memory_usage 4311744512
# TYPE memory_total_gauge
node_memory_total 103481868288
EOF

#7、自定义脚本 多条数据推送
[root@xianchaomaster1 prometheus]# cat mem_monitor.sh
#!/bin/bash
total_memory=$(free | awk '/Mem/{print $2}')
used_memory=$(free | awk '/Mem/{print $3}')

job_name="custom_memory_monitor"
instance_name=`ifconfig ens33 | grep -w inet | awk '{print $2}'`
pushgateway_server="http://192.168.40.180:9091/metrics/job"

#这里复制需要去掉cat前面#
#cat <<EOF | curl --data-binary @- ${pushgateway_server}/${job_name}/instance/${instance_name}
#TYPE custom_memory_total gauge
custom_memory_total $total_memory
#TYPE custom_memory_used gauge
custom_memory_used $used_memory
EOF

[root@xianchaomaster1 prometheus]# bash mem_monitor.sh

#8、删除数据
一、curl -X DELETE  http://192.168.40.180:9091/metrics/job/mytest_job_xks
二、或者 直接界面删除


 浙公网安备 33010602011771号