ELK
ElasticSearch6 安装部署

1、https://www.jianshu.com/p/72eb42c05dc4

2、配置文件修改
elasticsearch.yml
1)network.host: 0.0.0.0
访问 http://192.168.222.153:9200/

=========================================================================================================================================
3、安装head插件
Head是elasticsearch的集群管理工具,可以用于数据的浏览和查询

(1)elasticsearch-head是一款开源软件,被托管在github上面,所以如果我们要使用它,必须先安装git,通过git获取elasticsearch-head

(2)运行elasticsearch-head会用到grunt,而grunt需要npm包管理器,所以nodejs是必须要安装的

(3)elasticsearch5.0之后,elasticsearch-head不做为插件放在其plugins目录下了。

1)安装nodejs
https://blog.csdn.net/qq_38591756/article/details/82830121

遇到认证的问题如下操作
npm config set strict-ssl false


2)安装Head插件
cd /usr/local/
git clone git://github.com/mobz/elasticsearch-head.git

安装elasticsearch-head依赖包
[root@localhost local]# npm install -g grunt-cli
[root@localhost _site]# cd /usr/local/elasticsearch-head/
[root@localhost elasticsearch-head]# cnpm install

修改Gruntfile.js
[root@localhost elasticsearch-head]# vi Gruntfile.js
在connect-->server-->options下面添加:hostname:’*’,允许所有IP可以访问

修改elasticsearch-head默认连接地址
[root@localhost elasticsearch-head]# cd /usr/local/elasticsearch-head/_site/
[root@localhost _site]# vi app.js
将this.base_uri = this.config.base_uri || this.prefs.get("app-base_uri") || "http://localhost:9200";中的localhost修改成你es的服务器地址

配置elasticsearch允许跨域访问
打开elasticsearch的配置文件elasticsearch.yml,在文件末尾追加下面两行代码即可:
http.cors.enabled: true
http.cors.allow-origin: "*"

打开9100端口
[root@localhost elasticsearch-head]# firewall-cmd --zone=public --add-port=9100/tcp --permanent
重启防火墙
[root@localhost elasticsearch-head]# firewall-cmd --reload

启动elasticsearch

启动elasticsearch-head
[root@localhost _site]# cd /usr/local/elasticsearch-head/
[root@localhost elasticsearch-head]# node_modules/grunt/bin/grunt server

(11)访问elasticsearch-head
关闭防火墙:systemctl stop firewalld.service

浏览器输入网址:http://192.168.222.153:9100/


=========================================================================================================================================
### 1.8安装Kibana
Kibana是一个针对Elasticsearch的开源分析及可视化平台,使用Kibana可以查询、查看并与存储在ES索引的数据进行交互操作,使用Kibana能执行高级的数据分析,并能以图表、表格和地图的形式查看数据

(1)下载Kibana
https://www.elastic.co/cn/downloads/past-releases/kibana-6-2-4

(2)把下载好的压缩包拷贝到/soft目录下

(3)解压缩,并把解压后的目录移动到/user/local/kibana

(4)编辑kibana配置文件
[root@localhost /]# vi /usr/local/kibana/config/kibana.yml
将server.host,elasticsearch.url修改成所在服务器的ip地址

(5)开启5601端口
Kibana的默认端口是5601
开启防火墙:systemctl start firewalld.service
开启5601端口:firewall-cmd --permanent --zone=public --add-port=5601/tcp
重启防火墙:firewall-cmd –reload

(6)启动Kibana
[root@localhost /]# /usr/local/kibana/bin/kibana

浏览器访问:http://192.168.222.153:5601
elasticsearch-head插件可以不用自己安装,谷歌浏览器可以直接下载插件。
es版本系列:6.8.7
nginx日志的简单收集
最基础的配置

[root@localhost filebeat-6.8.7-linux-x86_64]# egrep -v  "#|^$" filebeat.yml
filebeat.inputs:
- type: log
  enabled: true
  paths:
    - /opt/openresty/nginx/logs/access.log
filebeat.config.modules:
  path: ${path.config}/modules.d/*.yml
  reload.enabled: false
setup.template.settings:
  index.number_of_shards: 3
setup.kibana:
output.elasticsearch:
  hosts: ["192.168.60.192:9200"]
processors:
  - add_host_metadata: ~
  - add_cloud_metadata: ~
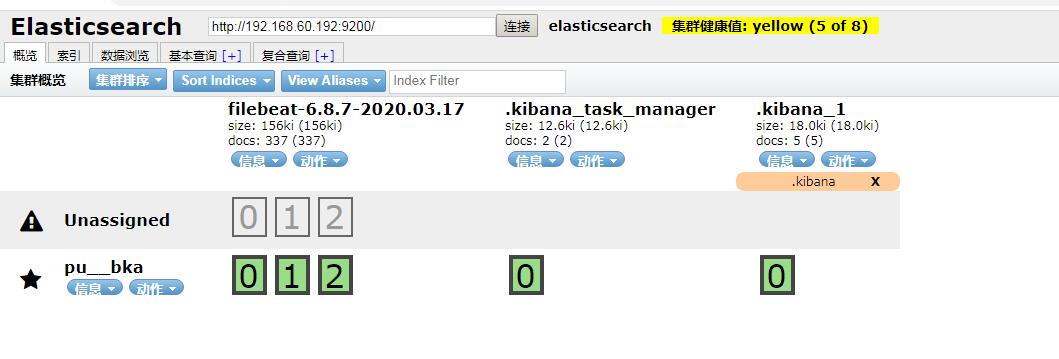
head展示页面,当我改了filebeat,新增一个filebeat之后,head上增加了一个索引,但是这种索引方式现实使用中的情况是不符合场景的,会变成每天都产生一个索引,不便于数据分析,而且这种命名方式也不够清晰:
kibana的展示页面:
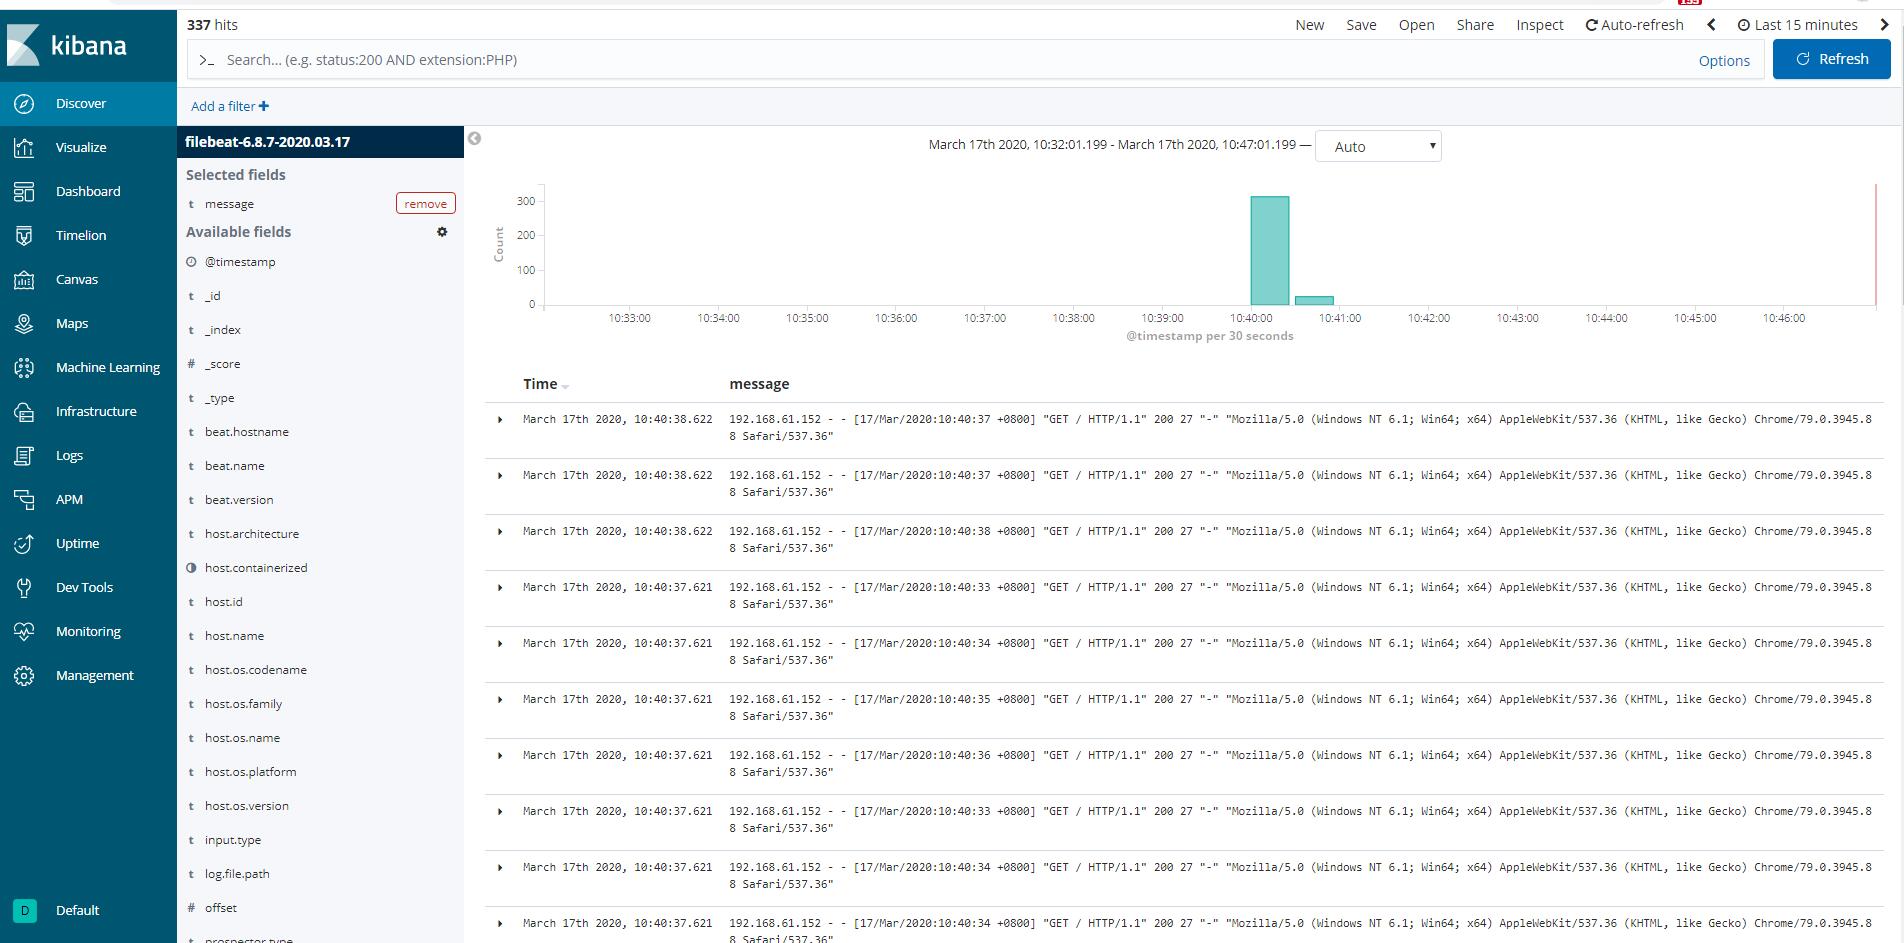
这样最多只能展示出message信息,如果说要像阿里云那样根据字段拆分,键值对分析,这个方式就不行。
接下来开始对nginx的日志进行改造:
1)filebeat配置:
json配置:https://www.elastic.co/guide/en/beats/filebeat/6.8/filebeat-input-log.html
如果只是修改json数据,下面两个操作就不用看了
修改默认的索引名:https://www.elastic.co/guide/en/beats/filebeat/6.8/elasticsearch-output.html
修改默认的索引名后需要修改默认模板:https://www.elastic.co/guide/en/beats/filebeat/master/configuration-template.html
filebeat.inputs:
- type: log
  enabled: true
  json.keys_under_root: true
  json.overwrite_keys: true
  paths:
    - /opt/openresty/nginx/logs/access.log
filebeat.config.modules:
  path: ${path.config}/modules.d/*.yml
  reload.enabled: false
setup.template.settings:
  index.number_of_shards: 3
setup.kibana:
output.elasticsearch:
  hosts: ["192.168.60.192:9200"]
  index: "nginx-%{[beat.version]}-%{+yyyy.MM}"
processors:
  - add_host_metadata: ~
  - add_cloud_metadata: ~
setup.template.name: "nginx"
setup.template.pattern: "nginx-*"
setup.template.overwrite: true
setup.template.enabled: false
2)nginx修改日志格式为json方式:
        log_format access_json_log  '{"@timestamp":"$time_local",'
                                 '"http_host":"$http_host",'
                                 '"clinetip":"$remote_addr",'
                                 '"request":"$request",'
                                 '"status":"$status",'
                                 '"size":"$body_bytes_sent",'
                                 '"upstream_addr":"$upstream_addr",'
                                 '"upstream_status":"$upstream_status",'
                                 '"upstream_response_time":"$upstream_response_time",'
                                 '"request_time":"$request_time",'
                                 '"http_referer":"$http_referer",'
                                 '"http_user_agent":"$http_user_agent",'
                                 '"http_x_forwarded_for":"$http_x_forwarded_for"}';

        access_log  /opt/openresty/nginx/logs/access.log  access_json_log;
3)删除es相关索引(head上操作),删除kibana索引,重启filebeat
最后需要实现的方式:
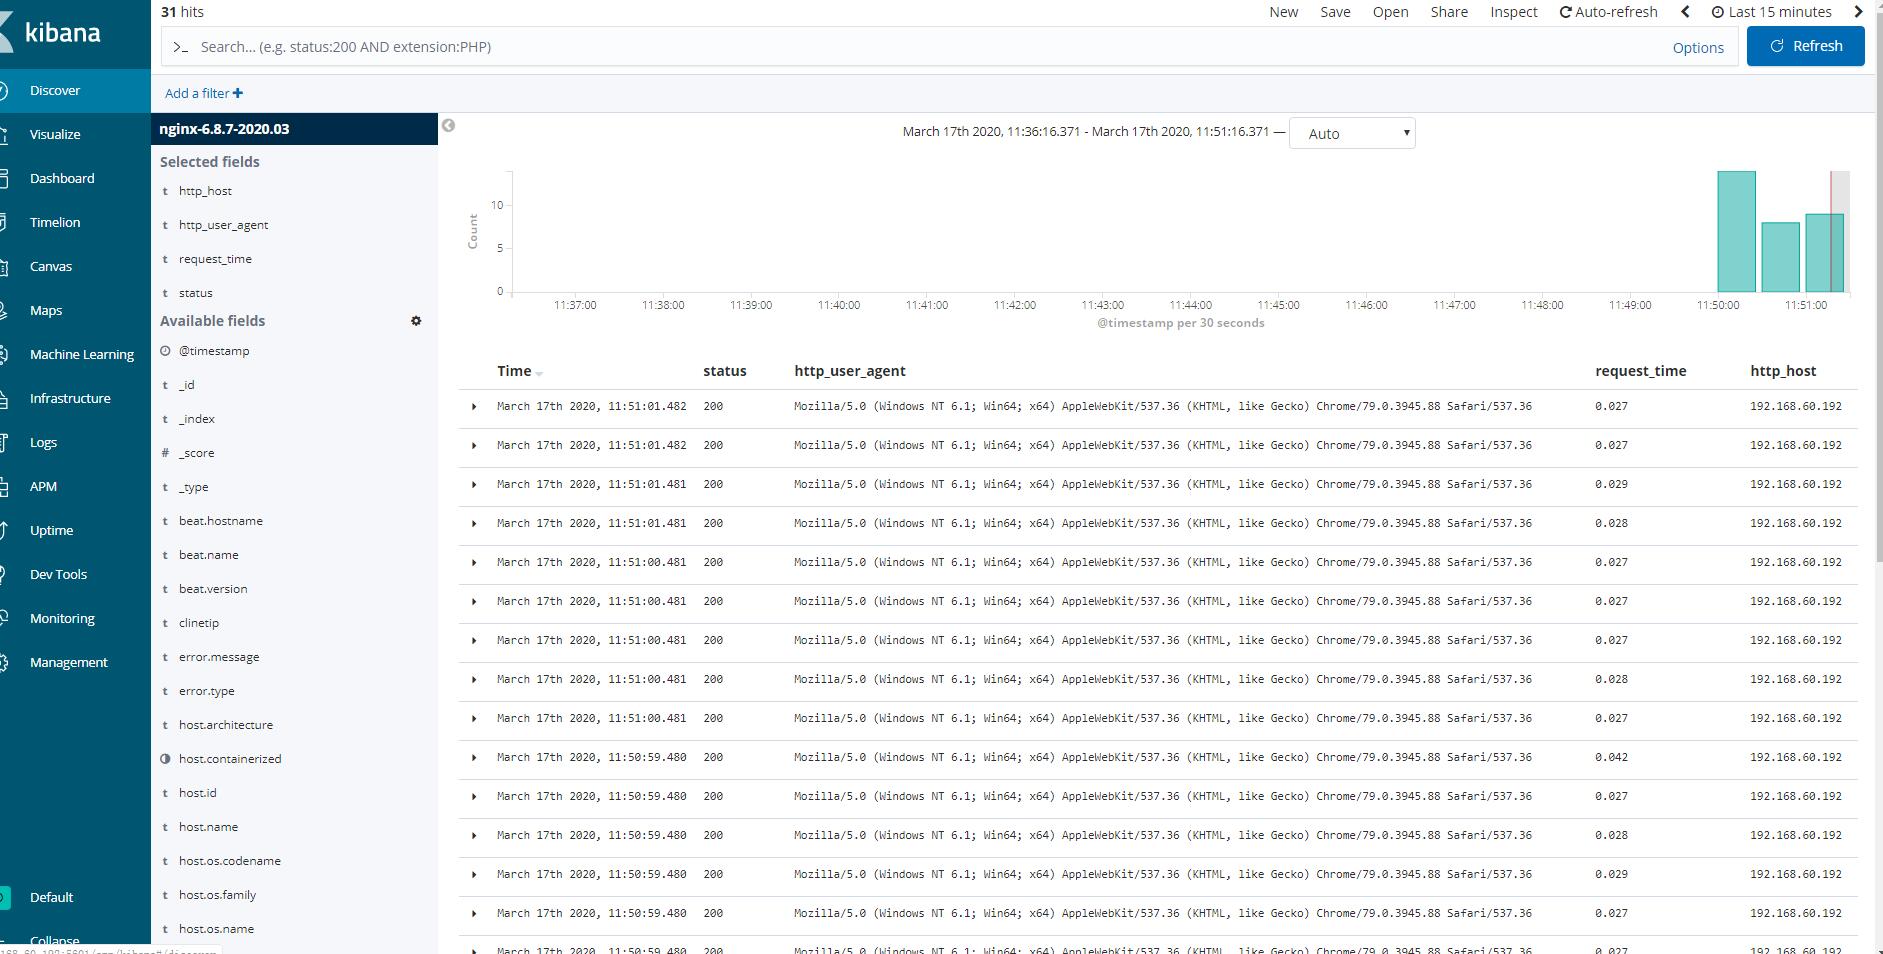
各个字段颗粒分明,great
nginx复杂日志收集
将访问日志和错误日志隔开,切记beat.version,这个一定要去官网查看对应版本的常量,要不然索引是不会正常建立的。
filebeat.inputs:
#============================nginx=============================
- type: log
  enabled: true
  json.keys_under_root: true
  json.overwrite_keys: true
  paths:
    - /opt/openresty/nginx/logs/access.log
  tags: ["access"]

- type: log
  enabled: true
  paths:
    - /opt/openresty/nginx/logs/error.log
  tags: ["error"]


output.elasticsearch:
  hosts: ["192.168.60.192:9200"]
  #index: "nginx-%{[beat.version]}-%{+yyyy.MM}"
  indices:
    - index: "access-%{[beat.version]}-%{+yyyy.MM}"
      when.contains:
        tags: "access"
    - index: "error-%{[beat.version]}-%{+yyyy.MM}"
      when.contains:
        tags: "error"

setup.template.name: "nginx"
setup.template.pattern: "nginx-*"
setup.template.overwrite: true
setup.template.enabled: false
tomcat日志收集
1、自行安装tomcat
yum -y install tomcat tomcat-webapps tomcat-admin-webapps tomcat-docs-webapp tomcat-javadoc
systemctl start tomcat
systemctl status tomcat
2、查看tomcat日志
tail -f /var/log/tomcat/localhost_access_log.2020-03-18.txt
3、把tomcat日志转换成json格式
修改这个日志格式:
pattern="%h %l %u %t "%r" %s %b"
如下:
pattern="{"client":"%h",  "client user":"%l",   "authenticated":"%u",   "access time":"%t",     "method":"%r",   "status":"%s",  "send bytes":"%b",  "Query?string":"%q",  "partner":"%{Referer}i",  "Agent version":"%{User-Agent}i"}"/>
4、重启并清空原有日志
> /var/log/tomcat/localhost_access_log.2020-03-18.txt
systemctl restart tomcat

5、修改filebeat
filebeat.inputs:
#============================nginx=============================
- type: log
  enabled: true
  json.keys_under_root: true
  json.overwrite_keys: true
  paths:
    - /opt/openresty/nginx/logs/access.log
  tags: ["access"]

- type: log
  enabled: true
  paths:
    - /opt/openresty/nginx/logs/error.log
  tags: ["error"]

#============================tomcat=============================
- type: log
  enabled: true
  json.keys_under_root: true
  json.overwrite_keys: true
  paths:
    - /var/log/tomcat/localhost_access_log.*.txt
  tags: ["tomcat"]

output.elasticsearch:
  hosts: ["192.168.60.192:9200"]
  #index: "nginx-%{[beat.version]}-%{+yyyy.MM}"
  indices:
    - index: "access-nginx-%{[beat.version]}-%{+yyyy.MM}"
      when.contains:
        tags: "access"
    - index: "error-nginx-%{[beat.version]}-%{+yyyy.MM}"
      when.contains:
        tags: "error"
    - index: "tomcat-access-%{[beat.version]}-%{+yyyy.MM}"
      when.contains:
        tags: "tomcat"

#覆盖模板可能出现时区报错的问题,所以让索引名字不一样,不去匹配模板
setup.template.name: "nginx"
setup.template.pattern: "nginx-*"
setup.template.overwrite: true
setup.template.enabled: false
时区的问题的罪魁祸首找到了,nginx的日志时区有问题,修改一下nginx的日志模板。
log_format access_json '{"@timestamp":"$time_iso8601",'
                   '"host":"$server_addr",'
                   '"clientip":"$remote_addr",'
                   '"size":$body_bytes_sent,'
                   '"responsetime":$request_time,'
                   '"upstreamtime":"$upstream_response_time",'
                   '"upstreamhost":"$upstream_addr",'
                   '"http_host":"$host",'
                   '"url":"$uri",'
                   '"domain":"$host",'
                   '"xff":"$http_x_forwarded_for",'
                   '"referer":"$http_referer",'
                   '"status":"$status"}';
filebeat.inputs:
#============================nginx=============================
- type: log
  enabled: true
  json.keys_under_root: true
  json.overwrite_keys: true
  paths:
    - /opt/openresty/nginx/logs/access.log
  tags: ["access"]

- type: log
  enabled: true
  paths:
    - /opt/openresty/nginx/logs/error.log
  tags: ["error"]

#============================tomcat=============================
- type: log
  enabled: true
  json.keys_under_root: true
  json.overwrite_keys: true
  paths:
    - /var/log/tomcat/localhost_access_log.*.txt
  tags: ["tomcat"]

output.elasticsearch:
  hosts: ["192.168.60.192:9200"]
  #index: "nginx-%{[beat.version]}-%{+yyyy.MM}"
  indices:
    - index: "nginx-access-%{[beat.version]}-%{+yyyy.MM}"
      when.contains:
        tags: "access"
    - index: "nginx-error-%{[beat.version]}-%{+yyyy.MM}"
      when.contains:
        tags: "error"
    - index: "tomcat-access-%{[beat.version]}-%{+yyyy.MM}"
      when.contains:
        tags: "tomcat"

#覆盖模板可能出现时区报错的问题,所以让索引名字不一样,不去匹配模板
setup.template.name: "nginx"
setup.template.pattern: "nginx-*"
setup.template.overwrite: true
setup.template.enabled: false
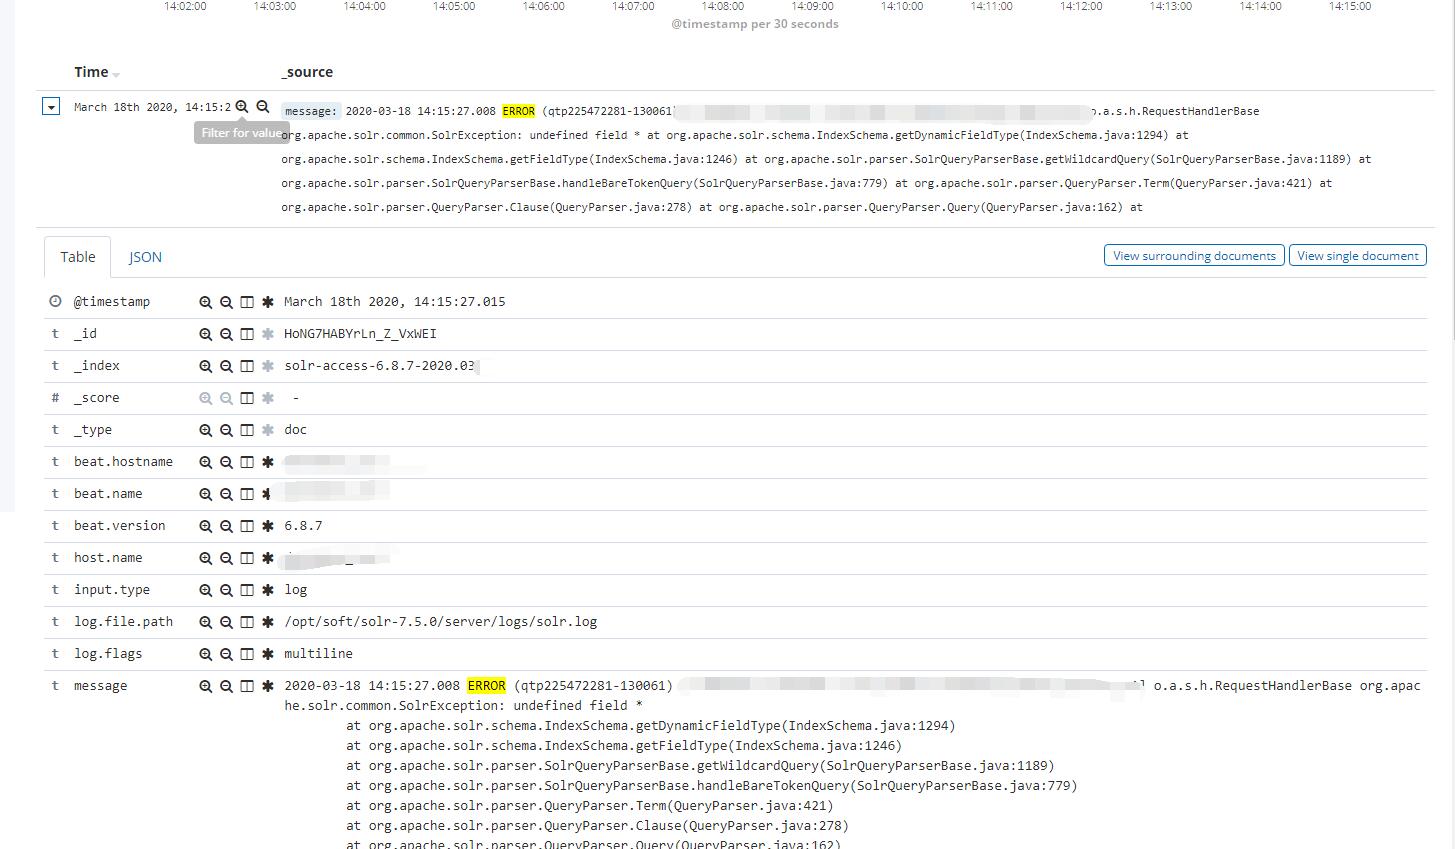
多行匹配java日志
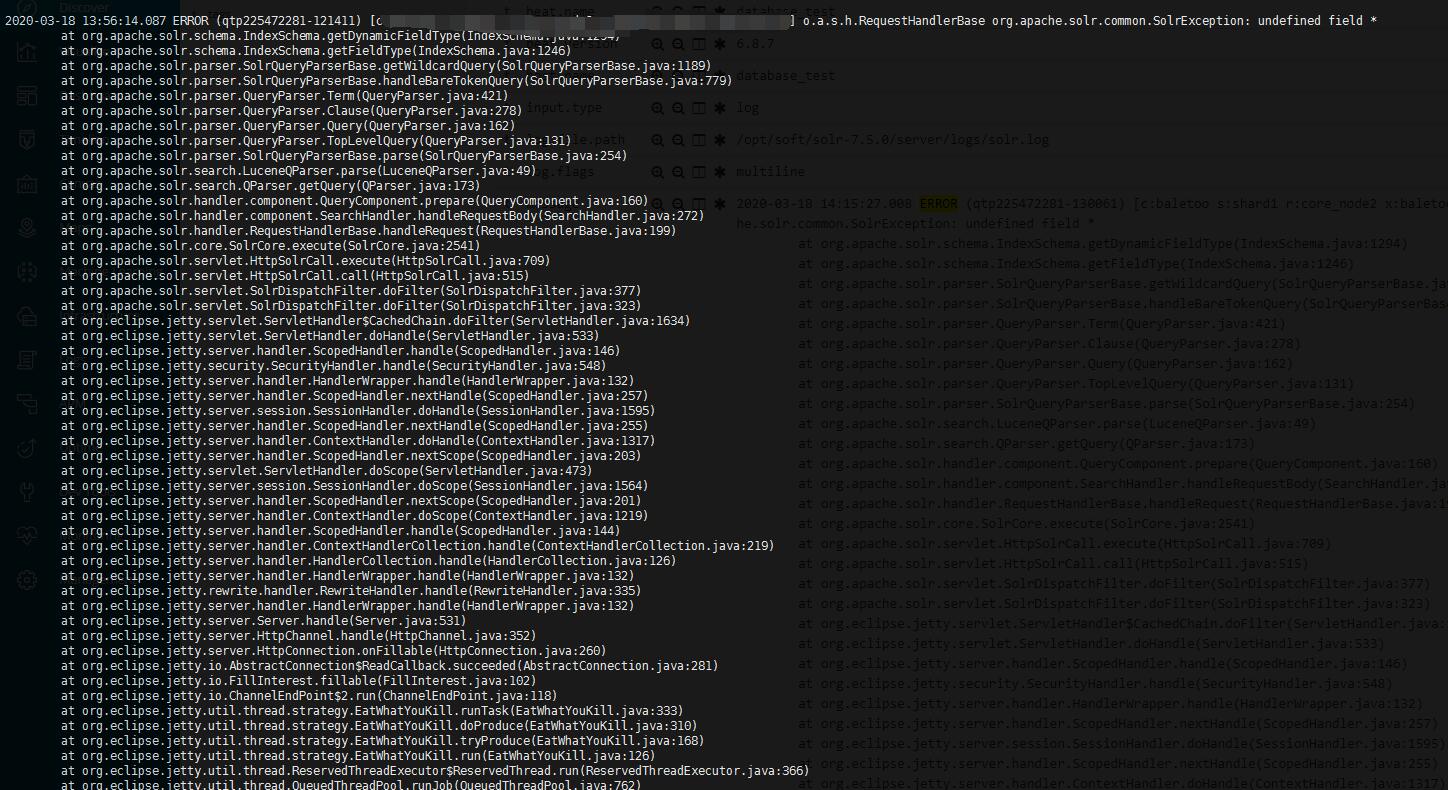
因为我这个是以时间开头的,所以修改了正则表达式
多行模式:https://www.elastic.co/guide/en/beats/filebeat/6.8/multiline-examples.html
正则:https://www.elastic.co/guide/en/beats/filebeat/6.8/regexp-support.html
filebeat.inputs:
#============================nginx=============================
- type: log
  enabled: false
  json.keys_under_root: true
  json.overwrite_keys: true
  paths:
    - /opt/openresty/nginx/logs/access.log
  tags: ["access"]

- type: log
  enabled: true
  paths:
    - /opt/openresty/nginx/logs/error.log
  tags: ["error"]

#============================tomcat=============================
- type: log
  enabled: false
  json.keys_under_root: true
  json.overwrite_keys: true
  paths:
    - /var/log/tomcat/localhost_access_log.*.txt
  tags: ["tomcat"]

#============================multiline.pattern=============================
- type: log
  enabled: true
  paths:
    - /opt/soft/solr-7.5.0/server/logs/solr.log
  #multiline.pattern: '^\['
  multiline.pattern: '^[0-9]{4}-[0-9]{2}-[0-9]{2}'
  multiline.negate: true
  multiline.match: "after"
  tags: ["solr"]


#============================output=============================
output.elasticsearch:
  hosts: ["192.168.60.192:9200"]
  #index: "nginx-%{[beat.version]}-%{+yyyy.MM}"
  indices:
    - index: "nginx-access-%{[beat.version]}-%{+yyyy.MM}"
      when.contains:
        tags: "access"
    - index: "nginx-error-%{[beat.version]}-%{+yyyy.MM}"
      when.contains:
        tags: "error"
    - index: "tomcat-access-%{[beat.version]}-%{+yyyy.MM}"
      when.contains:
        tags: "tomcat"
    - index: "solr-access-%{[beat.version]}-%{+yyyy.MM}"
      when.contains:
        tags: "solr"

#覆盖模板可能出现时区报错的问题,所以让索引名字不一样,不去匹配模板
setup.template.name: "nginx"
setup.template.pattern: "nginx-*"
setup.template.overwrite: true
setup.template.enabled: false
效果棒棒的
一下操作不是很实用
单个容器的日志收集
查看容器日志的json内容
tail  /var/lib/docker/containers/91a42f0501bdd264dbe6d720b68bacc100b3384e9e390f3a2093429c12cdb789/91a42f0501bdd264dbe6d720b68bacc100b3384e9e390f3a2093429c12cdb789-json.log |jq .
#============================docker=============================
- type: docker
  enabled: true
  containers.ids:
    - '91a42f0501bdd264dbe6d720b68bacc100b3384e9e390f3a2093429c12cdb789'
  json.keys_under_root: true
  json.overwrite_keys: true
  tags: ["docker"]


    - index: "docker-access-%{[beat.version]}-%{+yyyy.MM}"
      when.contains:
        tags: "docker"
        stream: "stdout"
    - index: "docker-error-%{[beat.version]}-%{+yyyy.MM}"
      when.contains:
        tags: "docker"
        stream: "stderr"
所有容器的日志收集
- type: docker
  containers.ids:
    - '*'
  json.key_under_root: true
  json.overwrite_keys: true
  tags: ["docker"]


    - index: "docker-access-%{[beat.version]}-%{+yyyy.MM}"
      when.contains:
         tags: "docker"
         stream: "stdout"
    - index: "docker-error-%{[beat.version]}-%{+yyyy.MM}"
      when.contains:
         tags: "docker"
         stream: "stderr"
但是收集到日志以后,所有的容器日志集中在一起,无法分辨,则为每一个容器添加一个标签。
通过docker-compose给容器加标签。可以给具体的docker容器增加labels,并且设置logging。可以通过docker inspect 看出来的呦。
version: '3'
services:
  nginx:
    image: nginx
    #设置labels
    labels:
      service: nginx
    #logging设置增加labels.service
    logging:
      options:
        labels: "service"
    ports:
      - "8083:80"
  httpd:
    image: httpd:2.4
    #设置labels
    labels:
      service: httpd
    #logging设置增加labels.service
    logging:
      options:
        labels: "service"
    ports:
      - "8084:80"
此时的filebeat配置文件发生了改变,type由docker变成了log,根据docker日志中标记的标签进行分类。
filebeat.inputs:
#============================docker=============================
filebeat.inputs:
#============================docker=============================
- type: log
  enabled: true
  paths:
    - "/var/lib/docker/containers/*/*-json.log"
  json.keys_under_root: true
  json.overwrite_keys: true


  tags: ["docker"]

#============================output=============================
output.elasticsearch:
  hosts: ["192.168.60.192:9200"]
  #index: "nginx-%{[beat.version]}-%{+yyyy.MM}"
  indices:
    - index: "docker-nginx-access-%{[beat.version]}-%{+yyyy.MM}"
      when.contains:
        tags: "docker"
        attrs.service: "nginx"
        stream: "stdout"
    - index: "docker-nginx-error-%{[beat.version]}-%{+yyyy.MM}"
      when.contains:
        tags: "docker"
        attrs.service: "nginx"
        stream: "stderr"
    - index: "docker-httpd-access-%{[beat.version]}-%{+yyyy.MM}"
      when.contains:
        tags: "docker"
        attrs.service: "httpd"
        stream: "stdout"
    - index: "docker-httpd-error-%{[beat.version]}-%{+yyyy.MM}"
      when.contains:
        tags: "docker"
        attrs.service: "httpd"
        stream: "stderr"


setup.template.name: "nginx"
setup.template.pattern: "nginx-*"
setup.template.overwrite: true
setup.template.enabled: false
redis缓存收集
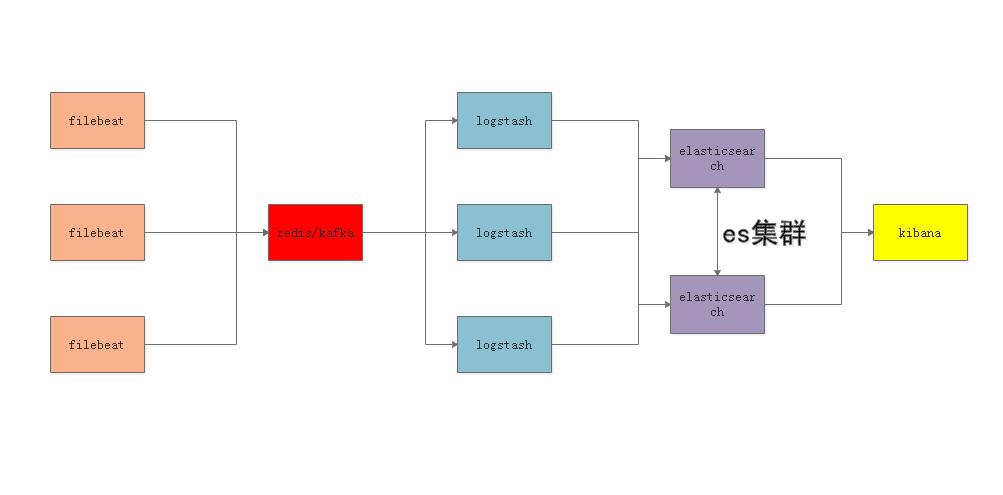
根据上述架构进行日志采集。
简单版本:
这个操作下所有的日志都是在一起的没有区分。
filebeat.yml
filebeat.inputs:
- type: log
  enabled: true
  paths:
    - "/var/lib/docker/containers/*/*-json.log"
  json.keys_under_root: true
  json.overwrite_keys: true
  tags: ["docker"]
output.redis:
  hosts: ["localhost"]
  key: "filebeat"
  db: 0
  timeout: 5
setup.template.name: "nginx"
setup.template.pattern: "nginx-*"
setup.template.overwrite: true
setup.template.enabled: false


logstash.conf
input {
  redis {
    host => "127.0.0.1"
    port => "6379"
    db => "0"
    key => "filebeat"
    data_type => "list"
  }
}
filter{
  mutate {
    convert => ["upstream_time","float"]
    convert => ["request_time","float"]
  }
}

output{
  stdout {}
    elasticsearch {
      hosts => "192.168.60.192:9200"
      manage_template => false
      index => "nginx_access-%{+yyyy.MM.dd}"
  }
}
根据上面的学习经验,研究了一下nginx和httpd的正常日志和错误日志的拆分。以下是高级一点的。只支持redis单节点。
过滤的功能是将从日志里面采集的数据格式转换成float类型,方便在kibana中排序使用。
filebeat.yml
filebeat.inputs:
#============================docker=============================
- type: log
  enabled: true
  paths:
    - "/var/lib/docker/containers/*/*-json.log"
  json.keys_under_root: true
  json.overwrite_keys: true


  tags: ["docker"]

output.redis:
  hosts: ["localhost"]
  #password: "my_password"
  #key: "filebeat"
  keys:
    - key: "nginx_access"
      when.contains:
        attrs.service: "nginx"
        stream: "stdout"
    - key: "nginx_error"
      when.contains:
        attrs.service: "nginx"
        stream: "stderr"
    - key: "httpd_access"
      when.contains:
        attrs.service: "httpd"
        stream: "stdout"
    - key: "httpd_error"
      when.contains:
        attrs.service: "httpd"
        stream: "stderr"
  db: 0
  timeout: 5
这个最外层的key的可以查看官网的解释:https://www.elastic.co/guide/en/beats/filebeat/6.8/redis-output.html
logstash.conf
#https://www.elastic.co/guide/en/logstash/6.8/plugins-inputs-redis.html#plugins-inputs-redis-key
input {
  redis {
    host => "127.0.0.1"
    port => "6379"
    db => "0"
    key => "nginx_access"
    data_type => "list"
  }
  redis {
    host => "127.0.0.1"
    port => "6379"
    db => "0"
    key => "nginx_error"
    data_type => "list"
  }
  redis {
    host => "127.0.0.1"
    port => "6379"
    db => "0"
    key => "httpd_access"
    data_type => "list"
  }
  redis {
    host => "127.0.0.1"
    port => "6379"
    db => "0"
    key => "httpd_error"
    data_type => "list"
  }
}
filter{
  mutate {
    convert => ["upstream_time","float"]
    convert => ["request_time","float"]
  }
}

#https://www.elastic.co/guide/en/logstash/6.8/event-dependent-configuration.html#conditionals
output{
  stdout {}
  if "nginx" in [attrs][service]{

     if "stdout" in [stream]{
        elasticsearch {
		  hosts => "192.168.60.192:9200"
		  manage_template => false
		  index => "nginx_access-%{+yyyy.MM}"
		}
     }

	 if "stderr" in [stream]{
		elasticsearch {
		  hosts => "192.168.60.192:9200"
		  manage_template => false
		  index => "nginx_error-%{+yyyy.MM}"
		 }
	 }
  }

  if "httpd" in [attrs][service]{

	if "stdout" in [stream]{
		elasticsearch {
		  hosts => "192.168.60.192:9200"
		  manage_template => false
		  index => "httpd_access-%{+yyyy.MM}"
		}
	}

    if "stderr" in [stream]{
	    elasticsearch {
		  hosts => "192.168.60.192:9200"
		  manage_template => false
		  index => "httpd_error-%{+yyyy.MM}"
		}
	}

  }

}
对应的条件判断有链接:https://www.elastic.co/guide/en/logstash/6.8/event-dependent-configuration.html#conditionals
input-redis的key的文档,这个就是reids的list的名字,原本想只写nginx和httpd的,以为会匹配上,但是发现失败了,后期可以再尝试一下:https://www.elastic.co/guide/en/logstash/6.8/plugins-inputs-redis.html#plugins-inputs-redis-key
所以当redis的key只为nginx的时候,里面是包含了access和error的,对应的firlbeat里面也只要有一个key就好了,具体的索引的拆分是在logstash里面的output里面拆分的,根据条件分多个索引。
升级了一下如下:
filebeat.inputs:
#============================docker=============================
- type: log
  enabled: true
  paths:
    - "/var/lib/docker/containers/*/*-json.log"
  json.keys_under_root: true
  json.overwrite_keys: true


  tags: ["docker"]

output.redis:
  hosts: ["localhost"]
  #password: "my_password"
  key: "filebeat"
  db: 0
  timeout: 5


input {
  redis {
    host => "127.0.0.1"
    port => "6379"
    db => "0"
    key => "filebeat"
    data_type => "list"
  }
}
filter{
  mutate {
    convert => ["upstream_time","float"]
    convert => ["request_time","float"]
  }
}


output{
  stdout {}
  if "nginx" in [attrs][service]{

     if "stdout" in [stream]{
        elasticsearch {
          hosts => "192.168.60.192:9200"
          manage_template => false
          index => "nginx_access-%{+yyyy.MM}"
        }
     }

     if "stderr" in [stream]{
        elasticsearch {
          hosts => "192.168.60.192:9200"
          manage_template => false
          index => "nginx_error-%{+yyyy.MM}"
         }
     }
  }

  if "httpd" in [attrs][service]{

    if "stdout" in [stream]{
        elasticsearch {
          hosts => "192.168.60.192:9200"
          manage_template => false
          index => "httpd_access-%{+yyyy.MM}"
        }
    }

    if "stderr" in [stream]{
        elasticsearch {
          hosts => "192.168.60.192:9200"
          manage_template => false
          index => "httpd_error-%{+yyyy.MM}"
        }
    }

  }

}
通过filebeat自带的模块进行日志收集
自带的东西扩展性都没有那么强的。我用的是6.8.7版本,不用安装额外安装报错的插件。
1、nginx日志配置成原本日志,不用json的格式。
2、filebeat配置文件
filebeat.config.modules:
  path: ${path.config}/modules.d/*.yml
  reload.enabled: true

setup.kibana:
  host: "192.168.60.192:5601"


output.elasticsearch:
  hosts: ["192.168.60.192:9200"]
  indices:
    - index: "nginx_access-%{[beat.version]}-%{+yyyy.MM}"
      when.contains:
        fileset.name: "access"
    - index: "nginx_error-%{[beat.version]}-%{+yyyy.MM}"
      when.contains:
        fileset.name: "error"


setup.template.name: "nginx"
setup.template.pattern: "nginx_*"
setup.template.enabled: false
setup.template.overwrite: true
3、激活nginx模块
./filebeat modules enable nginx
./filebeat modules list
4、nginx modules 配置
vim /opt/logsoft/filebeat-6.8.7-linux-x86_64/modules.d/nginx.yml
- module: nginx
  # Access logs
  access:
    enabled: true

    # Set custom paths for the log files. If left empty,
    # Filebeat will choose the paths depending on your OS.
    var.paths: ["/opt/openresty/nginx/logs/access.log"]

    # Convert the timestamp to UTC. Requires Elasticsearch >= 6.1.
    #var.convert_timezone: true

  # Error logs
  error:
    enabled: true

    # Set custom paths for the log files. If left empty,
    # Filebeat will choose the paths depending on your OS.
    var.paths: ["/opt/openresty/nginx/logs/error.log"]

    # Convert the timestamp to UTC. Requires Elasticsearch >= 6.1.
    #var.convert_timezone: true
默认没有启用的模块名是nginx.yml.disabled,启用这个模块后,disabled就去掉了。在kibana展示的error日志不是根据@timestamp进行排序的,根据read_timestamp的,要不然时间戳有问题。
相比reids和kafka做缓存的方式,用redis的方式更符合中小型规模的企业。
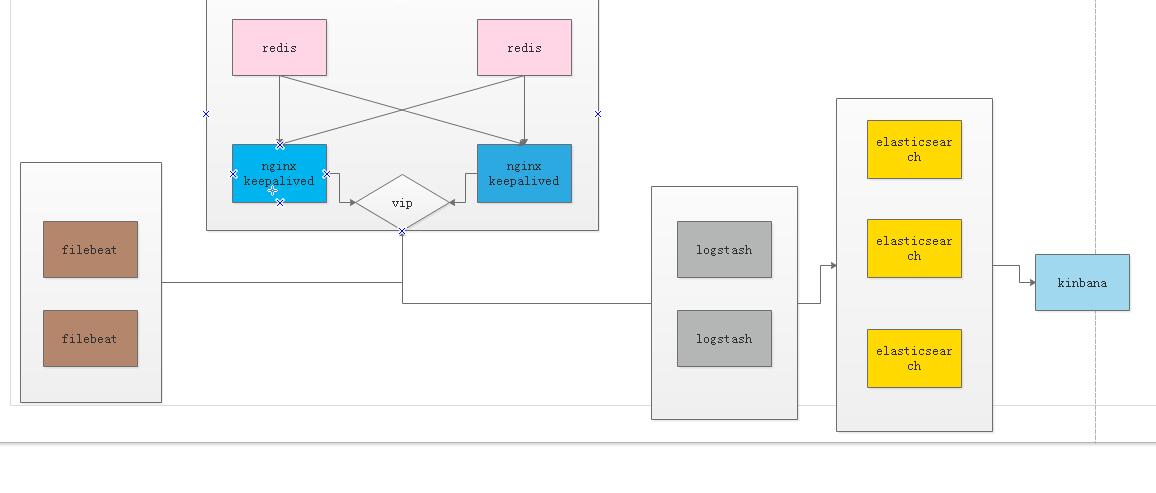
该图中的redis是通过nginx的四层转发进行负载均衡,我可以贴出我的一个UDP的转发配置。切记只是参考,不是上图的功能,仅供参考。
stream {

    tcp_nodelay on;
    log_format proxy '$remote_addr [$time_local] '
                 '$protocol $status $bytes_sent $bytes_received '
                 '$session_time "$upstream_addr" '
                 '"$upstream_bytes_sent" "$upstream_bytes_received" "$upstream_connect_time"';

    upstream wifi_udp {
        #zone wifi_udp 64k;
        #hash $remote_addr consistent;
        server 127.0.0.1:8999  max_fails=3 fail_timeout=30s;
        server 127.0.0.1:10081  max_fails=3 fail_timeout=30s;

    }

    server {
        listen 81 udp;
        proxy_timeout 20s;
        proxy_pass wifi_udp;
        #health_check udp;
        access_log /var/log/nginx/123.log proxy;
    }

}
filebeat linux系统日志采集
- type: log
  enabled: true
  paths:
    - /var/log/*.log
    - /var/log/messages
    - /var/log/secure
    - /var/log/maillog
    - /var/log/cron
    - /var/log/dmesg
    - /var/log/audit/audit.log
  exclude_files: ['.gz$']
  ignore_older: 24h
  tags: ["sys-log"]
全文参考:
https://www.jianshu.com/p/921e212ca8b9
https://www.cnblogs.com/zyxnhr/p/12227362.html

 浙公网安备 33010602011771号