linux取证相关命令
 人过留名,燕过留声。
who -b 上次系统启动时间
uname -r 打印内核release
ps 进程信息
service --status-all 显示所服务状态
chkconfig --list 显示所有已经启动的服务
systemctl list-units 列出正在运行的Unit(进程)
crontab -l 查看计划任务
netstat 查看Linux中网络系统状态信息
ss 获取socket 统计信息
last 显示用户最近登录信息
who 显示关于当前在本地系统上的所有登录用户的信息
lastlog 显示系统中所有用户最近一次登录信息
fdisk -l 查看当前所有分区信息
dd if=/dev/sdb of=/dev/sdc 全盘拷贝
df -h 查看系统磁盘
top -c -o %CPU -c参数显示进程的命令行参数 -p 参数指定进程的pid
ps -eo pid,ppid,%mem,%cpu,cmd --sort=%cpu | head -n 5 cpu占用前5信息
top -c -o %MEM
//Windows
wevtutil qe security /rd:true /f:text /q:"*[System/EventID=4624] and *[EventData/Data[@Name='TargetUserName']='administrator']"|findstr /c:"Address" /c:"Workstation Name:"
wevtutil qe security /rd:true /f:text /q:"*[System/EventID=4624] and *[EventData/Data[@Name='TargetUserName']='administrator']"|findstr "网络地址"
// 获取进程列表程序路径
wmic process get CSName,Description,ExecutablePath,ProcessId
// 获取服务列表详细信息
wmic service get Caption,Name,PathName,ServiceType,Started,StartMode,StartName
//Linux
unset HISTFILE && export HISTFILE=/dev/null
//网络连接
netstat -anlp
//进程
lsof 列出活跃进程的所有打开文件
lsof -i:1677 查看指定端口对应的程序
lsof -p 1234 检查pid号为1234进程调用情况
strace -f -p 1234 跟踪分析pid号为1234的进程
lsof -g gid 找对应进程关联的lib文件
ps -aux或ps -ef
pstree -a 显示该行程的完整指令及参数
pstree -apnh 显示进程间的关系
ps -ef | awk '{print}' | sort -n | uniq >1 ls /proc | sort -n |uniq >2 diff 1 2 隐藏进程查看
top
ls -l /proc/$PID/exe 或 file /proc/$PID/exe($PID 为对应的 pid 号) 查看下 pid 所对应的进程文件路径
ps -p pid -o lstart 查看进程的启动时间
//账户
who 查看当前登录用户(tty 本地登陆 pts 远程登录)
w 查看系统信息,想知道某一时刻用户的行为
uptime 查看登陆多久、多少用户,负载状态
last 登录日志
/etc/shadow 密码登陆相关信息
/etc/sudoers sudo用户列表
awk -F: '{if($3==0)print $1}' /etc/passwd 查看UID为0的帐号
lastlog 系统中所有用户最近一次登录信息
lastb 用户错误的登录列表
users 打印当前登录的用户,每个用户名对应一个登录会话。如果一个用户不止一个登录会话,其用户名显示相同次数
more /etc/sudoers | grep -v "#|$" | grep "ALL=(ALL)" 除 root 帐号外,其他帐号是否存在 sudo 权限。
date -d "1970-01-01 15775 days" 计算shadow中的天数
//自启动
~/.bashrc 加入程序启动语句,打开终端时自启动
rc.local
/etc/init.d
chkconfig
chkconfig --list | grep "3:on|5:on"
/etc/init.d/rc.local
/etc/rc.local
/etc/init.d/ 开机启动项
/etc/cron* 定时任务
/etc/profile
/etc/bashrc
~/.bash_profile
~/.bash_logout
/etc/rc.d/目录下文件,当我们需要开机启动自己的脚本时,只需要将可执行脚本丢在 /etc/init.d 目录下,然后在 /etc/rc.d/rc*.d 文件中建立软链接即可
//查看定时任务
crontab -l
crontab /etc/cron*
crontab -u root -l
cat /etc/crontab
ls /etc/cron.*
/var/spool/cron/*
/etc/crontab
/etc/cron.d/*
/etc/cron.daily/*
/etc/cron.hourly/*
/etc/cron.monthly/*
/etc/cron.weekly/
/etc/anacrontab
/var/spool/anacron/*
/var/log/cron*
//服务
chkconfig --list 查看服务自启动状态,可以看到所有的RPM包安装的服务
chkconfig --list | grep "3:开|5:开" 系统在3与5级别下的启动项
chkconfig --list | grep "3:on|5:on" 系统在3与5级别下的启动项
检查目录/etc/rc.d/init.d/是否存在可疑文件
service --status-all
systemctl list-units --type service
//SSH后门
查看$HOME/.ssh/authorized_keys是否被写入公钥;
分析sshd文件是否存在后门,文件是否被替换,主要看文件中是否存在ip,是否存在记录账号密码等。可用strace分析进程。
分析是否存在ssh转发。
//历史命令
通过 .bash_history 查看帐号执行过的系统命令, 打开 /home 各帐号目录下的 .bash_history,查看普通帐号的历史命令。历史记录可被删除和不记录,如发现被删除可疑通过分析内存尝试查找历史命令。
//文件
查找当前目录近一天内修改的文件
find . -type f -mtime 1
查找当前目录指定时间修改的文件
find ./ -print | ls -alR --time-style '+%Y/%m/%d %H:%M:%S' | grep 2020/09/16
//敏感目录
查看敏感目录,如/tmp目录下的文件,同时注意隐藏文件夹,以“..”为名的文件夹具有隐藏属性。
/var/spool/cron/*
/etc/crontab
/etc/cron.d/*
/etc/cron.daily/*
/etc/cron.hourly/*
/etc/cron.monthly/*
/etc/cron.weekly/
/etc/anacrontab
/var/spool/anacron/*
/tmp
/var/tmp
/root/及相应用户目录
/etc/rc.d/
/etc/init.d/
//iptables和firewalld
iptables -nvL
//环境变量
echo $LD_PRELOAD
env
set
export
cat /proc/$PID/environ
profile
bashrc
bash_profile
//日志
/var/log/wtmp 登录进入,退出,数据交换、关机和重启纪录,即last
/var/log/lastlog 文件记录用户最后登录的信息,即lastlog
/var/log/secure CentOS系统安全日志,记录了登录详细信息
/var/log/cron 与定时任务相关的日志信息
/var/log/apache2/access.log apache access log
/var/log/message 包括整体系统信息
/var/log/auth.log Ubuntu系统安全日志,记录了登录详细信息
/var/log/userlog 记录所有等级用户信息的日志
/var/log/xferlog(vsftpd.log)记录Linux FTP日志
History(/root/.bash_history)历史命令记录
Vim日志(/root/.viminfo)Vim命令记录
部分分析方法如下:
查看爆破失败的IP:
grep 'Failed' /var/log/secure | awk '{print $11}' | sort | uniq -c | sort -nr
查看登录成功的IP:
grep 'Accepted' /var/log/secure | awk '{print $11}' | sort | uniq -c | sort -nr
定位有多少IP在爆破主机的root帐号:
grep "Failed password for root" /var/log/auth.log | awk '{print $11}' | sort | uniq -c | sort -nr | more
grep "Failed password for root" ./secure* | awk '{print $11}' | sort | uniq -c | sort -nr | more
登录成功的IP:
grep "Accepted " /var/log/auth.log | awk '{print $11}' | sort | uniq -c | sort -nr | more
查看登录成功的日期、用户名及IP:
grep "Accepted " /var/log/secure* | awk '{print $1,$2,$3,$9,$11}'
查看爆破用户名字典:
grep "Failed password" /var/log/secure | awk {'print $9'} | sort | uniq -c | sort -nr
//中间件/服务器日志默认位置
IIS
C:\WINDOWS\system32\LogFiles
apache
Linux:/usr/local/apache/logs/ Windows:apache/logs/
tomcat
conf/logging.properties
logs/catalina.xx.log logs/host-manager.xx.log logs/localhost.xx.log logs/manager.xx.log 主要记录系统启、关闭日志、管理日志和异常信息。
weblogic
domain_name/servers/server_name/logs/ server_name.log:server启停日志 access.log:安装在该server之上的应用http访问日志。
jboss
LOG4J配置默认Deploy/conf/ 如jboss/server/default/conf/jboss-log4j.xml。
//webshell
整站打包用webshell扫描工具扫
find /var/www/ -name ".php" |xargs egrep 'assert|phpspy|c99sh|milw0rm|eval|(gunerpress|(base64_decoolcode|spider_bc|shell_exec|passthru|($_\POST[|eval (str_rot13|.chr(|${"_P|eval($_R|file_put_contents(.$_|base64_decode'
grep -i –r eval($_post /app/website/*
find /app/website/ -type f|xargs grep eval($_post
可疑时间修改的文件,与其他文件的时间不一致。
可疑文件名
//mysql日志
错误日志:默认开启,hostname.err
查询日志:记录用户的所有操作。默认关闭,general_log_file(常见getshell手法)
慢查询日志:记录执行时间超过指定时间的查询语句,slow_query_log_file(慢查询getshell)
事务日志:ib_logfile0
二进制日志:记录修改数据或有可能引起数据改变的mysql语句,log_bin,默认在数据目录,如mysql-bin.000001
//mssql日志
exec xp_readerrorlog
object Explorer-Management-SQL Server logs-view-logs
SQL Server 2008: R2\MSSQL10_50.MSSQLSERVER\MSSQL\Log\ERRORLOG
//数据库其他
mysql\lib\plugin目录的异常文件
select * from mysql.func的异常
mssql检查xp_cmdshell等存储过程
异常数据库登录
数据库用户弱口令
制作镜像流程(严谨细致不要打错命令)
1、插入硬盘fdisk -l(这是我的硬盘,根据大小就可以分辨)
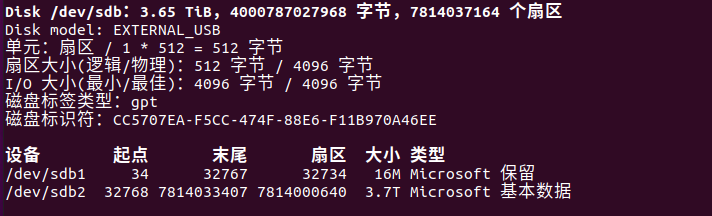
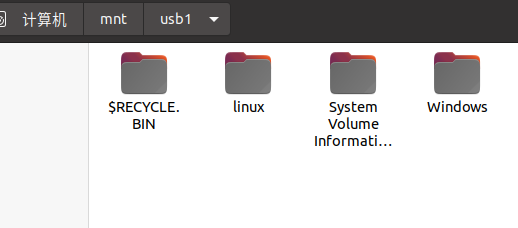
2、挂载硬盘
mount /dev/sdb2 /mnt/usb1(看看自己创建的文件夹如果有硬盘的内容的话就是挂载成功了)
如果没有挂载成功fuser -m -u /dev/sdb2,看看哪个程序在占用kill掉就可以挂载了。
3、dd
dd if=/dev/sda of=/mnt/usb1/123.dd(这里面填写自己命名的dd文件名字就可以了)

4、等待创建完成卸载磁盘umount /dev/sdb2

 浙公网安备 33010602011771号