

Amcharts 柱状图和线形图
最近需要学习 Amcharts ,他的图表功能确实很强大。但是网上搜索到的教程很少,开始学起的确有点不方便。于是我决定把我学习的觉得好的途径,放到博客上。
下面的代码可以直接复制,但是文件要从官网上下载下来。官网地址:www.amcharts.com

<html>
  <head>
    <title>My JSP 'index.jsp' starting page</title>

    <!-- 导入Amcharts js 库 -->
    <script src="amcharts/amcharts.js" type="text/javascript"></script>
    <script type="text/javascript">

        var fun1 = function(){
            var chartData = [{ country: "USA", visits: 4252 },
                    { country: "China", visits: 1882 },
                    { country: "Japan", visits: 1809 },
                    { country: "Germany", visits: 1322 },
                    { country: "UK", visits: 1122 },
                    { country: "France", visits: 1114 },
                    { country: "India", visits: 984 },
                    { country: "Spain", visits: 711 },
                    { country: "Netherlands", visits: 665 },
                    { country: "Russia", visits: 580 },
                    { country: "South Korea", visits: 443 },
                    { country: "Canada", visits: 441 },
                    { country: "Brazil", visits: 395 },
                    { country: "Italy", visits: 386 },
                    { country: "Australia", visits: 384 },
                    { country: "Taiwan", visits: 338 },
                    { country: "Poland", visits: 328}];

            //AmSerialChart 类
            var chart = new AmCharts.AmSerialChart();
            chart.dataProvider = chartData;     //指定数据源
            chart.categoryField = "country";    //数据的分类

            //创建
            var graph = new AmCharts.AmGraph();
            graph.valueField = "visits";    //数值字段名称
            graph.type = "column";          //列名称
            chart.addGraph(graph);

            chart.write(document.getElementById("chartContainer")); //write 到 div 中
        }
    </script>
  </head>

  <body onload="fun1()">
    <div id="chartContainer" style="width: 640px; height: 400px;"></div>
  </body>
</html
上面代码执行后的效果图如下: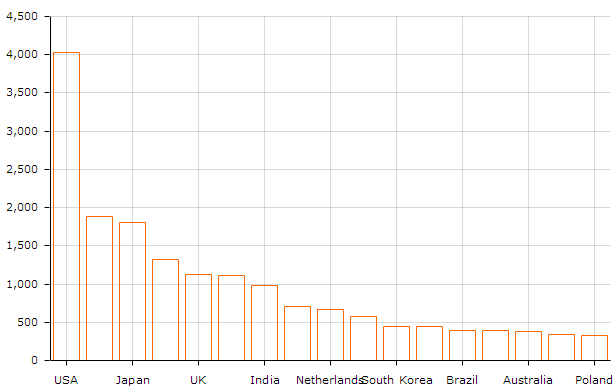
下面继续添加代码优化显示效果,注意下面的代码要放到
chart.write(document.getElementById("chartContainer")); 上面执行。
var categoryAxis = chart.categoryAxis;
categoryAxis.autoGridCount  = false;//设置为false,否则gridount属性会被忽略。
categoryAxis.gridCount = chartData.length;
categoryAxis.gridPosition = "start";
categoryAxis.labelRotation = 90;//图形下面的文字旋转90度。
效果图:

下面填充3D:
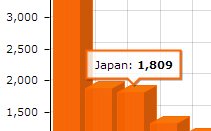
graph.fillAlphas = 0.8;//填充柱形图的颜色
chart.angle = 30;
chart.depth3D = 15;//控制列的深度和角度
graph.balloonText = "[[category]]: <b>[[value]]</b>";//在数值前面加上国家名
效果图:
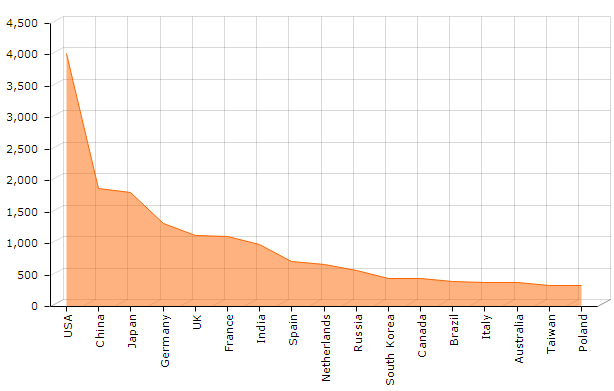
制作面积图
graph.type = "line";
graph.fillAlphas = 0.5;
效果图:
带有项目符号的折线图
graph.fillAlphas = 0; // 或者删除这一行, 因为0是默认值
graph.bullet = "round";
graph.lineColor = "#8d1cc6";
效果图


 浙公网安备 33010602011771号