


jmeter+influxdb+grafana性能测试监控
背景:
话说Jmeter原生的监控确实太丑了,听大佬们在讨论Jmeter+InfluxDb+Grafana的监控,于是,为了有一个漂亮的测试报告,就手动开始进行部署。
安装步骤:
1、influxdb下载安装:
[root@localhost ~]# wget https://dl.influxdata.com/influxdb/releases/influxdb-1.7.0.x86_64.rpm --no-check-certificate
[root@localhost ~]# rpm -ivh influxdb-1.7.0.x86_64.rpm
(如果未安装wget,需要先安装,安装命令:[root@localhost ~]# yum search wget、[root@localhost ~]# yum install wget.x86_64,安装rpm命令:(ubuntu系统:apt-get install rpm))
安装完之后,配置文件路径为: /etc/influxdb/influxdb.conf
修改配置文件:
[root@localhost ~]# vi /etc/influxdb/influxdb.conf
在配置文件中找到graphite配置项
[meta]
# Where the metadata/raft database is stored
# 存放最终存储的数据,文件以.tsm
dir = "/usr/local/influxdb/meta"
[data]
# The directory where the TSM storage engine stores TSM files.
# 存放数据库的源数据wal
dir = "/usr/local/influxdb/data"
# The directory where the TSM storage engine stores WAL files.
# 存放预写日志文件
wal-dir = "/var/lib/influxdb/wal"
[[graphite]]
# Determines whether the graphite endpoint is enabled.
enabled = true
database = "jmeter"    # 数据库名称
retention-policy = ""
bind-address = ":2003"    # 端口
protocol = "tcp"
consistency-level = "one"
修改HTTP端口信息
[http]
# Determines whether HTTP endpoint is enabled.
enabled = true

# The bind address used by the HTTP service.
bind-address = ":8086"
启动influxd服务:
[root@localhost ~]# influxd &
influxDB的tcp端口:8088
查看端口有没有起来:
[root@localhost ~]# netstat -anp|grep 8088
influxDB数据库操作:
[root@jmeter ~]# influx    # 登录数据库
Connected to http://localhost:8086 version 1.6.0
InfluxDB shell version: 1.6.0
> show databases    # 查看数据库
name: databases
name
----
_internal
jmeter
> create database "jmeter"    # 创建数据库
> use jmeter    #切换数据库
Using database jmeter
> create user "admin" with password '123456' with all privileges    # 创建管理员权限的用户
开启需要用到的接口:
[root@localhost ~]# firewall-cmd --zone=public --add-port=8086/tcp --permanent
success
[root@localhost ~]# firewall-cmd --zone=public --add-port=2003/tcp --permanent
success
[root@localhost ~]# firewall-cmd --zone=public --add-port=8088/tcp --permanent
success
[root@localhost ~]# firewall-cmd --reload
success
2、Jmeter配置
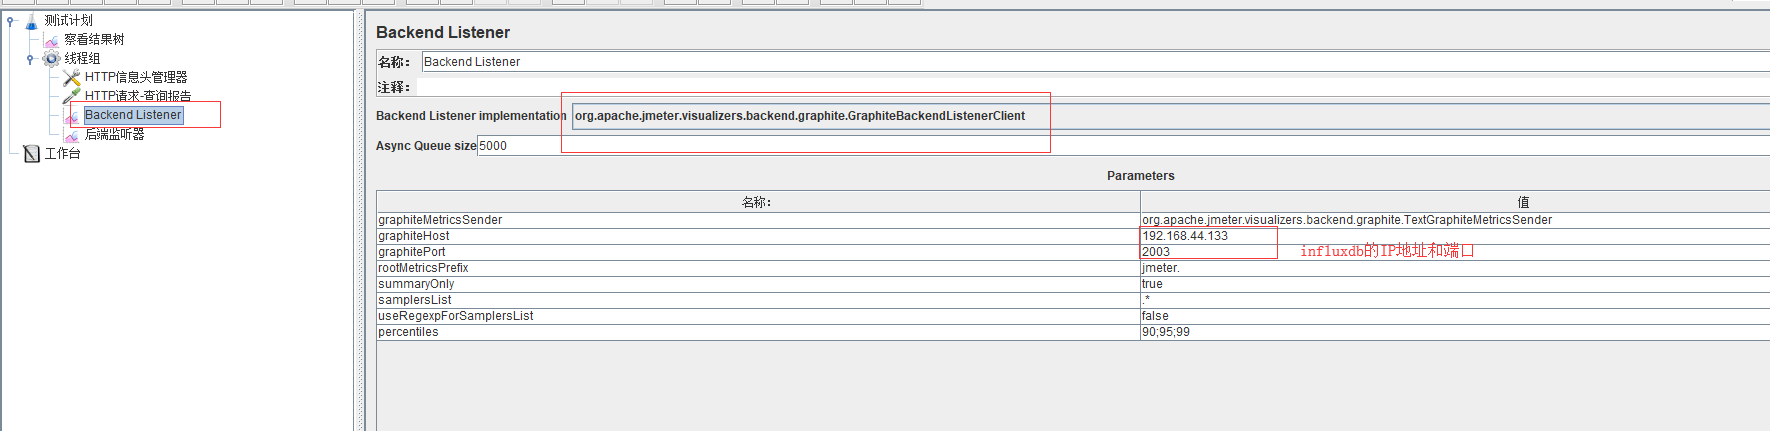
创建一个测试计划,并添加监听器-Backend Listenter,Backend Listener implementation 选择org.apache.jmeter.visualizers.backend.graphite.GraphiteBackendListenerClient
添加线程
设置influxDB IP及端口
运行测试,等待几秒看数据
端口说明:
2003端口:Jmeter往数据库发数据的端口
8086端口,Grafana从数据库取数据的端口
查看Jmeter数据库的表信息:
[root@jmeter ~]# influx
Connected to http://localhost:8086 version 1.6.0
InfluxDB shell version: 1.6.0
> show measurements
ERR: database name required
Warning: It is possible this error is due to not setting a database.
Please set a database with the command "use <database>".
> show databases
name: databases
name
----
_internal
jmeter
> use jmeter
Using database jmeter
> show measurements
name: measurements
name
----
jmeter.all.a.avg
jmeter.all.a.count
jmeter.all.a.max
jmeter.all.a.min
jmeter.all.a.pct90
jmeter.all.a.pct95
jmeter.all.a.pct99
jmeter.all.h.count
jmeter.all.ko.avg
jmeter.all.ko.count
jmeter.all.ko.max
jmeter.all.ko.min
jmeter.all.ko.pct90
jmeter.all.ko.pct95
jmeter.all.ko.pct99
jmeter.all.ok.avg
jmeter.all.ok.count
jmeter.all.ok.max
jmeter.all.ok.min
jmeter.all.ok.pct90
jmeter.all.ok.pct95
jmeter.all.ok.pct99
jmeter.all.rb.bytes
jmeter.all.sb.bytes
jmeter.test.endedT
jmeter.test.maxAT
jmeter.test.meanAT
jmeter.test.minAT
jmeter.test.startedT
这个时候已经可以将统计数据成功发送到InfluxDB
补充:
可以将JMeter-InfluxDB-Writer-plugin-1.2.jar放到jmeter的lib\ext目录下,这时可以选择:
3、Grafana和influxDB数据源配置
安装Grafana:
官网:https://grafana.com/grafana/download
下载地址:https://s3-us-west-2.amazonaws.com/grafana-releases/release/grafana-5.2.1-1.x86_64.rpm
安装:rpm -ivh grafana-5.2.1-1.x86_64.rpm
(如果提示:
警告:grafana-5.2.1-1.x86_64.rpm: 头V4 RSA/SHA1 Signature, 密钥 ID 24098cb6: NOKEY
错误:依赖检测失败:
fontconfig 被 grafana-5.2.1-1.x86_64 需要
urw-fonts 被 grafana-5.2.1-1.x86_64 需要
执行命令:[root@localhost ~]# yum install fontconfig freetype* urw-fonts -y
后,再进行安装
)
启动
[root@jmeter ~]# service grafana-server start
Starting Grafana Server: ... [ OK ]
开启3000访问端口:
[root@bogon benben]# firewall-cmd --zone=public --add-port=3000/tcp --permanent
success
[root@bogon benben]# firewall-cmd --reload
success
浏览器访问:http://IP:3000/login
grafana的默认用户名密码都是admin,第一次登录会要求更改密码

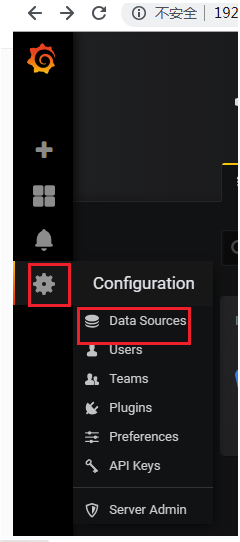
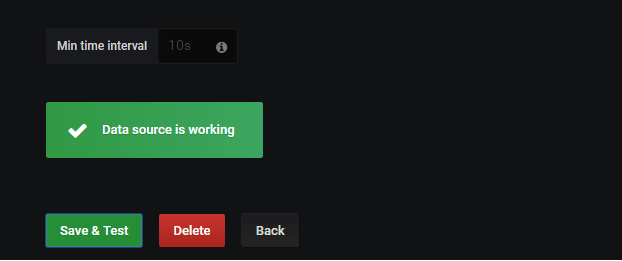
创建influxDB数据源

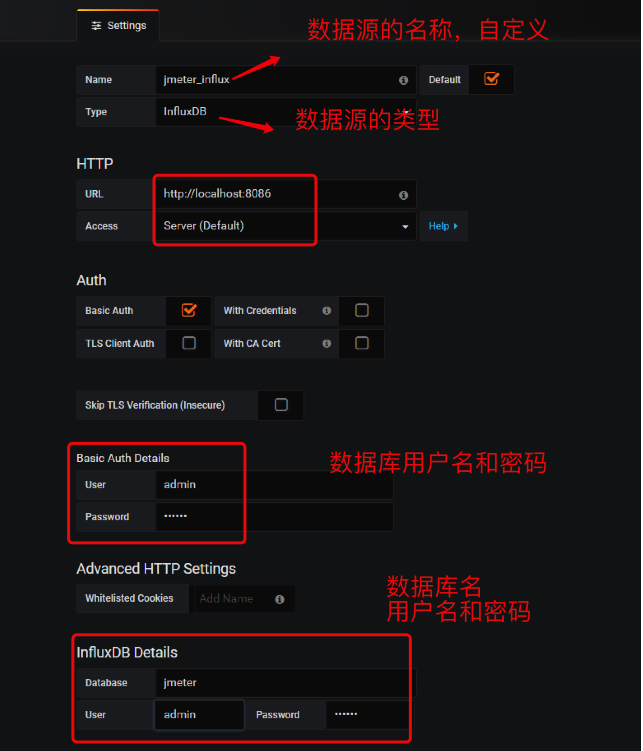
单击save & Test,提示:data source is working,说明保存和连接成功
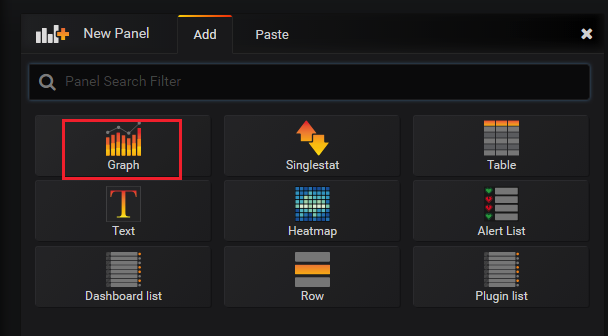
创建dashboard

新建Graph面板
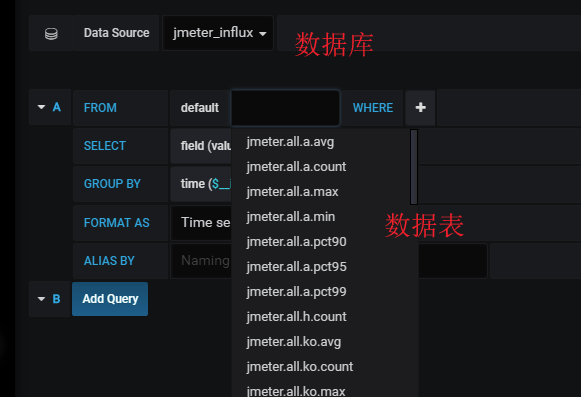
数据绑定

选择influxdb的数据源库名,jmeter的相关表
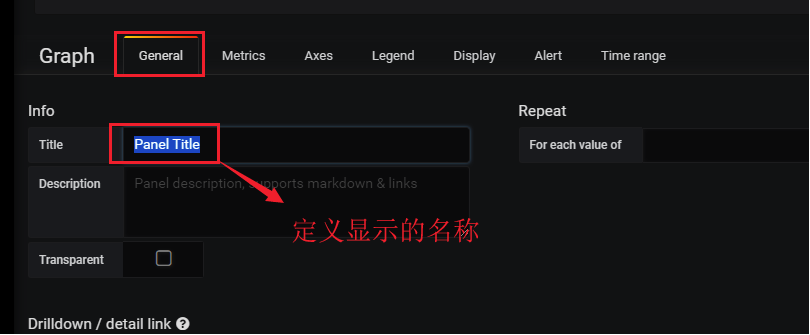
定义显示的名称
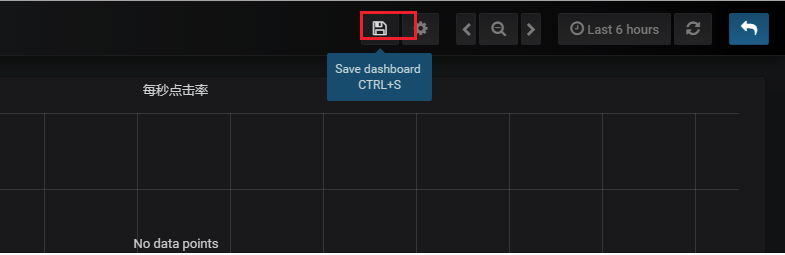
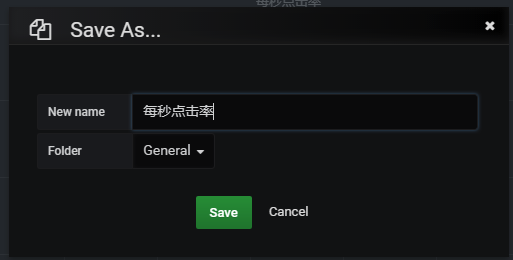
保存数据模板
直接按ctrl+s或点击保存按钮
说明:想要了解这些监控都代表什么意思,可以访问Jmeter的官网地址去查看阅读“http://jmeter.apache.org/usermanual/realtime-results.html”
线程数/用户相关指标
test.minAT-Min active threads:最小活跃线程数
test.maxAT-Max active threads:最大活跃线程数
test.meanAT-Mean active threads:活跃线程数
test.startedT-Started threads:启动线程数
test.endedT-Finished threads:结束线程数
响应时间指标
.ok.count:采样器的成功响应数
.h.count:每秒点击数
.ok.min:采样器成功最短响应时间
.ok.max:采样器成功最长响应时间
.ok.avg:采样器成功平均响应时间
.ok.pct:采样器成功响应百分比
.ko.count:采样器失败响应数
.ko.min:采样器失败的响应最短时间
.ko.max:采样称失败最长响应时间
.ko.avg:采样器失败平均响应时间
.ko.pct:采样器失败响应百分比
.a.count:采样器响应数(ok.count和ko.count的总和)
.a.min:采样器最小响应时间(ok.count和ko.count的最小值)
.a.max:采样器最大响应时间(ok.count和ko.count的最大值)
.a.avg:采样器平均响应时间(ok.count和ko.count的平均值)
.a.pct:采样器响应百分比(根据和失败样本的总数计算)
Backend Listener的默认百分位设置为“90;95;99”,即百分位数为90%,95%和99%。
Graphite使用点(“.”)去拆分的元素,这可能与十进制百分位值混淆。JMeter转换任何此类值,用下划线(“ - ”)替换点(“.”)。例如,“99.9 ”变为“99_9 ”
默认情况下,JMeter发送在samplerName“all”下累计的所有采样器的指标。 如果配置了 BackendListenerSamplersList,那么JMeter还会发送匹配样本名称的指标,前提是配置 summaryOnly=true
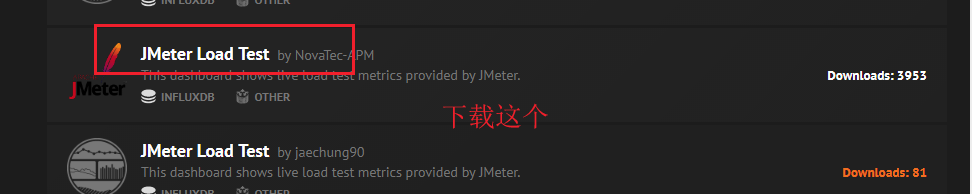
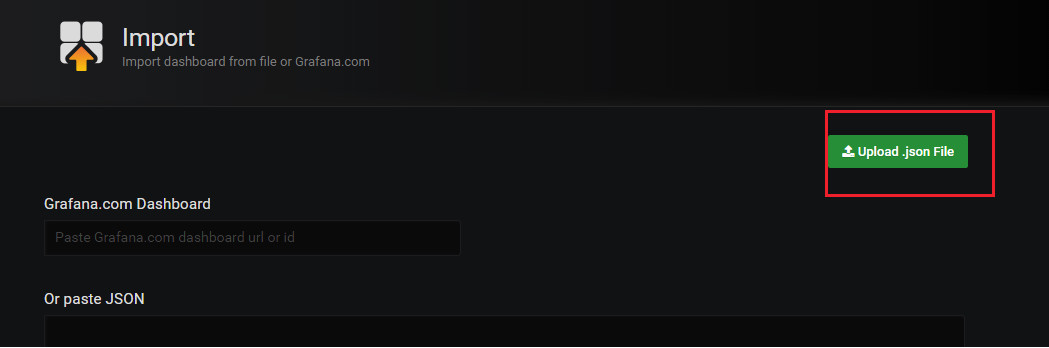
导入Dashboard模版
从Grafana官网下载相应的模板
官网模版库:https://grafana.com/dashboards
搜索看板模版

下载:jmeter load test

下载的jar包复制到jmeter的/lib/ext下面
导入模板
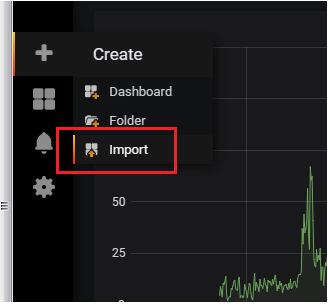
加载模板文件,将下载的json文件打开,将源码复制粘贴到第二个框中
选择模板数据源
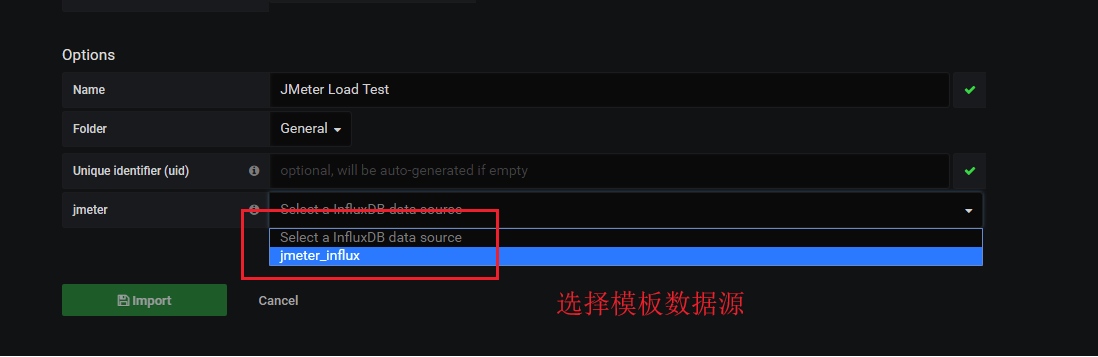
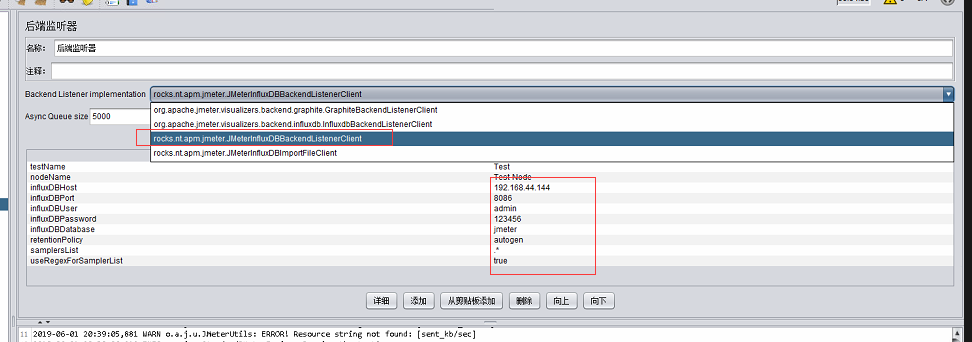
重启jmeter,再添加一个后置处理器-Backend Listener,选择rocks.nt.apm.jmeter.JMeterinfluxDBBackendListenerClient,输入influxDB的host和端口,之前创建用户名和密码 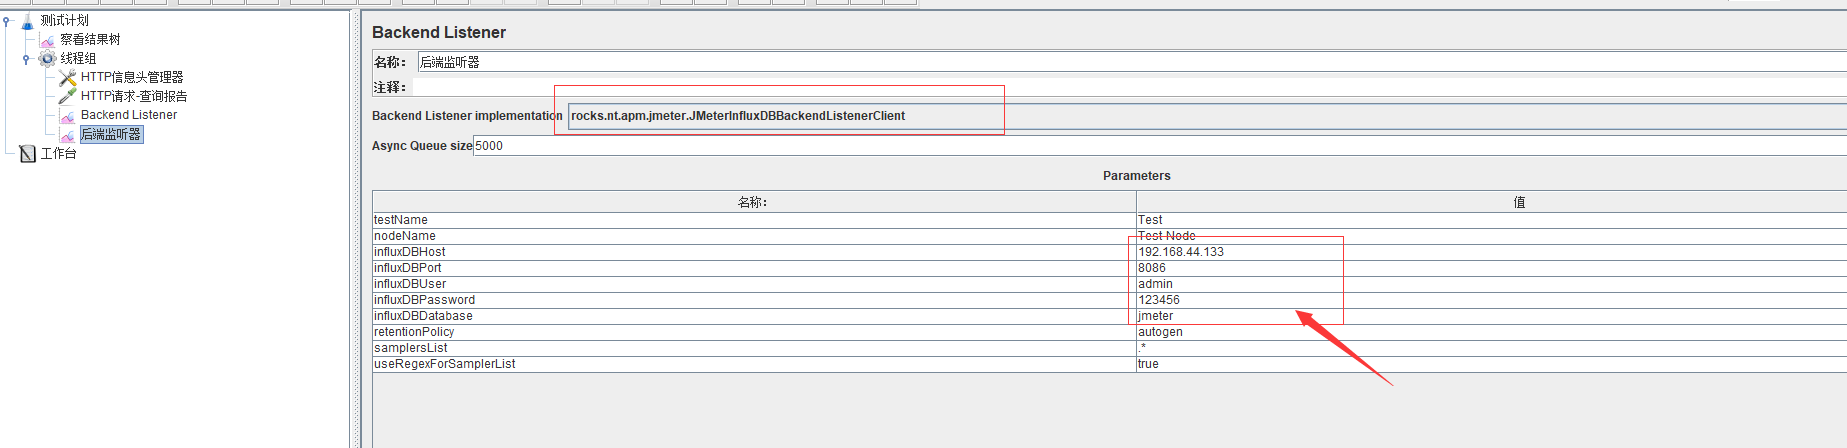
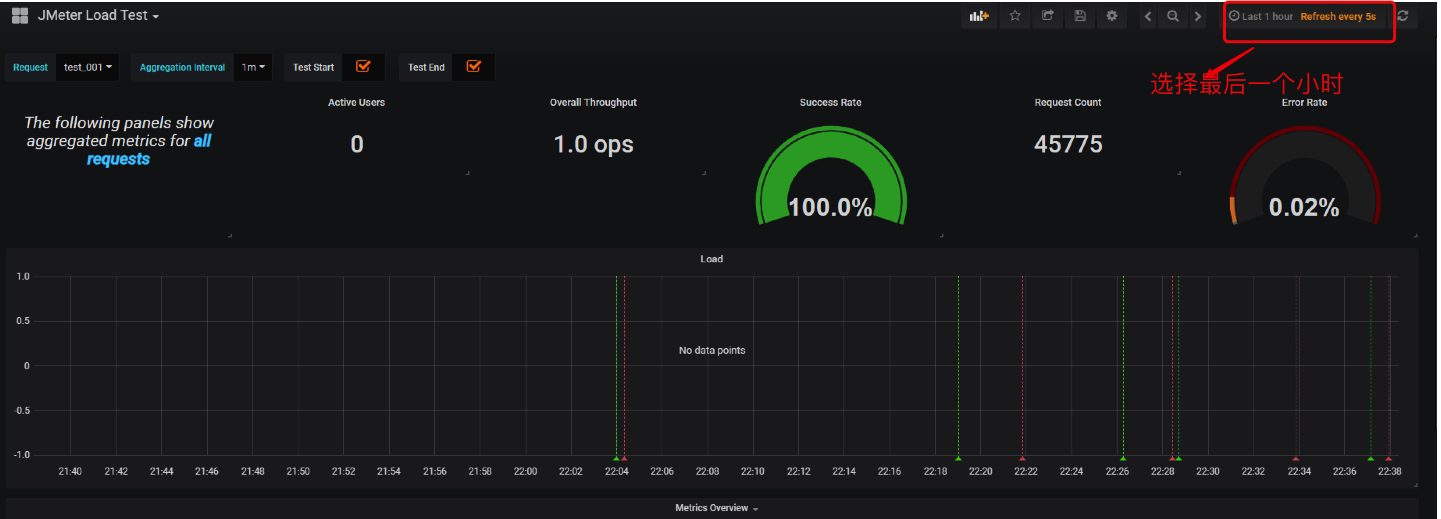
压测的效果图
==============================================================================================================================================================================
以上为centos系统上的安装方法,以下为ubuntu系统的安装方法:
1、Influxdb下载和安装:
wget https://dl.influxdata.com/influxdb/releases/influxdb_1.2.4_amd64.deb (如果在线下载慢,可以先下载到本机,再上传到centos系统)

sudo dpkg -i influxdb_1.2.4_amd64.deb
2、Grafana下载和安装:
wget https://s3-us-west-2.amazonaws.com/grafana-releases/release/grafana_5.1.3_amd64.deb   (如果在线下载慢,可以先下载到本机,再上传到centos系统)
sudo apt-get install -y adduser libfontconfig
sudo dpkg -i grafana_5.1.3_amd64.deb
启动服务:
sudo service grafana-server start
图片和操作步骤转自https://www.cnblogs.com/mike-liu/p/10080351.html博客,感谢!

 浙公网安备 33010602011771号