
斯坦福CS231n课程作业# 1(代码笔记1)
k-Nearest Neighbor (kNN) exercise


 1 # Run some setup code for this notebook.
 2
 3 import random
 4 import numpy as np
 5 from cs231n.data_utils import load_CIFAR10
 6 import matplotlib.pyplot as plt
 7
 8 # This is a bit of magic to make matplotlib figures appear inline in the notebook
 9 # rather than in a new window.
10 %matplotlib inline
11 plt.rcParams['figure.figsize'] = (10.0, 8.0) # set default size of plots
12 plt.rcParams['image.interpolation'] = 'nearest'
13 plt.rcParams['image.cmap'] = 'gray'
14
15 # Some more magic so that the notebook will reload external python modules;
16 # see http://stackoverflow.com/questions/1907993/autoreload-of-modules-in-ipython
17 %load_ext autoreload
18 %autoreload 2
 1 # Load the raw CIFAR-10 data.
 2 cifar10_dir = 'cs231n/datasets/cifar-10-batches-py'
 3
 4 # Cleaning up variables to prevent loading data multiple times (which may cause memory issue)
 5 try:
 6    del X_train, y_train
 7    del X_test, y_test
 8    print('Clear previously loaded data.')
 9 except:
10    pass
11
12 X_train, y_train, X_test, y_test = load_CIFAR10(cifar10_dir)
13
14 # As a sanity check, we print out the size of the training and test data.
15 print('Training data shape: ', X_train.shape)
16 print('Training labels shape: ', y_train.shape)
17 print('Test data shape: ', X_test.shape)
18 print('Test labels shape: ', y_test.shape)
 1 # Visualize some examples from the dataset.
 2 # We show a few examples of training images from each class.
 3 classes = ['plane', 'car', 'bird', 'cat', 'deer', 'dog', 'frog', 'horse', 'ship', 'truck']
 4 num_classes = len(classes)#类别数目
 5 samples_per_class = 7 # 每个类别采样个数
 6 #enumerate() 函数用于将一个可遍历的数据对象(如列表、元组或字符串)组合为一个索引序列,同时列出数据和数据下标,一般用在 for 循环当中。
 7 for y, cls in enumerate(classes):
 8     #输入一个矩阵,返回了其中非零元素的位置.找出标签中y类的位置
 9     idxs = np.flatnonzero(y_train == y)
10
11     '''choice(a, size=None, replace=True, p=None)表示从a中随机选取size个数,
12     replacement 代表的意思是抽样之后还放不放回去,如果是False的话,那么通一次挑选出来的数都不一样,
13     如果是True的话, 有可能会出现重复的,因为前面的抽的放回去了。
14     p表示每个元素被抽取的概率,如果没有指定,a中所有元素被选取的概率是相等的。
15     '''
16     idxs = np.random.choice(idxs, samples_per_class, replace=False) #从中选出我们所需的7个样本
17     for i, idx in enumerate(idxs): #对所选的样本的位置和样本所对应的图片在训练集中的位置进行循环
18         plt_idx = i * num_classes + y + 1 # 在子图中所占位置的计算
19         #前两个数表示子图组成的矩阵的行列数,比如有6个子图,排列成3行2列,那就是subplot(3,2,X)。最后一个数表示要画第X个图了。
20         plt.subplot(samples_per_class, num_classes, plt_idx) # 说明要画的子图的编号
21         plt.imshow(X_train[idx].astype('uint8')) # 画图
22         plt.axis('off')
23         if i == 0:
24             plt.title(cls) # 写上标题,也就是类别名
25 plt.show()
 1 # Subsample the data for more efficient code execution in this exercise
 2 num_training = 5000
 3 mask = list(range(num_training))
 4 X_train = X_train[mask]
 5 y_train = y_train[mask]
 6
 7 num_test = 500
 8 mask = list(range(num_test))
 9 X_test = X_test[mask]
10 y_test = y_test[mask]
11 print(X_train.shape, X_test.shape)
12 # Reshape the image data into rows
13 X_train = np.reshape(X_train, (X_train.shape[0], -1))#也可以用X_train.reshape( (X_train.shape[0], -1)),-1代表后面多维数据整合成一个一维数据
14 X_test = np.reshape(X_test, (X_test.shape[0], -1))
15 print(X_train.shape, X_test.shape)
1 from cs231n.classifiers import KNearestNeighbor
2
3 # Create a kNN classifier instance.
4 # Remember that training a kNN classifier is a noop:
5 # the Classifier simply remembers the data and does no further processing
6 classifier = KNearestNeighbor()#创建一个实例
7 classifier.train(X_train, y_train)
We would now like to classify the test data with the kNN classifier. Recall that we can break down this process into two steps:
- First we must compute the distances between all test examples and all train examples.
- Given these distances, for each test example we find the k nearest examples and have them vote for the label
Lets begin with computing the distance matrix between all training and test examples. For example, if there are Ntr training examples and Nte test examples, this stage should result in a Nte x Ntr matrix where each element (i,j) is the distance between the i-th test and j-th train example.
Note: For the three distance computations that we require you to implement in this notebook, you may not use the np.linalg.norm() function that numpy provides.
First, open cs231n/classifiers/k_nearest_neighbor.py and implement the function compute_distances_two_loops that uses a (very inefficient) double loop over all pairs of (test, train) examples and computes the distance matrix one element at a time.
注:np.linalg.norm()功能是求范数
1、linalg=linear(线性)+algebra(代数),norm则表示范数。
2、函数参数
x_norm=np.linalg.norm(x, ord=None, axis=None, keepdims=False)
①x: 表示矩阵(也可以是一维)
②ord:范数类型
向量的范数:
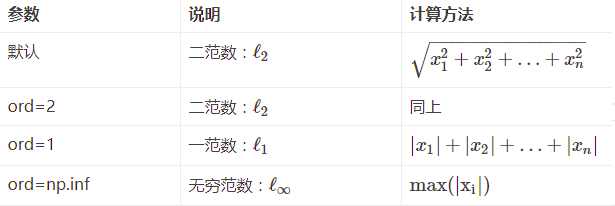
矩阵的范数:
ord=1:列和的最大值
ord=2:|λE-ATA|=0,求特征值,然后求最大特征值得算术平方根
ord=∞:行和的最大值
③axis:处理类型
axis=1表示按行向量处理,求多个行向量的范数
axis=0表示按列向量处理,求多个列向量的范数
axis=None表示矩阵范数。
④keepding:是否保持矩阵的二维特性
True表示保持矩阵的二维特性,False相反
1 # Open cs231n/classifiers/k_nearest_neighbor.py and implement
2 # compute_distances_two_loops.
3
4 # Test your implementation:
5 dists = classifier.compute_distances_two_loops(X_test)
6 print(dists.shape)
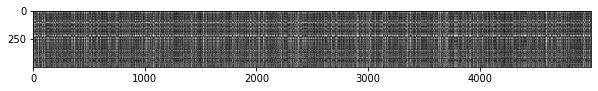
1 # We can visualize the distance matrix: each row is a single test example and
2 # its distances to training examples
3 plt.imshow(dists, interpolation='none')
4 plt.show()
**Inline Question 1**
Notice the structured patterns in the distance matrix, where some rows or columns are visible brighter. (Note that with the default color scheme black indicates low distances while white indicates high distances.)
- What in the data is the cause behind the distinctly bright rows?
- What causes the columns?
$\color{blue}{\textit Your Answer:}$ *fill this in.*
1.Either this is an observation from a class not in the training data set, or is at least very different from all/most of the training data, probably in terms of background color.可能这是一个不在训练集类别里的一张图片,或者至少是跟训练集所有/大多数图片都非常不同的图片
2.This training data point doesn’t have any similar points in the test set.白色的列是因为某张训练图片跟测试集的图片都不相同。
*Difference between two pictures, row = one test image vs 5000 train images, column = one train image vs 500 test images*
以上完成了一个两层循环的方法调用。
调用的方法代码如下:
 1 def compute_distances_two_loops(self, X):
 2         """
 3         Compute the distance between each test point in X and each training point
 4         in self.X_train using a nested loop over both the training data and the
 5         test data.
 6
 7         Inputs:
 8         - X: A numpy array of shape (num_test, D) containing test data.
 9
10         Returns:
11         - dists: A numpy array of shape (num_test, num_train) where dists[i, j]
12           is the Euclidean distance between the ith test point and the jth training
13           point.
14         """
15         num_test = X.shape[0]
16         num_train = self.X_train.shape[0]
17         dists = np.zeros((num_test, num_train))
18         for i in range(num_test):
19             for j in range(num_train):
20                 #####################################################################
21                 # TODO:                                                             #
22                 # Compute the l2 distance between the ith test point and the jth    #
23                 # training point, and store the result in dists[i, j]. You should   #
24                 # not use a loop over dimension, nor use np.linalg.norm().          #
25                 #####################################################################
26                 # *****START OF YOUR CODE (DO NOT DELETE/MODIFY THIS LINE)*****
27                 dists[i][j] = np.sqrt(np.sum((X[i] - self.X_train[j])**2)) #用numpy的矩阵功能
28                 # *****END OF YOUR CODE (DO NOT DELETE/MODIFY THIS LINE)*****
29         return dists

 浙公网安备 33010602011771号