掌握VS2010调试 -- 入门指南
1 导言
在软件开发周期中,测试和修正缺陷(defect,defect与bug的区别:Bug是缺陷的一种表现形式,而一个缺陷是可以引起多种Bug的)的时间远多于写代码的时间。通常,debug是指发现缺陷并改正的过程。修正缺陷紧随debug之后,或者说二者是相关的。如果代码中存在缺陷,我们首先要识别造成缺陷的根本原因(root cause),这个过程就称作调试(debugging)。找到根本原因后,就可以修正缺陷。
那么如何调试代码呢?Visual Studio提供了很多用于调试的工具。有时调试需要花费大量时间去识别root cause。VS提供了许多辅助调试的便捷的工具。调试器(Debugger)包含错误列表、添加断点、可视化的程序流程、控制执行流程、Data Tips、监视窗口(watch windows)、多线程调试、线程窗口、并行调试概览以及IntelliTrace调试概览。我希望本文能够对调试功能的使用者有所裨益。请注意,本文使用VS2010。某些功能在旧版本中也是一致的,但是VS2010新增了许多features(Labeling breakpoint, Pinned DataTip, Multithreaded Debugging, Parallel debugging and IntelliTrace)。
2 如何启动调试?
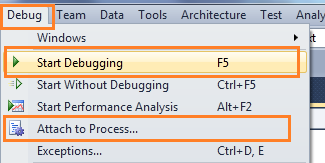
图 启动调试(Start Debugging)
“附加到进程(Attach to Process)”是另一种启动调试的方法。Attach Process会为应用程序启动一个调试会话。可能我们更熟悉ASP.NET Web应用的Attach Process调试。我发了另外两篇相关的帖子。如下:
- Debug Your ASP.NET Application that Hosted on IIS
- Remote IIS Debugging: Debug your ASP.NET Application which is hosted on "Remote IIS Server"
通常我们通过在可能存在问题代码处加断点来启动调试。因此,我们从断点开始讲起。
3 断点(Breakpoints)
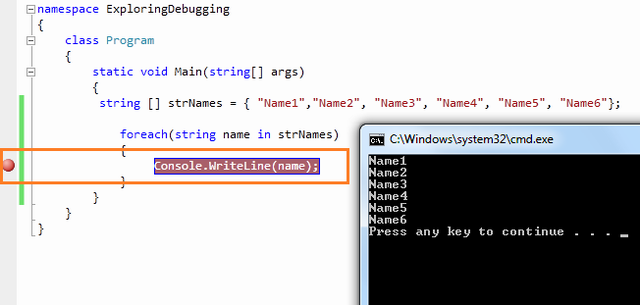
图 设置断点(Set Breakpoint)
3.1 使用断点进行调试
在中断模式下,你有多条可使用的命令,使用相应命令进行进一步的调试。

图 断点工具条(Breakpoint Toolbar)
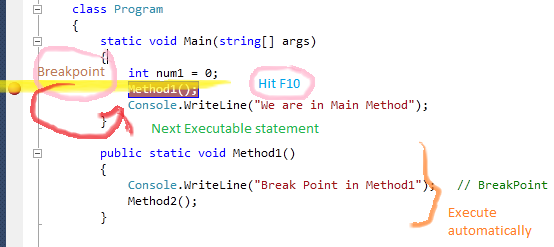
3.1.1 逐过程(Step Over)
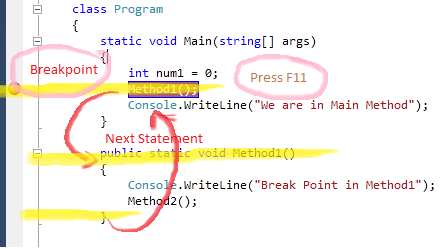
3.1.2 逐语句(Step Into)
3.1.3 跳出(Step Out)
3.1.4 继续(Continue)
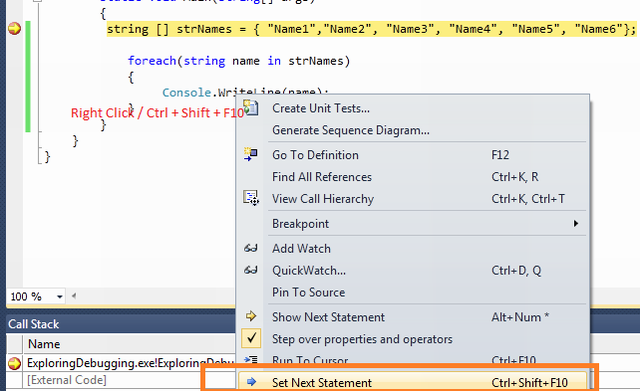
3.1.5 设置下一语句(Set Next Statement)
3.1.6 显示下一语句(Show Next Statement [Ctrl+*])
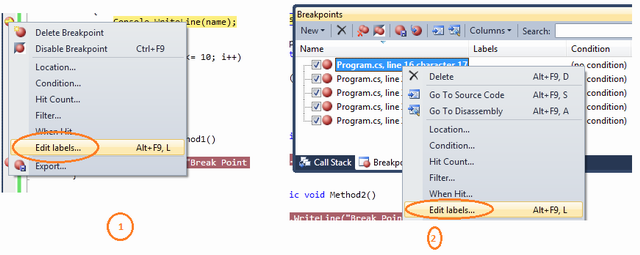
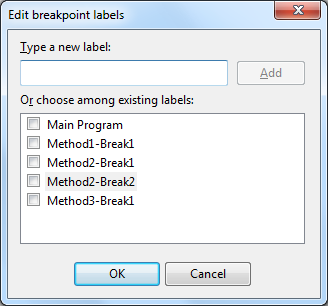
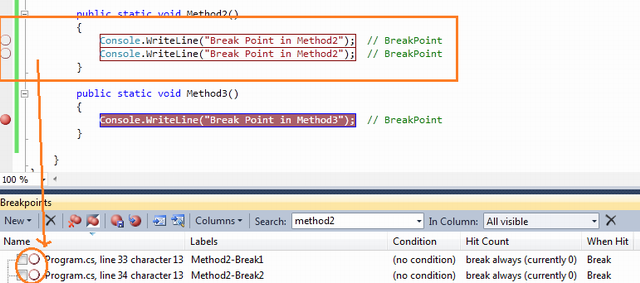
3.2 断点标签(Labeling in Break Point)
-
class Program
-
{
-
static void Main(string[] args)
-
{
-
string[] strNames = { "Name1", "Name2", "Name3", "Name4", "Name5", "Name6" };
-
-
foreach (string name in strNames)
-
{
-
Console.WriteLine(name); // BreakPoint
-
}
-
int temp = 4;
-
for (int i = 1; i <= 10; i++)
-
{
-
if (i > 6)
-
temp = 5;
-
}
-
}
-
-
public static void Method1()
-
{
-
Console.WriteLine("Break Point in Method1"); // BreakPoint
-
}
-
-
public static void Method2()
-
{
-
Console.WriteLine("Break Point in Method2"); // BreakPoint
-
Console.WriteLine("Break Point in Method2"); // BreakPoint
-
}
-
-
public static void Method3()
-
{
-
Console.WriteLine("Break Point in Method3"); // Breakpoint
-
}
-
}
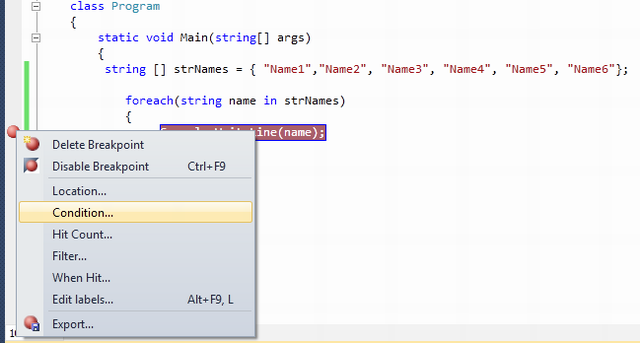
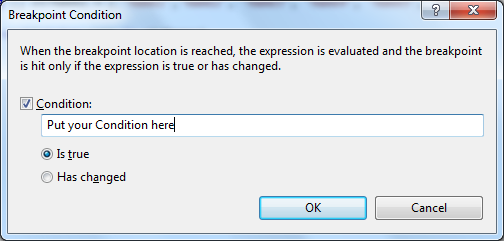
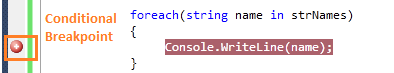
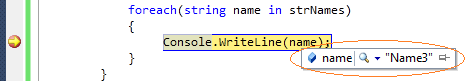
3.3 条件断点(Conditional Breakpoint)
-
class Program
-
{
-
static void Main(string[] args)
-
{
-
string [] strNames = { "Name1","Name2", "Name3", "Name4", "Name5", "Name6"};
-
-
foreach(string name in strNames)
-
{
-
Console.WriteLine(name); // Breakpoint is here
-
}
-
}
-
}
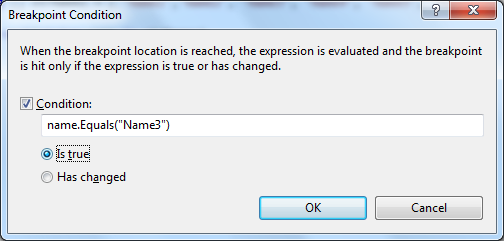
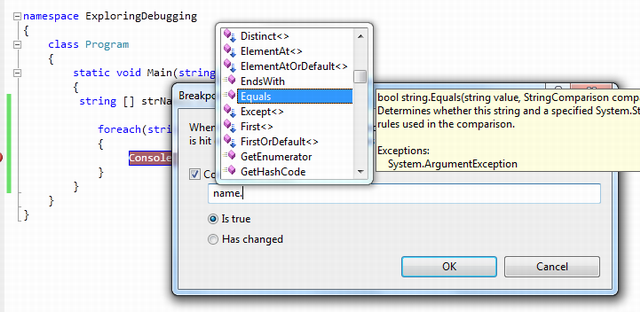
- Is True
- Has Changed
3.4 导入/导出断点(Import / Export Breakpoint)
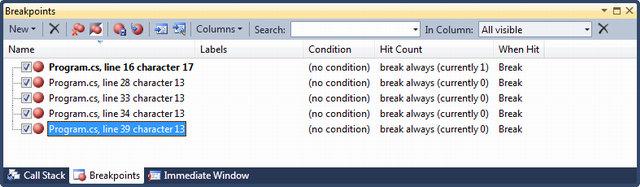
3.5 断点命中计数(Breakpoint Hit Count)
3.6 Breakpoint When Hit
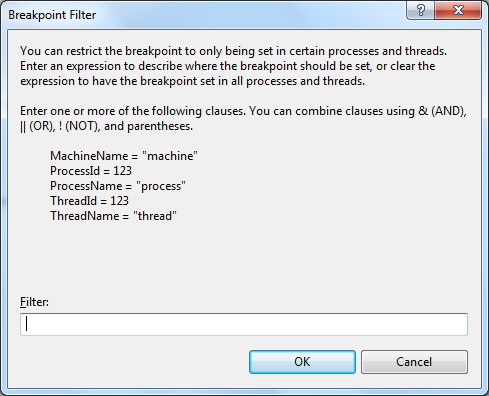
3.7 断点筛选器(Breakpoint Filter)
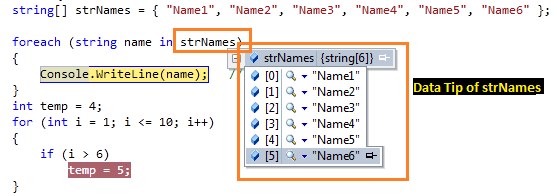
4 数据便签(Data Tip)
4.1 Pin Inspect Value During Debugging
4.2 Drag-Drop Pin Data Tip
4.3 Adding Comments
4.4 Last Session Debugging Value
4.5 Import Export Data Tips
4.6 Change Value Using Data Tips
4.7 Clear Data Tips
5 监视窗口(Watch Windows)
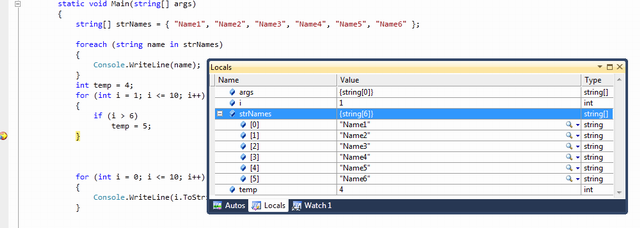
5.1 局部变量(Locals)
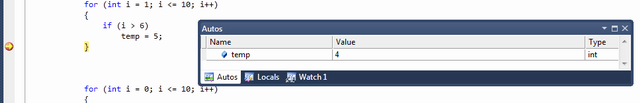
5.2 自动窗口(Autos)
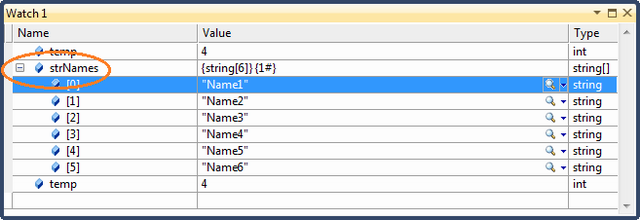
5.3 监视(Watch)
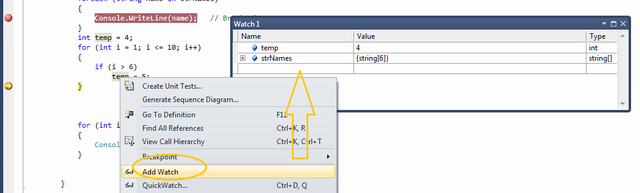
有4个可同时使用的监视窗口。
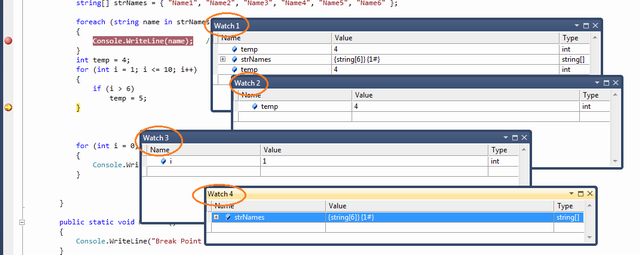
图:多个监视窗口
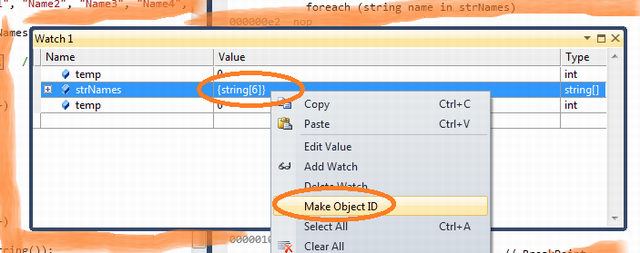
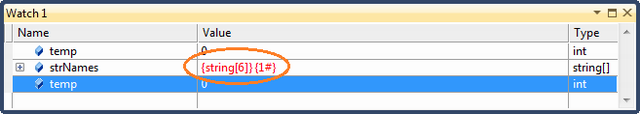
5.3.1 Creating Object ID
5.4
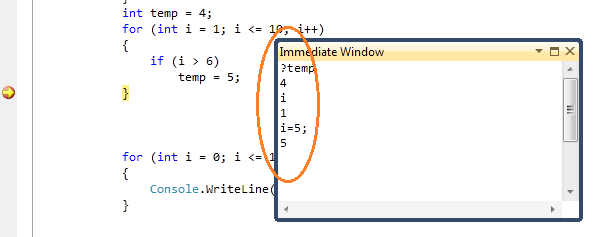
6 即时窗口(Immediate Window)
7 调用堆栈(Call Stack)
8 调试多线程程序(Debugging Multithreaded Program)
8.1 Exploring Threads Window
8.2 Flag Just My Code
8.3 Break Point Filter - Multithread Debugging
9 调试并行程序(Debugging Parallel Program)
9.1 Parallel Task and Parallel Stacks
10 Debugging with IntelliTrace
10.1 Overview
10.2 Mapping with IntelliTrace
10.3 Filter IntelliTrace Data
11 调试常用快捷键(Useful Shortcut Keys For VS Debugging)
| Shortcut Keys | Descriptions |
| Ctrl-Alt-V, A | Displays the Auto window |
| Ctrl-Alt-B | Displays the Breakpoints dialog |
| Ctrl-Alt-C | Displays the Call Stack |
| Ctrl-Shift-F9 | Clears all of the breakpoints in the project |
| Ctrl-F9 | Enables or disables the breakpoint on the current line of code |
| Ctrl-Alt-E | Displays the Exceptions dialog |
| Ctrl-Alt-I | Displays the Immediate window |
| Ctrl-Alt-V, L | Displays the Locals window |
| Ctrl-Alt-Q | Displays the Quick Watch dialog |
| Ctrl-Shift-F5 | Terminates the current debugging session, rebuilds if necessary, and starts a new debugging session. |
| Ctrl-F10 | Starts or resumes execution of your code and then halts execution when it reaches the selected statement. |
| Ctrl-Shift-F10 | Sets the execution point to the line of code you choose |
| Alt-NUM * | Highlights the next statement |
| F5 | If not currently debugging, this runs the startup project or projects and attaches the debugger. |
| Ctrl-F5 | Runs the code without invoking the debugger |
| F11 | Step Into |
| Shift-F11 | Executes the remaining lines out from procedure |
| F10 | Executes the next line of code but does not step into any function calls |
| Shift-F5 | Available in break and run modes, this terminates the debugging session |
| Ctrl-Alt-H | Displays the Threads window to view all of the threads for the current process |
| F9 | Sets or removes a breakpoint at the current line |
| Ctrl-Alt-W, 1 | Displays the Watch 1 window to view the values of variables or watch expressions |
| Ctrl-Alt-P | Displays the Processes dialog, which allows you to attach or detach the debugger to one or more running processes |
| Ctrl-D,V | IntelliTrace Event |
12 深入学习(Further Study)
13 总结(Summary)
“自动窗口”(Autos):当前使用的变量
“局部窗口”(Locals):在范围内的所有变量
“监视N”(Watch):可定制(N从1到4)
Step Into(逐语句):执行并移动到下一条语句(实际上,跳入上一条语句的代码块,此代码块的第一条)
Step Over(逐过程):执行并跳到下一条语句,但不进入上一条语句的代码块
Step Out(跳出):执行到代码块结尾
命令窗口(Command)
即时窗口(Immediate):主要用于计算表达式
参考资料:
[1] Mastering Debugging in Visual Studio 2010 - A Beginner's Guide
[2] bug和缺陷的区别

 浙公网安备 33010602011771号