
Python入门-散点图绘制
Python入门-散点图绘制 废话不说 直接上代码
import matplotlib.pyplot as plt

x_values = list(range(1,1001))
y_values = [x**2 for x in x_values]
plt.scatter(x_values, y_values,c=y_values,cmap=plt.cm.Blues, edgecolor='none', s=40)

#设置图表标题并给坐标轴加上标签
plt.title("Squares numbers", fontsize=24)
plt.xlabel("Value", fontsize=14)
plt.ylabel("Square of value", fontsize=14)

#设置刻度标记的大小
plt.tick_params(axis='both', which='major',labelsize=14)

#设置每个坐标轴的取值范围
plt.axis([0,1100,0,1100000])
#plt.show()
plt.savefig('squares_plot.png', bbox_inches='tight')
结果如下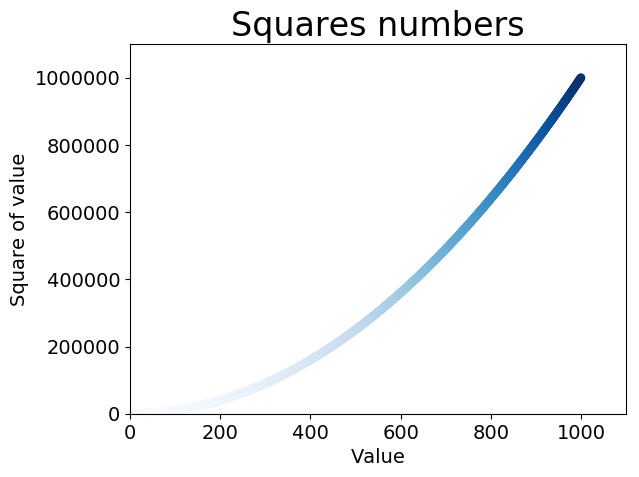

 浙公网安备 33010602011771号