
matlab 利用kmeans实现鸢尾花分类
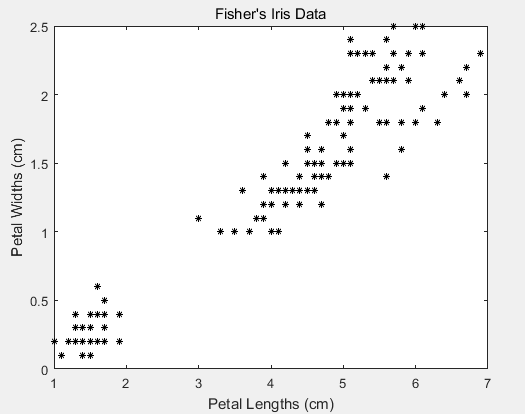
鸢尾花数据
程序:
代码
load fisheriris
X = meas(:,3:4);
figure;
plot(X(:,1),X(:,2),'k*','MarkerSize',5);
title 'Fisher''s Iris Data';
xlabel 'Petal Lengths (cm)';
ylabel 'Petal Widths (cm)';
rng(1); % For reproducibility
%这里kmeans()后面的四二个参数为k值
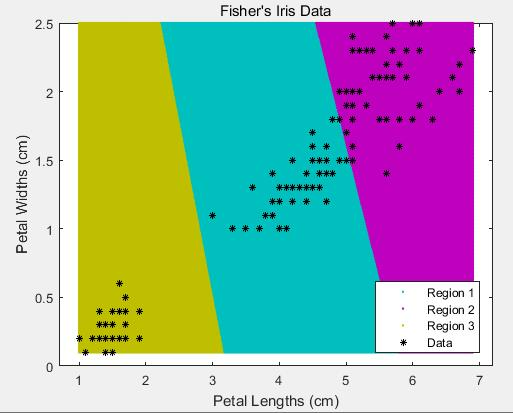
[idx,C] = kmeans(X,3);
x1 = min(X(:,1)):0.01:max(X(:,1));
x2 = min(X(:,2)):0.01:max(X(:,2));
[x1G,x2G] = meshgrid(x1,x2);
XGrid = [x1G(:),x2G(:)]; % Defines a fine grid on the plot
idx2Region = kmeans(XGrid,3,'MaxIter',1,'Start',C);
x1 = min(X(:,1)):0.01:max(X(:,1));
x2 = min(X(:,2)):0.01:max(X(:,2));
[x1G,x2G] = meshgrid(x1,x2);
XGrid = [x1G(:),x2G(:)]; % Defines a fine grid on the plot
idx2Region = kmeans(XGrid,3,'MaxIter',1,'Start',C);
figure;
gscatter(XGrid(:,1),XGrid(:,2),idx2Region,...
[0,0.75,0.75;0.75,0,0.75;0.75,0.75,0],'..');
hold on;
plot(X(:,1),X(:,2),'k*','MarkerSize',5);
title 'Fisher''s Iris Data';
xlabel 'Petal Lengths (cm)';
ylabel 'Petal Widths (cm)';
legend('Region 1','Region 2','Region 3','Data','Location','SouthEast');
hold off;
k=3
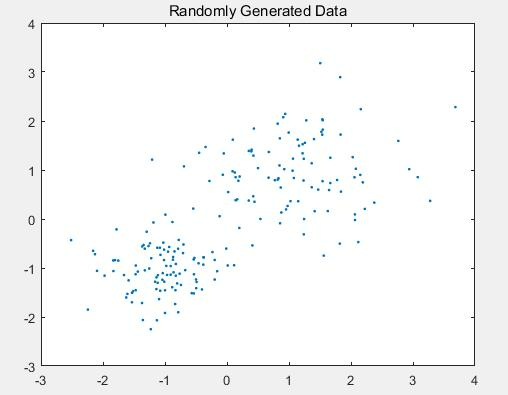
随机生成数据分成两个簇(2 clusters)
程序:
rng default; % For reproducibility
X = [randn(100,2)*0.75+ones(100,2);
randn(100,2)*0.5-ones(100,2)];
figure;
plot(X(:,1),X(:,2),'.');
title 'Randomly Generated Data';
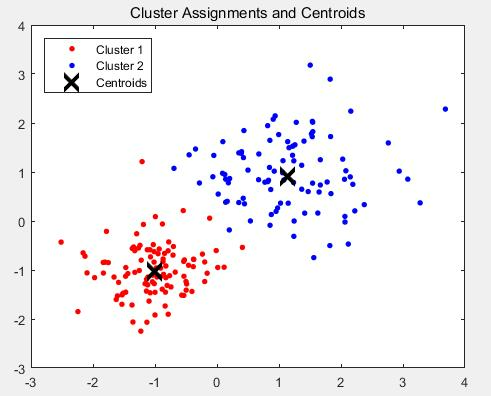
opts = statset('Display','final');
[idx,C] = kmeans(X,2,'Distance','cityblock',...
'Replicates',5,'Options',opts);
figure;
plot(X(idx==1,1),X(idx==1,2),'r.','MarkerSize',12)
hold on
plot(X(idx==2,1),X(idx==2,2),'b.','MarkerSize',12)
plot(C(:,1),C(:,2),'kx',...
'MarkerSize',15,'LineWidth',3)
legend('Cluster 1','Cluster 2','Centroids',...
'Location','NW')
title 'Cluster Assignments and Centroids'
hold off
运行结果:
随机数据
分成两个cluster

 浙公网安备 33010602011771号