
keras框架的CNN手写数字识别MNIST
参考:林大贵.TensorFlow+Keras深度学习人工智能实践应用[M].北京:清华大学出版社,2018.
首先在命令行中写入 activate tensorflow和jupyter notebook,运行如下代码。当然,事先准备好MNIST数据集。


  1 # coding: utf-8
  2
  3 # In[4]:
  4
  5
  6 from keras.datasets import mnist
  7 from keras.utils import np_utils
  8 import numpy as np
  9 np.random.seed(10)
 10
 11
 12 # In[5]:
 13
 14
 15 (x_train,y_train),(x_test,y_test)=mnist.load_data()
 16
 17
 18 # In[6]:
 19
 20
 21 x_train4d = x_train.reshape(x_train.shape[0],28,28,1).astype('float32')
 22 x_test4d = x_test.reshape(x_test.shape[0],28,28,1).astype('float32')
 23
 24
 25 # In[7]:
 26
 27
 28 x_train4d_normalize = x_train4d/255
 29 x_test4d_normalize = x_test4d/255
 30
 31
 32 # In[8]:
 33
 34
 35 y_train_oneHot = np_utils.to_categorical(y_train)
 36 y_test_oneHot = np_utils.to_categorical(y_test)
 37
 38
 39 # In[9]:
 40
 41
 42 from keras.models import Sequential
 43 from keras.layers import Dense,Dropout,Flatten,Conv2D,MaxPooling2D
 44
 45
 46 # In[10]:
 47
 48
 49 model = Sequential()
 50
 51
 52 # In[11]:
 53
 54
 55 model.add(Conv2D(filters = 16,
 56                  kernel_size = (5,5),
 57                  padding = 'same',
 58                  input_shape = (28,28,1),
 59                  activation = ('relu')
 60                 ))
 61
 62
 63 # In[12]:
 64
 65
 66 model.add(MaxPooling2D(pool_size=(2,2)))
 67
 68
 69 # In[13]:
 70
 71
 72 model.add(Conv2D(filters = 36,
 73                 kernel_size = (5,5),
 74                 padding = 'same',
 75                 activation = 'relu'))
 76
 77
 78 # In[14]:
 79
 80
 81 model.add(MaxPooling2D(pool_size=(2,2)))
 82
 83
 84 # In[15]:
 85
 86
 87 model.add(Dropout(0,255))
 88
 89
 90 # In[16]:
 91
 92
 93 model.add(Flatten())
 94
 95
 96 # In[17]:
 97
 98
 99 model.add(Dense(128,activation = 'relu'))
100
101
102 # In[18]:
103
104
105 model.add(Dropout(0.5))
106
107
108 # In[19]:
109
110
111 model.add(Dense(10,activation = 'sigmoid'))
112
113
114 # In[20]:
115
116
117 print(model.summary())
118
119
120 # In[21]:
121
122
123 model.compile(loss='categorical_crossentropy',
124              optimizer = 'adam',
125              metrics = ['accuracy'])
126
127
128 # In[22]:
129
130
131 train_history = model.fit(x = x_train4d_normalize,
132                          y = y_train_oneHot,
133                          validation_split = 0.2,
134                          epochs = 10,
135                          batch_size = 300,
136                          verbose = 2)
137
138
139 # In[23]:
140
141
142 import matplotlib.pyplot as plt
143 def show_train_history(train_history,train,validation):
144     plt.plot(train_history.history[train])
145     plt.plot(train_history.history[validation])
146     plt.title('Train_History')
147     plt.ylabel(train)
148     plt.xlabel('Epoch')
149     plt.legend(['train','validation'], loc = 'upper left')
150     plt.show()
151
152
153 # In[24]:
154
155
156 show_train_history(train_history,'acc','val_acc')
157
158
159 # In[25]:
160
161
162 show_train_history(train_history,'loss','val_loss')
163
164
165 # In[26]:
166
167
168 scores = model.evaluate(x_test4d_normalize,y_test_oneHot)
169 scores[1]
170
171
172 # In[27]:
173
174
175 def plot_image_labels_prediction(images,labels,prediction,idx,num=10):
176     fig = plt.gcf()
177     fig.set_size_inches(12,24)
178     if num>50 : num = 50
179     for i in range(0,num):
180         ax = plt.subplot(10,5,1+i)
181         ax.imshow(images[idx],cmap='binary')
182         title = "lable="+str(labels[idx])
183         if len(prediction)>0:
184             title+=",predict="+str(prediction[idx])
185         ax.set_title(title,fontsize=10)
186         ax.set_xticks([]);ax.set_yticks([])
187         idx+=1
188     plt.show()
189
190
191 # In[28]:
192
193
194 prediction = model.predict_classes(x_test4d_normalize)
195
196
197 # In[29]:
198
199
200 plot_image_labels_prediction(x_test,
201                              y_test,
202                              prediction,
203                              0,
204                             50)
205
206
207 # In[30]:
208
209
210 import pandas as pd
211
212
213 # In[31]:
214
215
216 pd.crosstab(y_test,
217             prediction,
218            rownames=['label'],
219            colnames=['predict'])
220
221
222 # In[ ]:
卷积神经网络简介:https://www.cnblogs.com/bai2018/p/10413889.html
产生如下神经网络:
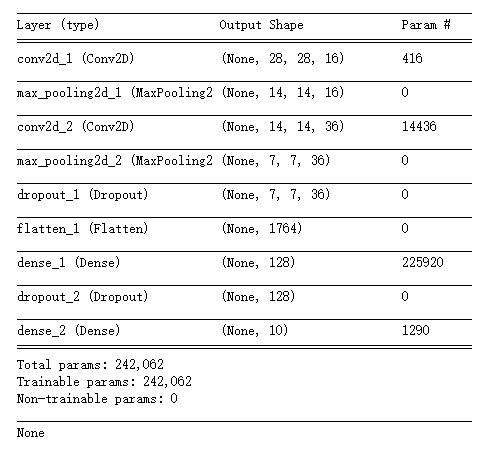
其中加入的dropout层用于避免过度拟合。在每次迭代时,随机舍弃一部分的训练样本。
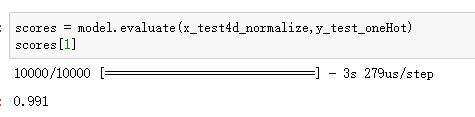
训练效果较好。
林大贵.TensorFlow+Keras深度学习人工智能实践应用[M].北京:清华大学出版社,2018.
Le vent se lève! . . . il faut tenter de vivre!
Le vent se lève! . . . il faut tenter de vivre!

 浙公网安备 33010602011771号