
Cesium之3D拉伸显示行政区
转自原文 Cesium之3D拉伸显示行政区含GeoJSON数据生成过程GDAL的ogr2ogr
Cesiumjs 是一套javascript库,用来渲染3D地球,2D区域地图,和多种GIS要素。不需要安装任何插件就能在支持最新HTML5标准的浏览器上运行。支持WebGL硬件加速,非常适合动态数据在GIS图层上的展示,是一个跨平台,开源,非常有前途的webgis表现层库。Cesium 基于 Apache 开源协议,支持商业和非商业免费使用。
背景:
Cesiumjs源自 Analytical Graphics, Inc. (AGI)公司为他们客户开发一个虚拟地球项目,后来将cesium项目贡献给开源社区并一直活跃开发中。是一种针对Cesium-应用的流式高分辨率服务器)另一个公司级的贡献者是NICTA (NationalICT Australia) 澳大利亚最大的信息与通讯技术中心,NICTA的员工们贡献了瓦片地图服务、地形处理等cesium的核心功能。并一直使用cesium开发环境监测分析、交通基础设施建模仿真优化等领域的应用。
Demo需求,想要将北京市行政区划内的要素,用3D表现出来,首先,需要得到北京16个区的面坐标:
Cesium通过GeoJSON(JSON格式)格式的数据展示空间要素,因此,需要得到此种格式的北京行政区划坐标,通过研究,可以使用GDAL的ogr2ogr方法将shp格式的图层转成GeoJSON格式
下面说一下GDAL的下载和使用:
需要安装GDAL,下载路径:http://www.gisinternals.com/release.php
下载的是第一个:release-1500-gdal-1-11-3-mapserver-6-4-2
解压缩release-1500-gdal-1-11-3-mapserver-6-4-2.zip
根据里面的read-me.txt,安装此GDAL需要CMD运行SDKShell.bat命令即可,成功安装,每次重启机器后,需要重新执行此程序进行安装,才能使用
然后cd C:\Users\IBM_ADMIN\Downloads\release-1500-gdal-1-11-3-mapserver-6-4-2\bin\gdal\apps
根据ogr2ogr.exe的工具进行转换,开始,找到的shp文件转换失败,后从此命令转换的shp修改了下,即可成功转成json,可能是有的shp文件不支持,具体不详
命令:
将geoJSON转成shp格式:
C:\Users\IBM_ADMIN\Downloads\release-1500-gdal-1-11-3-mapserver-6-4-2\bin\gdal\a
pps>ogr2ogr -f "ESRI Shapefile" v.shp geojsonfile.json
将f.shp转成geoJSON格式:
C:\Users\IBM_ADMIN\Downloads\release-1500-gdal-1-11-3-mapserver-6-4-2\bin\gdal\a
pps>ogr2ogr -f "GeoJSON" o.json f.shp
因为本地没有现成的北京行政区shp图层,因此,又发现竟然可以通过ESRI在线地图服务的行政区图层转成GeoJSON格式,开始发现坐标系不是wgs84,Cesium-1.16仅支持WGS84坐标系,因为,加入参数(此处指的是坐标转换参数,具体的可以通过ArcGIS的spatial Adjust 获取的校正参数,或者,直接是坐标平移参数。20.3.21 更新),将ESRI的输出坐标系转成4326即可。
代码:
ogr2ogr -f GeoJSON test.json "http://cache1.arcgisonline.cn/ArcGIS/rest/services/ChinaCities_Community_BaseMap_CHN/BeiJing_Community_BaseMap_CHN/MapServer/0/query?where=1%3D1&outfields=*&f=json" OGRGeoJSON
修改下语句即可,ArcGISServer支持输出不同的坐标系
ogr2ogr -f GeoJSON test.json "http://cache1.arcgisonline.cn/ArcGIS/rest/services/ChinaCities_Community_BaseMap_CHN/BeiJing_Community_BaseMap_CHN/MapServer/0/query?where=1%3D1&outSR=4326&outfields=*&f=json" OGRGeoJSON
完成导出
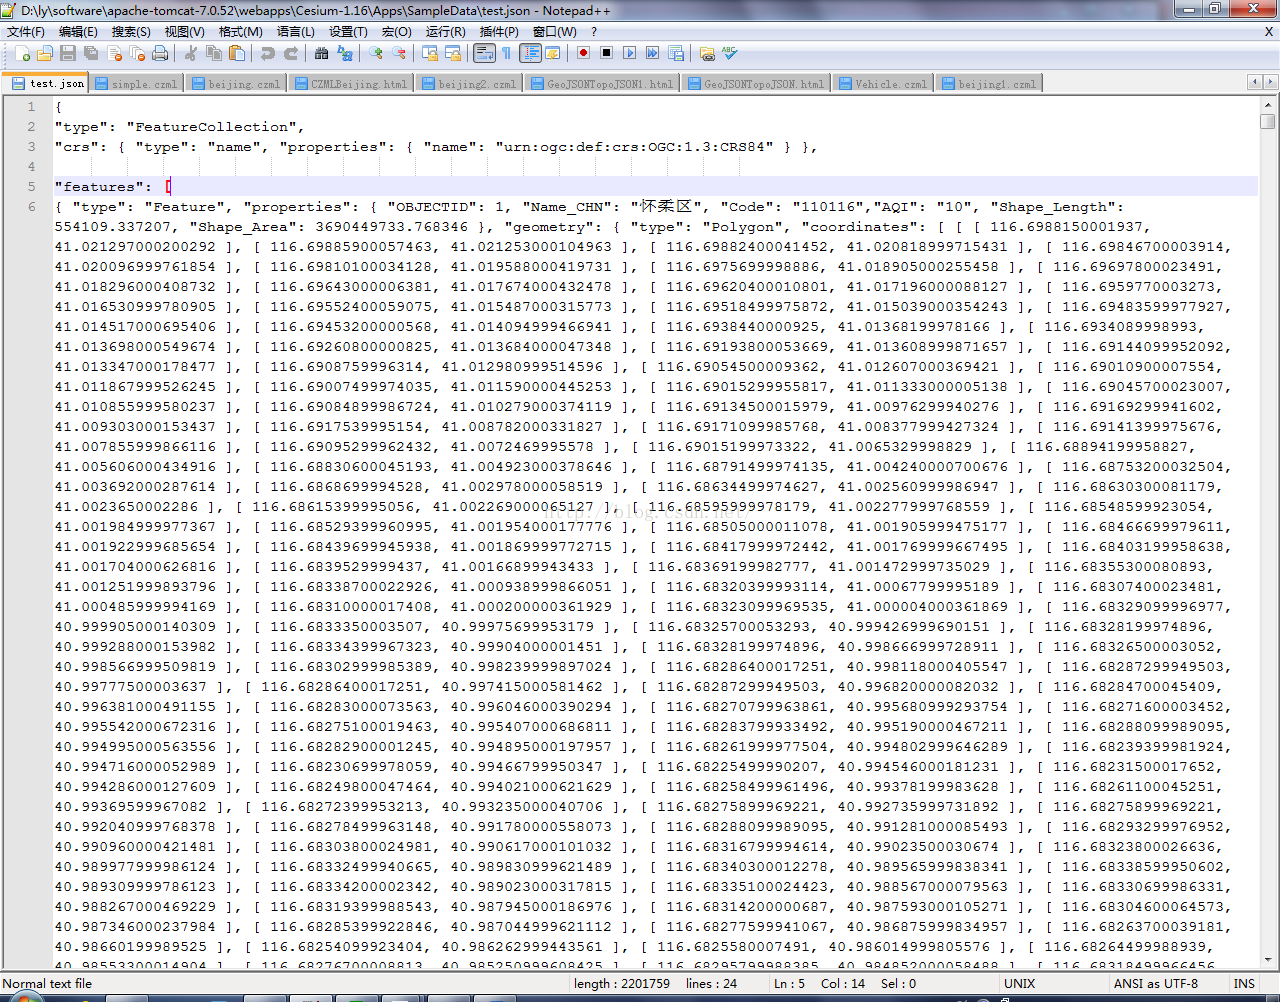
这时候终于得到了GeoJSON格式的北京行政区数据文件
下面就是将Cesium现成的例子,改个数据源地址,和高程字段
//Seed the random number generator for repeatable results.
    Cesium.Math.setRandomNumberSeed(0);

    var promise = Cesium.GeoJsonDataSource.load('../../SampleData/test.json');
    promise.then(function(dataSource) {
        viewer.dataSources.add(dataSource);

        //Get the array of entities
        var entities = dataSource.entities.values;

        var colorHash = {};
        for (var i = 0; i < entities.length; i++) {
            //For each entity, create a random color based on the state name.
            //Some states have multiple entities, so we store the color in a
            //hash so that we use the same color for the entire state.
            var entity = entities[i];
            var name = entity.name;
            var color = colorHash[name];
            if (!color) {
                color = Cesium.Color.fromRandom({
                    alpha : 1.0
                });
                colorHash[name] = color;
            }

            //Set the polygon material to our random color.
            entity.polygon.material = color;
            //Remove the outlines.
            entity.polygon.outline = false;

            //Extrude the polygon based on the state's population.  Each entity
            //stores the properties for the GeoJSON feature it was created from
            //Since the population is a huge number, we divide by 50.
            entity.polygon.extrudedHeight = entity.properties.Shape_Area / 100000.0;

            }
        }
        viewer.zoomTo(promise);

最终效果如上图所示。
没有整理与归纳的知识,一文不值!高度概括与梳理的知识,才是自己真正的知识与技能。 永远不要让自己的自由、好奇、充满创造力的想法被现实的框架所束缚,让创造力自由成长吧! 多花时间,关心他(她)人,正如别人所关心你的。理想的腾飞与实现,没有别人的支持与帮助,是万万不能的。

 浙公网安备 33010602011771号