系统级性能分析工具perf的介绍与使用
测试环境:Ubuntu16.04 + Kernel:4.4.0-31
系统级性能优化通常包括两个阶段:性能剖析(performance profiling)和代码优化。
性能剖析的目标是寻找性能瓶颈,查找引发性能问题的原因及热点代码。
代码优化的目标是针对具体性能问题而优化代码或编译选项,以改善软件性能。
在性能剖析阶段,需要借助于现有的profiling工具,如perf等。在代码优化阶段往往需要借助开发者的经验,编写简洁高效的代码,甚至在汇编级别合理使用各种指令,合理安排各种指令的执行顺序。
perf是一款Linux性能分析工具。Linux性能计数器是一个新的基于内核的子系统,它提供一个性能分析框架,比如硬件(CPU、PMU(Performance Monitoring Unit))功能和软件(软件计数器、tracepoint)功能。
通过perf,应用程序可以利用PMU、tracepoint和内核中的计数器来进行性能统计。它不但可以分析制定应用程序的性能问题(per thread),也可以用来分析内核的性能问题,当然也可以同事分析应用程序和内核,从而全面理解应用程序中的性能瓶颈。
使用perf,可以分析程序运行期间发生的硬件事件,比如instructions retired、processor clock cycles等;也可以分析软件时间,比如page fault和进程切换。
perf是一款综合性分析工具,大到系统全局性性能,再小到进程线程级别,甚至到函数及汇编级别。
perf提供了十八般武器,可以拿大刀大卸八块,也可以拿起手术刀细致分析。
1. 背景知识
1.1 tracepoints
tracepoints是散落在内核源码中的一些hook,它们可以在特定的代码被执行到时触发,这一特定可以被各种trace/debug工具所使用。
perf将tracepoint产生的时间记录下来,生成报告,通过分析这些报告,条有人缘便可以了解程序运行期间内核的各种细节,对性能症状做出准确的诊断。
这些tracepint的对应的sysfs节点在/sys/kernel/debug/tracing/events目录下。
1.2 硬件特性之cache
内存读写是很快的,但是还是无法和处理器指令执行速度相比。为了从内存中读取指令和数据,处理器需要等待,用处理器时间来衡量,这种等待非常漫长。cache是一种SRAM,读写速度非常快,能和处理器相匹配。因此将常用的数据保存在cache中,处理器便无需等待,从而提高性能。cache的尺寸一般都很小,充分利用cache是软件调优非常重要部分。
2. 主要关注点
基于性能分析,可以进行算法优化(空间复杂度和时间复杂度权衡)、代码优化(提高执行速度、减少内存占用)。
评估程序对硬件资源的使用情况,例如各级cache的访问次数、各级cache的丢失次数、流水线停顿周期、前端总线访问次数等。
评估程序对操作系统资源的使用情况,系统调用次数、上下文切换次数、任务迁移次数。
事件可以分为三种:
- Hardware Event由PMU部件产生,在特定的条件下探测性能事件是否发生以及发生的次数。比如cache命中。
- Software Event是内核产生的事件,分布在各个功能模块中,统计和操作系统相关性能事件。比如进程切换,tick数等。
-
Tracepoint Event是内核中静态tracepoint所触发的事件,这些tracepoint用来判断程序运行期间内核的行为细节,比如slab分配器的分配次数等。
3. perf的使用
perf --help之后可以看到perf的二级命令。
| 序号 | 命令 | 作用 |
| 1 | annotate | 解析perf record生成的perf.data文件,显示被注释的代码。 |
| 2 | archive | 根据数据文件记录的build-id,将所有被采样到的elf文件打包。利用此压缩包,可以再任何机器上分析数据文件中记录的采样数据。 |
| 3 | bench | perf中内置的benchmark,目前包括两套针对调度器和内存管理子系统的benchmark。 |
| 4 | buildid-cache | 管理perf的buildid缓存,每个elf文件都有一个独一无二的buildid。buildid被perf用来关联性能数据与elf文件。 |
| 5 | buildid-list | 列出数据文件中记录的所有buildid。 |
| 6 | diff | 对比两个数据文件的差异。能够给出每个符号(函数)在热点分析上的具体差异。 |
| 7 | evlist | 列出数据文件perf.data中所有性能事件。 |
| 8 | inject | 该工具读取perf record工具记录的事件流,并将其定向到标准输出。在被分析代码中的任何一点,都可以向事件流中注入其它事件。 |
| 9 | kmem | 针对内核内存(slab)子系统进行追踪测量的工具 |
| 10 | kvm | 用来追踪测试运行在KVM虚拟机上的Guest OS。 |
| 11 | list | 列出当前系统支持的所有性能事件。包括硬件性能事件、软件性能事件以及检查点。 |
| 12 | lock | 分析内核中的锁信息,包括锁的争用情况,等待延迟等。 |
| 13 | mem | 内存存取情况 |
| 14 | record | 收集采样信息,并将其记录在数据文件中。随后可通过其它工具对数据文件进行分析。 |
| 15 | report | 读取perf record创建的数据文件,并给出热点分析结果。 |
| 16 | sched | 针对调度器子系统的分析工具。 |
| 17 | script | 执行perl或python写的功能扩展脚本、生成脚本框架、读取数据文件中的数据信息等。 |
| 18 | stat | 执行某个命令,收集特定进程的性能概况,包括CPI、Cache丢失率等。 |
| 19 | test | perf对当前软硬件平台进行健全性测试,可用此工具测试当前的软硬件平台是否能支持perf的所有功能。 |
| 20 | timechart | 针对测试期间系统行为进行可视化的工具 |
| 21 | top | 类似于linux的top命令,对系统性能进行实时分析。 |
| 22 | trace | 关于syscall的工具。 |
| 23 | probe | 用于定义动态检查点。 |
全局性概况:
perf list查看当前系统支持的性能事件;
perf bench对系统性能进行摸底;
perf test对系统进行健全性测试;
perf stat对全局性能进行统计;
全局细节:
perf top可以实时查看当前系统进程函数占用率情况;
perf probe可以自定义动态事件;
特定功能分析:
perf kmem针对slab子系统性能分析;
perf kvm针对kvm虚拟化分析;
perf lock分析锁性能;
perf mem分析内存slab性能;
perf sched分析内核调度器性能;
perf trace记录系统调用轨迹;
最常用功能perf record,可以系统全局,也可以具体到某个进程,更甚具体到某一进程某一事件;可宏观,也可以很微观。
pref record记录信息到perf.data;
perf report生成报告;
perf diff对两个记录进行diff;
perf evlist列出记录的性能事件;
perf annotate显示perf.data函数代码;
perf archive将相关符号打包,方便在其它机器进行分析;
perf script将perf.data输出可读性文本;
可视化工具perf timechart
perf timechart record记录事件;
perf timechart生成output.svg文档;
3.0 perf引入的overhead
perf测试不可避免的会引入额外负荷,有三种形式:
counting:内核提供计数总结,多是Hardware Event、Software Events、PMU计数等。相关命令perf stat。
sampling:perf将事件数据缓存到一块buffer中,然后异步写入到perf.data文件中。使用perf report等工具进行离线分析。
bpf:Kernel 4.4+新增功能,可以提供更多有效filter和输出总结。
counting引入的额外负荷最小;sampling在某些情况下会引入非常大的负荷;bpf可以有效缩减负荷。
针对sampling,可以通过挂在建立在RAM上的文件系统来有效降低读写I/O引入的负荷。
mkdir /tmpfs
mount -t tmpfs tmpfs /tmpfs
3.1 perf list
perf list不能完全显示所有支持的事件类型,需要sudo perf list。
同时还可以显示特定模块支持的perf事件:hw/cache/pmu都是硬件相关的;tracepoint基于内核的ftrace;sw实际上是内核计数器。
hw/hardware显示支持的硬件事件相关,如:
al@al-System-Product-Name:~/perf$ sudo perf list hardware
List of pre-defined events (to be used in -e):
branch-instructions OR branches [Hardware event]
branch-misses [Hardware event]
cache-misses [Hardware event]
cache-references [Hardware event]
cpu-cycles OR cycles [Hardware event]
instructions [Hardware event]
stalled-cycles-backend OR idle-cycles-backend [Hardware event]
stalled-cycles-frontend OR idle-cycles-frontend [Hardware event]
sw/software显示支持的软件事件列表:
al@al-System-Product-Name:~/perf$ sudo perf list sw
List of pre-defined events (to be used in -e):
alignment-faults [Software event]
bpf-output [Software event]
context-switches OR cs [Software event]
cpu-clock [Software event]
cpu-migrations OR migrations [Software event]
dummy [Software event]
emulation-faults [Software event]
major-faults [Software event]
minor-faults [Software event]
page-faults OR faults [Software event]
task-clock [Software event]
cache/hwcache显示硬件cache相关事件列表:
al@al-System-Product-Name:~/perf$ sudo perf list cache
List of pre-defined events (to be used in -e):
L1-dcache-load-misses [Hardware cache event]
L1-dcache-loads [Hardware cache event]
L1-dcache-prefetch-misses [Hardware cache event]
L1-dcache-prefetches [Hardware cache event]
L1-icache-load-misses [Hardware cache event]
L1-icache-loads [Hardware cache event]
L1-icache-prefetches [Hardware cache event]
LLC-load-misses [Hardware cache event]
LLC-loads [Hardware cache event]
LLC-stores [Hardware cache event]
branch-load-misses [Hardware cache event]
branch-loads [Hardware cache event]
dTLB-load-misses [Hardware cache event]
dTLB-loads [Hardware cache event]
iTLB-load-misses [Hardware cache event]
iTLB-loads [Hardware cache event]
node-load-misses [Hardware cache event]
node-loads [Hardware cache event]
pmu显示支持的PMU事件列表:
al@al-System-Product-Name:~/perf$ sudo perf list pmu
List of pre-defined events (to be used in -e):
branch-instructions OR cpu/branch-instructions/ [Kernel PMU event]
branch-misses OR cpu/branch-misses/ [Kernel PMU event]
cache-misses OR cpu/cache-misses/ [Kernel PMU event]
cache-references OR cpu/cache-references/ [Kernel PMU event]
cpu-cycles OR cpu/cpu-cycles/ [Kernel PMU event]
instructions OR cpu/instructions/ [Kernel PMU event]
msr/aperf/ [Kernel PMU event]
msr/mperf/ [Kernel PMU event]
msr/tsc/ [Kernel PMU event]
stalled-cycles-backend OR cpu/stalled-cycles-backend/ [Kernel PMU event]
stalled-cycles-frontend OR cpu/stalled-cycles-frontend/ [Kernel PMU event]
tracepoint显示支持的所有tracepoint列表,这个列表就比较庞大:
al@al-System-Product-Name:~/perf$ sudo perf list tracepoint
List of pre-defined events (to be used in -e):
alarmtimer:alarmtimer_cancel [Tracepoint event]
alarmtimer:alarmtimer_fired [Tracepoint event]
alarmtimer:alarmtimer_start [Tracepoint event]
alarmtimer:alarmtimer_suspend [Tracepoint event]
block:block_bio_backmerge [Tracepoint event]
block:block_bio_bounce [Tracepoint event]
block:block_bio_complete [Tracepoint event]
block:block_bio_frontmerge [Tracepoint event]
block:block_bio_queue [Tracepoint event]…
3.2 perf top
默认情况下perf top是无法显示信息的,需要sudo perf top或者echo -1 > /proc/sys/kernel/perf_event_paranoid(在Ubuntu16.04,还需要echo 0 > /proc/sys/kernel/kptr_restrict)。
即可以正常显示perf top如下:
第一列:符号引发的性能事件的比例,指占用的cpu周期比例。
第二列:符号所在的DSO(Dynamic Shared Object),可以是应用程序、内核、动态链接库、模块。
第三列:DSO的类型。[.]表示此符号属于用户态的ELF文件,包括可执行文件与动态链接库;[k]表述此符号属于内核或模块。
第四列:符号名。有些符号不能解析为函数名,只能用地址表示。

关于perf top界面常用命令如下:
h:显示帮助,即可显示详细的帮助信息。
UP/DOWN/PGUP/PGDN/SPACE:上下和翻页。
a:annotate current symbol,注解当前符号。能够给出汇编语言的注解,给出各条指令的采样率。
d:过滤掉所有不属于此DSO的符号。非常方便查看同一类别的符号。
P:将当前信息保存到perf.hist.N中。
perf top常用选项有:
-e <event>:指明要分析的性能事件。
-p <pid>:Profile events on existing Process ID (comma sperated list). 仅分析目标进程及其创建的线程。
-k <path>:Path to vmlinux. Required for annotation functionality. 带符号表的内核映像所在的路径。
-K:不显示属于内核或模块的符号。
-U:不显示属于用户态程序的符号。
-d <n>:界面的刷新周期,默认为2s,因为perf top默认每2s从mmap的内存区域读取一次性能数据。
-g:得到函数的调用关系图。
perf top --call-graph [fractal],路径概率为相对值,加起来为100%,调用顺序为从下往上。
perf top --call-graph graph,路径概率为绝对值,加起来为该函数的热度。

3.3 perf stat
perf stat用于运行指令,并分析其统计结果。虽然perf top也可以指定pid,但是必须先启动应用才能查看信息。
perf stat能完整统计应用整个生命周期的信息。
命令格式为:
perf stat [-e <EVENT> | --event=EVENT] [-a] <command>
perf stat [-e <EVENT> | --event=EVENT] [-a] — <command> [<options>]
下面简单看一下perf stat 的输出:
al@al-System-Product-Name:~/perf$ sudo perf stat
^C
Performance counter stats for 'system wide':40904.820871 cpu-clock (msec) # 5.000 CPUs utilized
18,132 context-switches # 0.443 K/sec
1,053 cpu-migrations # 0.026 K/sec
2,420 page-faults # 0.059 K/sec
3,958,376,712 cycles # 0.097 GHz (49.99%)
574,598,403 stalled-cycles-frontend # 14.52% frontend cycles idle (49.98%)
9,392,982,910 stalled-cycles-backend # 237.29% backend cycles idle (50.00%)
1,653,185,883 instructions # 0.42 insn per cycle
# 5.68 stalled cycles per insn (50.01%)
237,061,366 branches # 5.795 M/sec (50.02%)
18,333,168 branch-misses # 7.73% of all branches (50.00%)8.181521203 seconds time elapsed
输出解释如下:
cpu-clock:任务真正占用的处理器时间,单位为ms。CPUs utilized = task-clock / time elapsed,CPU的占用率。
context-switches:程序在运行过程中上下文的切换次数。
CPU-migrations:程序在运行过程中发生的处理器迁移次数。Linux为了维持多个处理器的负载均衡,在特定条件下会将某个任务从一个CPU迁移到另一个CPU。
CPU迁移和上下文切换:发生上下文切换不一定会发生CPU迁移,而发生CPU迁移时肯定会发生上下文切换。发生上下文切换有可能只是把上下文从当前CPU中换出,下一次调度器还是将进程安排在这个CPU上执行。
page-faults:缺页异常的次数。当应用程序请求的页面尚未建立、请求的页面不在内存中,或者请求的页面虽然在内存中,但物理地址和虚拟地址的映射关系尚未建立时,都会触发一次缺页异常。另外TLB不命中,页面访问权限不匹配等情况也会触发缺页异常。
cycles:消耗的处理器周期数。如果把被ls使用的cpu cycles看成是一个处理器的,那么它的主频为2.486GHz。可以用cycles / task-clock算出。
stalled-cycles-frontend:指令读取或解码的质量步骤,未能按理想状态发挥并行左右,发生停滞的时钟周期。
stalled-cycles-backend:指令执行步骤,发生停滞的时钟周期。
instructions:执行了多少条指令。IPC为平均每个cpu cycle执行了多少条指令。
branches:遇到的分支指令数。branch-misses是预测错误的分支指令数。
其他常用参数
-a, --all-cpus 显示所有CPU上的统计信息
-C, --cpu <cpu> 显示指定CPU的统计信息
-c, --scale scale/normalize counters
-D, --delay <n> ms to wait before starting measurement after program start
-d, --detailed detailed run - start a lot of events
-e, --event <event> event selector. use 'perf list' to list available events
-G, --cgroup <name> monitor event in cgroup name only
-g, --group put the counters into a counter group
-I, --interval-print <n>
print counts at regular interval in ms (>= 10)
-i, --no-inherit child tasks do not inherit counters
-n, --null null run - dont start any counters
-o, --output <file> 输出统计信息到文件
-p, --pid <pid> stat events on existing process id
-r, --repeat <n> repeat command and print average + stddev (max: 100, forever: 0)
-S, --sync call sync() before starting a run
-t, --tid <tid> stat events on existing thread id
...
示例
前面统计程序的示例,下面看一下统计CPU信息的示例:
执行sudo perf stat -C 0,统计CPU 0的信息。想要停止后,按下Ctrl+C终止。可以看到统计项一样,只是统计对象变了。
al@al-System-Product-Name:~/perf$ sudo perf stat -C 0
^C
Performance counter stats for 'CPU(s) 0':2517.107315 cpu-clock (msec) # 1.000 CPUs utilized
2,941 context-switches # 0.001 M/sec
109 cpu-migrations # 0.043 K/sec
38 page-faults # 0.015 K/sec
644,094,340 cycles # 0.256 GHz (49.94%)
70,425,076 stalled-cycles-frontend # 10.93% frontend cycles idle (49.94%)
965,270,543 stalled-cycles-backend # 149.86% backend cycles idle (49.94%)
623,284,864 instructions # 0.97 insn per cycle
# 1.55 stalled cycles per insn (50.06%)
65,658,190 branches # 26.085 M/sec (50.06%)
3,276,104 branch-misses # 4.99% of all branches (50.06%)2.516996126 seconds time elapsed
如果需要统计更多的项,需要使用-e,如:
| perf stat -e task-clock,context-switches,cpu-migrations,page-faults,cycles,stalled-cycles-frontend,stalled-cycles-backend,instructions,branches,branch-misses,L1-dcache-loads,L1-dcache-load-misses,LLC-loads,LLC-load-misses,dTLB-loads,dTLB-load-misses ls |
结果如下,关注的特殊项也纳入统计。
al@al-System-Product-Name:~/perf$ sudo perf stat -e task-clock,context-switches,cpu-migrations,page-faults,cycles,stalled-cycles-frontend,stalled-cycles-backend,instructions,branches,branch-misses,L1-dcache-loads,L1-dcache-load-misses,LLC-loads,LLC-load-misses,dTLB-loads,dTLB-load-misses ls
Performance counter stats for 'ls':
2.319422 task-clock (msec) # 0.719 CPUs utilized
0 context-switches # 0.000 K/sec
0 cpu-migrations # 0.000 K/sec
89 page-faults # 0.038 M/sec
2,142,386 cycles # 0.924 GHz
659,800 stalled-cycles-frontend # 30.80% frontend cycles idle
725,343 stalled-cycles-backend # 33.86% backend cycles idle
1,344,518 instructions # 0.63 insn per cycle
# 0.54 stalled cycles per insn
<not counted> branches
<not counted> branch-misses
<not counted> L1-dcache-loads
<not counted> L1-dcache-load-misses
<not counted> LLC-loads
<not counted> LLC-load-misses
<not counted> dTLB-loads
<not counted> dTLB-load-misses0.003227507 seconds time elapsed
3.4 perf bench
perf bench作为benchmark工具的通用框架,包含sched/mem/numa/futex等子系统,all可以指定所有。
perf bench可用于评估系统sched/mem等特定性能。
perf bench sched:调度器和IPC机制。包含messaging和pipe两个功能。
perf bench mem:内存存取性能。包含memcpy和memset两个功能。
perf bench numa:NUMA架构的调度和内存处理性能。包含mem功能。
perf bench futex:futex压力测试。包含hash/wake/wake-parallel/requeue/lock-pi功能。
perf bench all:所有bench测试的集合
3.4.1 perf bench sched all
测试messaging和pipi两部分性能。
3.4.1.1 sched messaging评估进程调度和核间通信
sched message 是从经典的测试程序 hackbench 移植而来,用来衡量调度器的性能,overhead 以及可扩展性。
该 benchmark 启动 N 个 reader/sender 进程或线程对,通过 IPC(socket 或者 pipe) 进行并发的读写。一般人们将 N 不断加大来衡量调度器的可扩展性。
sched message 的用法及用途和 hackbench 一样,可以通过修改参数进行不同目的测试:
-g, --group <n> Specify number of groups
-l, --nr_loops <n> Specify the number of loops to run (default: 100)
-p, --pipe Use pipe() instead of socketpair()
-t, --thread Be multi thread instead of multi process
测试结果:
al@al-System-Product-Name:~/perf$ perf bench sched all
# Running sched/messaging benchmark...
# 20 sender and receiver processes per group
# 10 groups == 400 processes runTotal time: 0.173 [sec]
# Running sched/pipe benchmark...
# Executed 1000000 pipe operations between two processesTotal time: 12.233 [sec]
12.233170 usecs/op
81744 ops/sec
使用pipe()和socketpair()对测试影响:
1. perf bench sched messaging
# Running 'sched/messaging' benchmark:
# 20 sender and receiver processes per group
# 10 groups == 400 processes runTotal time: 0.176 [sec]
2. perf bench sched messaging -p# Running 'sched/messaging' benchmark:
# 20 sender and receiver processes per group
# 10 groups == 400 processes runTotal time: 0.093 [sec]
可见socketpair()性能要明显低于pipe()。
3.4.1.2 sched pipe评估pipe性能
sched pipe 从 Ingo Molnar 的 pipe-test-1m.c 移植而来。当初 Ingo 的原始程序是为了测试不同的调度器的性能和公平性的。
其工作原理很简单,两个进程互相通过 pipe 拼命地发 1000000 个整数,进程 A 发给 B,同时 B 发给 A。因为 A 和 B 互相依赖,因此假如调度器不公平,对 A 比 B 好,那么 A 和 B 整体所需要的时间就会更长。
al@al-System-Product-Name:~/perf$ perf bench sched pipe
# Running 'sched/pipe' benchmark:
# Executed 1000000 pipe operations between two processesTotal time: 12.240 [sec]
12.240411 usecs/op
81696 ops/sec
3.4.2 perf bench mem all
该测试衡量 不同版本的memcpy/memset/ 函数处理一个 1M 数据的所花费的时间,转换成吞吐率。
al@al-System-Product-Name:~/perf$ perf bench mem all
# Running mem/memcpy benchmark...
# function 'default' (Default memcpy() provided by glibc)
# Copying 1MB bytes ...1.236155 GB/sec.
..
3.4.3 perf bench futex
Futex是一种用户态和内核态混合机制,所以需要两个部分合作完成,linux上提供了sys_futex系统调用,对进程竞争情况下的同步处理提供支持。
所有的futex同步操作都应该从用户空间开始,首先创建一个futex同步变量,也就是位于共享内存的一个整型计数器。
当进程尝试持有锁或者要进入互斥区的时候,对futex执行"down"操作,即原子性的给futex同步变量减1。如果同步变量变为0,则没有竞争发生, 进程照常执行。
如果同步变量是个负数,则意味着有竞争发生,需要调用futex系统调用的futex_wait操作休眠当前进程。
当进程释放锁或 者要离开互斥区的时候,对futex进行"up"操作,即原子性的给futex同步变量加1。如果同步变量由0变成1,则没有竞争发生,进程照常执行。
如果加之前同步变量是负数,则意味着有竞争发生,需要调用futex系统调用的futex_wake操作唤醒一个或者多个等待进程。
al@al-System-Product-Name:~/perf$ perf bench futex all
# Running futex/hash benchmark...
Run summary [PID 3806]: 5 threads, each operating on 1024 [private] futexes for 10 secs.[thread 0] futexes: 0x4003d20 ... 0x4004d1c [ 4635648 ops/sec ]
[thread 1] futexes: 0x4004d30 ... 0x4005d2c [ 4611072 ops/sec ]
[thread 2] futexes: 0x4005e70 ... 0x4006e6c [ 4254515 ops/sec ]
[thread 3] futexes: 0x4006fb0 ... 0x4007fac [ 4559360 ops/sec ]
[thread 4] futexes: 0x40080f0 ... 0x40090ec [ 4636262 ops/sec ]Averaged 4539371 operations/sec (+- 1.60%), total secs = 10
# Running futex/wake benchmark...
Run summary [PID 3806]: blocking on 5 threads (at [private] futex 0x96b52c), waking up 1 at a time.[Run 1]: Wokeup 5 of 5 threads in 0.0270 ms
[Run 2]: Wokeup 5 of 5 threads in 0.0370 ms...
3.4 perf record
运行一个命令,并将其数据保存到perf.data中。随后,可以使用perf report进行分析。
perf record和perf report可以更精确的分析一个应用,perf record可以精确到函数级别。并且在函数里面混合显示汇编语言和代码。
创建一个fork.c文件用于测试:
#include <stdio.h>

void test_little(void)
{
  int i,j;

  for(i = 0; i < 30000000; i++)
    j=i;
}

void test_mdedium(void)
{
  int i,j;

  for(i = 0; i < 60000000; i++)
    j=i;
}

void test_high(void)
{
  int i,j;

  for(i = 0; i < 90000000; i++)
    j=i;
}

void test_hi(void)
{
  int i,j;

  for(i = 0; i < 120000000; i++)
    j=i;
}

int main(void)
{
  int i, pid, result;

  for(i = 0; i<2; i++) {
    result = fork();
    if(result>0)
      printf("i=%d parent parent=%d current=%d child=%d\n", i, getppid(), getpid(), result);
    else
      printf("i=%d child parent=%d current=%d\n", i, getppid(), getpid());

    if(i==0)
    {
      test_little();
      sleep(1);
    } else {
      test_mdedium();
      sleep(1);
    }
  }

  pid = wait(NULL);
  test_high();
  printf("pid=%d wait=%d\n", getpid(), pid);
  sleep(1);
  pid = wait(NULL);
  test_hi();
  printf("pid=%d wait=%d\n", getpid(), pid);
  return 0;
}
编译fork.c文件gcc fork.c -o fork-g -O0,同时可以使用此方法分析是否选择编译优化产生的结果。-g是只能callgraph功能,-O0是关闭优化。
常用选项
-e record指定PMU事件
--filter event事件过滤器
-a 录取所有CPU的事件
-p 录取指定pid进程的事件
-o 指定录取保存数据的文件名
-g 使能函数调用图功能
-C 录取指定CPU的事件
sudo perf record -a -g ./fork:会在当前目录生成perf.data文件。
sudo perf report --call-graph none结果如下,后面结合perf timechart分析.

上图看上去比较乱,如果想只看fork产生的信息:
sudo perf report --call-graph none -c fork
可以看出只显示了fork程序的相关符号及其占用率。

3.5 perf report
解析perf record产生的数据,并给出分析结果。
常用参数:
-i 导入的数据文件名称,如果没有则默认为perf.data
-g 生成函数调用关系图,此时内核要打开CONFIG_KALLSYMS;用户空间库或者执行文件需要带符号信息(not stripped),编译选项需要加上-g。
--sort 从更高层面显示分类统计信息,比如: pid, comm, dso, symbol, parent, cpu,socket, srcline, weight, local_weight.
执行sudo perf report -i perf.data,可以看出main函数所占百分比,以及funcA和funcB分别所占百分比。
在funcB执行过程中,还产生了apic timer,占用了一部分cpu资源。除此之外,占比基本上是1:10。
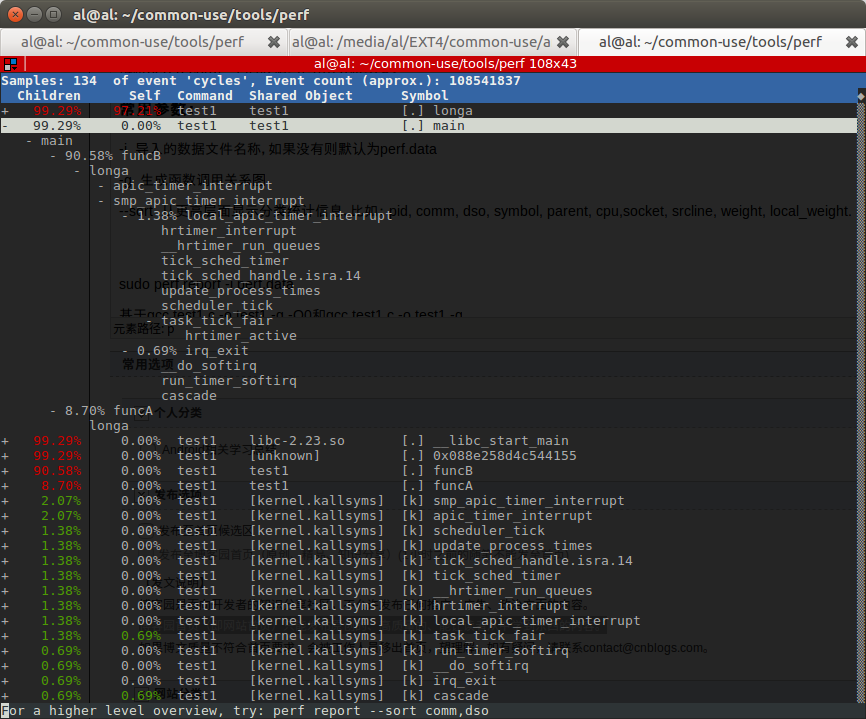
funcA和funcB的占比,基本符合预期。那么进入longa,分析一下热点。
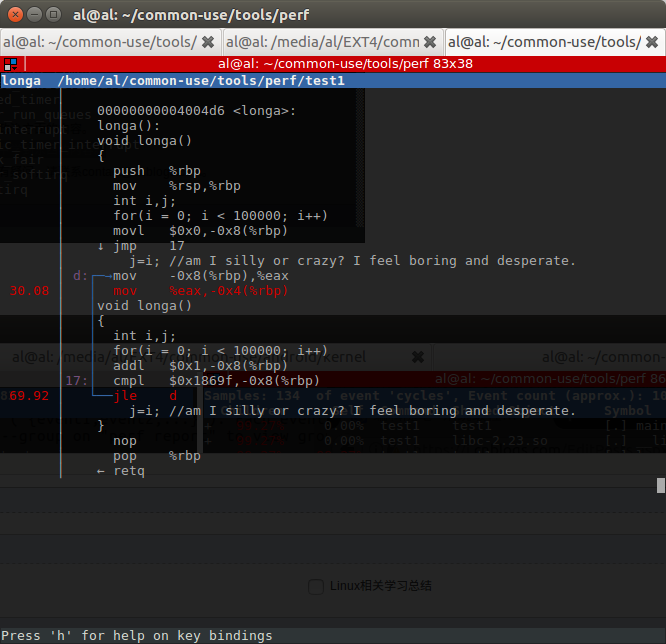
在C和汇编混合显示界面,可以看出for循环占用了69.92%,j=i赋值占用了30.08%。
根据之上描述,可以看出top适合监控整个系统的性能,stat比较适合单个程序的性能分析,record/report更适合对程序进行更细粒度的分析。
注意点:
在使用perf report -g的时候,可能会提示Failed to open /lib/libpthread-0.9.33.2.so, continuing without symbols。
这时候通过file xxx查看,如果提示xxxx stripped表示此文件不包含符号信息,需要xxxx not stripped文件。
3.6 perf timechart
perf timechart是将之前的各种统计信息图形化的一个工具。
perf timechart record <option> <command>用于记录整个系统或者一个应用的事件,还可以加option记录指定类型的事件。
perf timechart用于将perf.data转换成SVG格式的文件,SVG可以通过Inkscape或者浏览器打开。
perf timechart record可以指定特定类型的事件:
-P:记录power相关事件
-T:记录任务相关事件
-I:记录io相关事件
-g:记录函数调用关系
perf timechart用于将perf timechart record录取的perf.data转换成output.svg。
-w调整输出的svg文件长度,可以查看更多细节。
-p可以指定只查看某些进程输出,使用方式:sudo perf timechart -p test1 -p thermald
-o 指定输出文件名
-i 指定待解析的文件名
-w 输出SVG文件宽度
-P 只显示power相关事件图标
-T , --tasks-only 显示task信息,不显示处理器信息
-p 显示指定进程名称或者PID显示
--symfs=<directory> 指定系统符号表路径
-t, --topology 根据拓扑结构对CPU进行分类
--highlight=<duration_nsecs|task_name> 对运行超过特定时间的task高亮
当线程太多影响svg解析速度的时候,可以通过-p指定特定线程进行分析。如果需要几个线程,每个线程采用-p xxx。
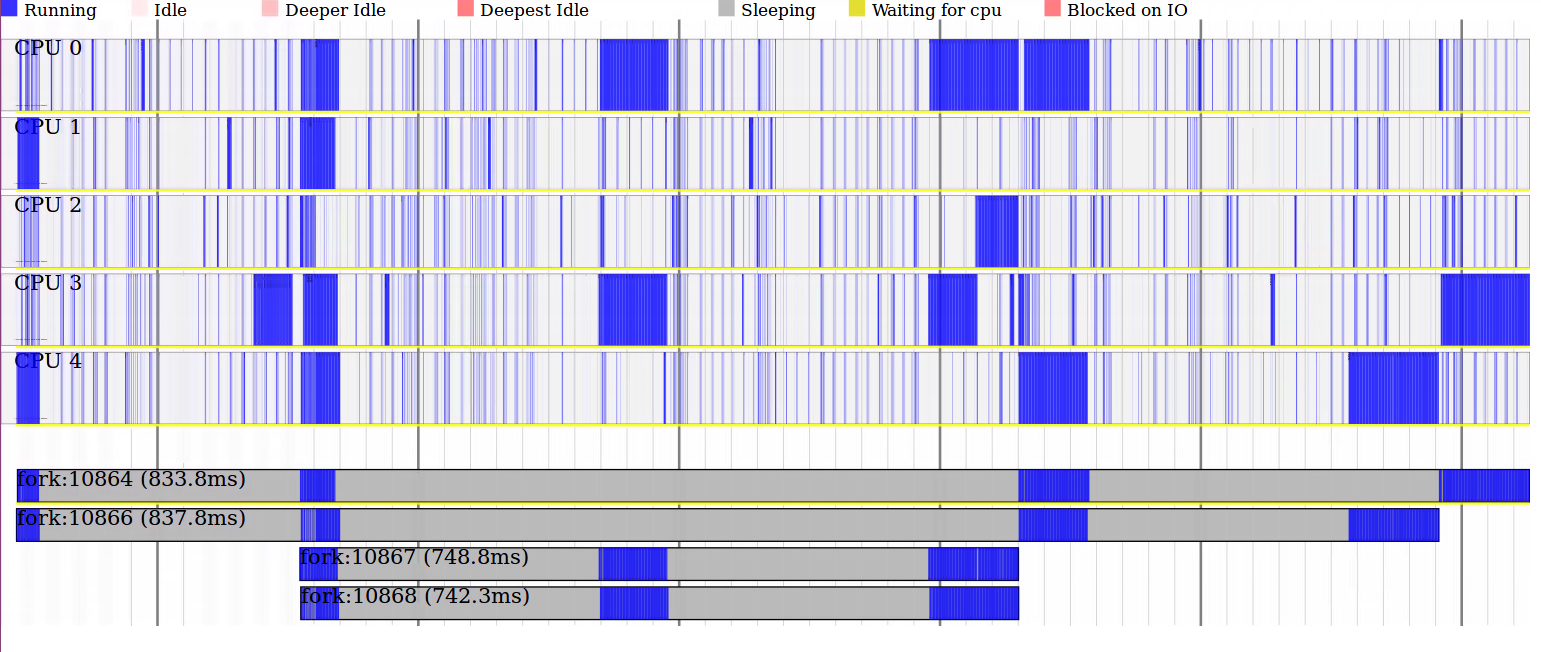
sudo perf timechart record -T ./fork && sudo perf timechart –p fork
结果如下,可以看到相关task的名称,开始时间/结束时间,每个时间点的状态(Running/Idle/Deeper Idle/Deepest Idle/Sleeping/Waiting for Cpu /Blocked on IO)。
3.6.1 结合perf timechart和perf report分析函数占比
由perf report可知test_little、test_medium、test_high、test_hi四个函数占比分别为3.84%、12.01%、22.99%、30.43%。
有代码可知如果以test_little为1单位,那么test_medium就为2单位,test_high为3单位,test_hi为4单位。
四个函数执行次数分别为2、4、4、4,所以四个函数每个单位对应CPU占比为:
test_little - 3.84%/2=1.9%
test_medium - 12.01%/4/2=1.5%
test_high - 22.99/4/3=1.9%
test_hi - 30.43%/4/4=1.9%
基本上符合预期。
记录IO事件,可以看到按应用分类的,Disk/Network/Sync/Poll/Error信息。以及每个应用数据吞吐量。
sudo perf timechart record -I && sudo perf timechart -w 1800。
记录Power状态事件,可以看到不同之处在于Idle之类的状态里面还有细分C/C2更详细的显示Power状态。
sudo perf timechart record -I && sudo perf timechart -w 1800
3.7 perf script
用于读取perf record保存的裸trace数据。
使用方法:
perf script [<options>]
perf script [<options>] record <script> [<record-options>] <command>
perf script [<options>] report <script> [script-args]
perf script [<options>] <script> <required-script-args> [<record-options>] <command>
perf script [<options>] <top-script> [script-args]
还可以编写perl或者python脚本进行数据分析。
3.8 perf lock
3.8.1 perf lock内核配置
要使用此功能,内核需要编译选项的支持:CONFIG_LOCKDEP、CONFIG_LOCK_STAT。
CONFIG_LOCKDEP defines acquired and release events.
CONFIG_LOCK_STAT defines contended and acquired lock events.
CONFIG_LOCKDEP=y
CONFIG_LOCK_STAT=y
3.8.2 perf lock使用
分析内核锁统计信息。
锁是内核用于同步的方法,一旦加了锁,其他加锁的内核执行路径就必须等待,降低了并行。同时,如果加锁不正确还会造成死锁。
因此对于内核锁进行分析是一项重要的调优工作。
perf lock record:抓取执行命令的lock事件信息到perf.data中
perf lock report:产生统计报告
perf lock script:显示原始lock事件
perf lock info:
-k <value>:sorting key,默认为acquired,还可以按contended、wait_total、wait_max和wait_min来排序。
Name:内核锁的名字。
aquired:该锁被直接获得的次数,因为没有其它内核路径占用该锁,此时不用等待。
contended:该锁等待后获得的次数,此时被其它内核路径占用,需要等待。
total wait:为了获得该锁,总共的等待时间。
max wait:为了获得该锁,最大的等待时间。
min wait:为了获得该锁,最小的等待时间。
3.9 perf kmem
3.9.1 perf kmem介绍
perf kmem用于跟踪测量内核slab分配器事件信息。
比如内存分配/释放等。可以用来研究程序在哪里分配了大量内存,或者在什么地方产生碎片之类的和内存管理相关的问题。
perf kmem和perf lock实际上都是perf tracepoint的子类,等同于perf record -e kmem:*和perf record -e lock:*。
但是这些工具在内部队员是数据进行了慧聪和分析,因此统计报表更具可读性。
perf kmem record:抓取命令的内核slab分配器事件
perf kmem stat:生成内核slab分配器统计信息
选项:
--caller 显示每个调用点统计信息
--alloc 显示每次内存分配事件
-s <key[,key2...]>, --sort=<key[,key2...]>
Sort the output (default: frag,hit,bytes for slab and bytes,hit for page). Available sort keys are ptr, callsite, bytes, hit, pingpong, frag for slab and page, callsite, bytes, hit, order, migtype, gfp for page.
This option should be preceded by one of the mode selection options - i.e. --slab, --page, --alloc and/or --caller.-l <num>, 只显示固定行数
--raw-ip
Print raw ip instead of symbol
--slab 分析slab分配器事件
--page 分析页分配事件
--live
Show live page stat. The perf kmem shows total allocation stat by default, but this option shows live (currently allocated) pages instead. (This option works with --page option only)
3.9.2 perf kmem使用
| sudo perf kmem record ls |
sudo perf kmem stat只显示概要统计信息:
| SUMMARY (SLAB allocator) ======================== Total bytes requested: 368,589 Total bytes allocated: 369,424 Total bytes wasted on internal fragmentation: 835 Internal fragmentation: 0.226028% Cross CPU allocations: 0/2,256 |
sudo perf kmem --alloc --caller --slab stat显示了更加详细的分类信息:
|
--------------------------------------------------------------------------------------------------------- --------------------------------------------------------------------------------------------------------- |
该报告有三个部分:根据 Callsite 显示的部分,所谓 Callsite 即内核代码中调用 kmalloc 和 kfree 的地方。
比如上图中的函数proc_reg_open,Hit 栏为 1,表示该函数在 record 期间一共调用了 kmalloc 一次。
对于第一行 Total_alloc/Per 显示为 1024/1024,第一个值 1024 表示函数 proc_reg_open 总共分配的内存大小,Per 表示平均值。
比较有趣的两个参数是 Ping-pong 和 Frag。Frag 比较容易理解,即内部碎片。虽然相对于 Buddy System,Slab 正是要解决内部碎片问题,但 slab 依然存在内部碎片,比如一个 cache 的大小为 1024,但需要分配的数据结构大小为 1022,那么有 2 个字节成为碎片。Frag 即碎片的比例。
Ping-pong 是一种现象,在多 CPU 系统中,多个 CPU 共享的内存会出现”乒乓现象”。一个 CPU 分配内存,其他 CPU 可能访问该内存对象,也可能最终由另外一个 CPU 释放该内存对象。而在多 CPU 系统中,L1 cache 是 per CPU 的,CPU2 修改了内存,那么其他的 CPU 的 cache 都必须更新,这对于性能是一个损失。Perf kmem 在 kfree 事件中判断 CPU 号,如果和 kmalloc 时的不同,则视为一次 ping-pong,理想的情况下 ping-pong 越小越好。Ibm developerworks 上有一篇讲述 oprofile 的文章,其中关于 cache 的调优可以作为很好的参考资料。
Callsite:内核代码中调用kmalloc和kfree的地方。
Total_alloc/Per:总共分配的内存大小,平均每次分配的内存大小。
Total_req/Per:总共请求的内存大小,平均每次请求的内存大小。
Hit:调用的次数。
Ping-pong:kmalloc和kfree不被同一个CPU执行时的次数,这会导致cache效率降低。
Frag:碎片所占的百分比,碎片 = 分配的内存 - 请求的内存,这部分是浪费的。
有使用--alloc选项,还会看到Alloc Ptr,即所分配内存的地址。
后面则有根据被调用地点的显示方式的部分。
最后一个部分是汇总数据,显示总的分配的内存和碎片情况,Cross CPU allocation 即 ping-pong 的汇总。
要分析--page事件,需要在record的时候加上--page选项。sudo perf kmem record --page ls,使用sudo perf kmem stat --page查看结果:
| 0xee318 [0x8]: failed to process type: 68 error during process events: -22 |
3.10 perf sched
perf sched专门用于跟踪/测量调度器,包括延时等。
perf sched record <command>:录制测试过程中的调度事件
perf sched latency:报告线程调度延时和其他调度相关属性
perf sched script:查看执行过程中详细的trace信息
perf sched replay:回放perf sched record录制的执行过程
perf sched map:用字符表示打印上下文切换
执行sudo perf sched record ls后,通过不同方式查看结果。
sudo perf sched latency,可以看到ls进程的Average delay/Maximum delay时间。各个 column 的含义如下: Task: 进程的名字和 pid Runtime: 实际运行时间 Switches: 进程切换的次数 Average delay: 平均的调度延迟 Maximum delay: 最大延迟
这里最值得人们关注的是 Maximum delay,一般从这里可以看到对交互性影响最大的特性:调度延迟,如果调度延迟比较大,那么用户就会感受到视频或者音频断断续续的。
|
----------------------------------------------------------------------------------------------------------------- |
sudo perf sched script能看到更详细的sched信息,包括sched_wakeup/sched_switch等等。每一列的含义依次是:进程名/pid/CPU ID/时间戳。
| perf 7801 [002] 5398.722314: sched:sched_stat_sleep: comm=perf pid=7806 delay=110095391 [ns] perf 7801 [002] 5398.722316: sched:sched_wakeup: comm=perf pid=7806 prio=120 target_cpu=004 swapper 0 [004] 5398.722328: sched:sched_stat_wait: comm=perf pid=7806 delay=0 [ns] swapper 0 [004] 5398.722333: sched:sched_switch: prev_comm=swapper/4 prev_pid=0 prev_prio=120 prev_state=R ==> next_comm=perf next_pid=7806 next_prio=120 perf 7801 [002] 5398.722363: sched:sched_stat_runtime: comm=perf pid=7801 runtime=1255788 [ns] vruntime=3027478102 [ns] perf 7801 [002] 5398.722364: sched:sched_switch: prev_comm=perf prev_pid=7801 prev_prio=120 prev_state=S ==> next_comm=swapper/2 next_pid=0 next_prio=120 perf 7806 [004] 5398.722568: sched:sched_wakeup: comm=migration/4 pid=27 prio=0 target_cpu=004 perf 7806 [004] 5398.722571: sched:sched_stat_runtime: comm=perf pid=7806 runtime=254732 [ns] vruntime=1979611107 [ns] perf 7806 [004] 5398.722575: sched:sched_switch: prev_comm=perf prev_pid=7806 prev_prio=120 prev_state=R+ ==> next_comm=migration/4 next_pid=27 next_prio=0 migration/4 27 [004] 5398.722582: sched:sched_stat_wait: comm=perf pid=7806 delay=13914 [ns] migration/4 27 [004] 5398.722586: sched:sched_migrate_task: comm=perf pid=7806 prio=120 orig_cpu=4 dest_cpu=2 swapper 0 [002] 5398.722595: sched:sched_stat_wait: comm=perf pid=7806 delay=0 [ns] swapper 0 [002] 5398.722596: sched:sched_switch: prev_comm=swapper/2 prev_pid=0 prev_prio=120 prev_state=R ==> next_comm=perf next_pid=7806 next_prio=120 migration/4 27 [004] 5398.722611: sched:sched_switch: prev_comm=migration/4 prev_pid=27 prev_prio=0 prev_state=S ==> next_comm=swapper/4 next_pid=0 next_prio=120 ls 7806 [002] 5398.723421: sched:sched_stat_sleep: comm=kworker/u12:3 pid=7064 delay=1226675 [ns] ls 7806 [002] 5398.723423: sched:sched_wakeup: comm=kworker/u12:3 pid=7064 prio=120 target_cpu=003 swapper 0 [003] 5398.723432: sched:sched_stat_wait: comm=kworker/u12:3 pid=7064 delay=0 [ns] swapper 0 [003] 5398.723434: sched:sched_switch: prev_comm=swapper/3 prev_pid=0 prev_prio=120 prev_state=R ==> next_comm=kworker/u12:3 next_pid=7064 next_prio=120 kworker/u12:3 7064 [003] 5398.723441: sched:sched_stat_sleep: comm=/usr/bin/termin pid=2511 delay=80833386 [ns] kworker/u12:3 7064 [003] 5398.723447: sched:sched_wakeup: comm=/usr/bin/termin pid=2511 prio=120 target_cpu=004 kworker/u12:3 7064 [003] 5398.723449: sched:sched_stat_runtime: comm=kworker/u12:3 pid=7064 runtime=29315 [ns] vruntime=846439549943 [ns] kworker/u12:3 7064 [003] 5398.723451: sched:sched_switch: prev_comm=kworker/u12:3 prev_pid=7064 prev_prio=120 prev_state=S ==> next_comm=swapper/3 next_pid=0 next_prio=120 swapper 0 [004] 5398.723462: sched:sched_stat_wait: comm=/usr/bin/termin pid=2511 delay=0 [ns] swapper 0 [004] 5398.723466: sched:sched_switch: prev_comm=swapper/4 prev_pid=0 prev_prio=120 prev_state=R ==> next_comm=/usr/bin/termin next_pid=2511 next_prio=120 ls 7806 [002] 5398.723503: sched:sched_migrate_task: comm=perf pid=7801 prio=120 orig_cpu=2 dest_cpu=3 ls 7806 [002] 5398.723505: sched:sched_stat_sleep: comm=perf pid=7801 delay=1142537 [ns] ls 7806 [002] 5398.723506: sched:sched_wakeup: comm=perf pid=7801 prio=120 target_cpu=003 ls 7806 [002] 5398.723508: sched:sched_stat_runtime: comm=ls pid=7806 runtime=920005 [ns] vruntime=3028398107 [ns] swapper 0 [003] 5398.723508: sched:sched_stat_wait: comm=perf pid=7801 delay=0 [ns] swapper 0 [003] 5398.723508: sched:sched_switch: prev_comm=swapper/3 prev_pid=0 prev_prio=120 prev_state=R ==> next_comm=perf next_pid=7801 next_prio=120 ls 7806 [002] 5398.723510: sched:sched_switch: prev_comm=ls prev_pid=7806 prev_prio=120 prev_state=x ==> next_comm=swapper/2 next_pid=0 next_prio=120 /usr/bin/termin 2511 [004] 5398.723605: sched:sched_stat_runtime: comm=/usr/bin/termin pid=2511 runtime=162720 [ns] vruntime=191386139371 [ns] /usr/bin/termin 2511 [004] 5398.723611: sched:sched_switch: prev_comm=/usr/bin/termin prev_pid=2511 prev_prio=120 prev_state=S ==> next_comm=swapper/4 next_pid=0 next_prio=120 |
sudo perf sched map的好处在于提供了一个的总的视图,将成百上千的调度事件进行总结,显示了系统任务在 CPU 之间的分布,假如有不好的调度迁移,比如一个任务没有被及时迁移到 idle 的 CPU 却被迁移到其他忙碌的 CPU,类似这种调度器的问题可以从 map 的报告中一眼看出来。
星号表示调度事件发生所在的 CPU。
点号表示该 CPU 正在 IDLE。
| *A0 5398.722333 secs A0 => perf:7806 *. A0 5398.722365 secs . => swapper:0 . *B0 5398.722575 secs B0 => migration/4:27 *A0 B0 5398.722597 secs A0 *. 5398.722611 secs A0 *C0 . 5398.723434 secs C0 => kworker/u12:3:7064 A0 *. . 5398.723451 secs A0 . *D0 5398.723467 secs D0 => /usr/bin/termin:2511 A0 *E0 D0 5398.723509 secs E0 => perf:7801 *. E0 D0 5398.723510 secs . E0 *. 5398.723612 secs |
perf sched replay 这个工具更是专门为调度器开发人员所设计,它试图重放 perf.data 文件中所记录的调度场景。很多情况下,一般用户假如发现调度器的奇怪行为,他们也无法准确说明发生该情形的场景,或者一些测试场景不容易再次重现,或者仅仅是出于“偷懒”的目的,使用 perf replay,perf 将模拟 perf.data 中的场景,无需开发人员花费很多的时间去重现过去,这尤其利于调试过程,因为需要一而再,再而三地重复新的修改是否能改善原始的调度场景所发现的问题。
| run measurement overhead: 166 nsecs sleep measurement overhead: 52177 nsecs the run test took 999975 nsecs the sleep test took 1064623 nsecs nr_run_events: 11 nr_sleep_events: 581 nr_wakeup_events: 5 task 0 ( swapper: 0), nr_events: 11 task 1 ( swapper: 1), nr_events: 1 task 2 ( swapper: 2), nr_events: 1 task 3 ( kthreadd: 3), nr_events: 1 ... task 563 ( kthreadd: 7509), nr_events: 1 task 564 ( bash: 7751), nr_events: 1 task 565 ( man: 7762), nr_events: 1 task 566 ( kthreadd: 7789), nr_events: 1 task 567 ( bash: 7800), nr_events: 1 task 568 ( sudo: 7801), nr_events: 4 task 569 ( perf: 7806), nr_events: 8 ------------------------------------------------------------ #1 : 25.887, ravg: 25.89, cpu: 1919.68 / 1919.68 #2 : 27.994, ravg: 26.10, cpu: 2887.76 / 2016.49 #3 : 26.403, ravg: 26.13, cpu: 2976.09 / 2112.45 #4 : 29.400, ravg: 26.46, cpu: 1015.01 / 2002.70 #5 : 26.750, ravg: 26.49, cpu: 2942.80 / 2096.71 #6 : 27.647, ravg: 26.60, cpu: 3087.37 / 2195.78 #7 : 31.405, ravg: 27.08, cpu: 2762.43 / 2252.44 #8 : 23.770, ravg: 26.75, cpu: 2172.55 / 2244.45 #9 : 26.952, ravg: 26.77, cpu: 2794.93 / 2299.50 #10 : 30.904, ravg: 27.18, cpu: 973.26 / 2166.88 |
3.11 perf probe
Need to find vmlinux XXXXXXXXXXXXXXXXXX
可以自定义探测点。
Define new dynamic tracepoints.
使用例子
(1) Display which lines in schedule() can be probed
# perf probe --line schedule
前面有行号的可以探测,没有行号的就不行了。
(2) Add a probe on schedule() function 12th line.
# perf probe -a schedule:12
在schedule函数的12处增加一个探测点。
3.14 perf trace
perf trace类似于strace,但增加了其他系统事件的分析,比如pagefaults、task lifetime事件、scheduling事件等。
下面的命令可以查看系统中已经安装的脚本:
 # perf trace -l
    List of available trace scripts:
      syscall-counts [comm]                system-wide syscall counts
      syscall-counts-by-pid [comm]         system-wide syscall counts, by pid
      failed-syscalls-by-pid [comm]        system-wide failed syscalls, by pid
比如 failed-syscalls 脚本,执行的效果如下:
 # perf trace record failed-syscalls
    ^C[ perf record: Woken up 11 times to write data ]
    [ perf record: Captured and wrote 1.939 MB perf.data (~84709 samples) ]

 perf trace report failed-syscalls
    perf trace started with Perl script \
	 /root/libexec/perf-core/scripts/perl/failed-syscalls.pl

    failed syscalls, by comm:

    comm                    # errors
    --------------------  ----------
    firefox                     1721
    claws-mail                   149
    konsole                       99
    X                             77
    emacs                         56
    [...]

    failed syscalls, by syscall:

    syscall                           # errors
    ------------------------------  ----------
    sys_read                              2042
    sys_futex                              130
    sys_mmap_pgoff                          71
    sys_access                              33
    sys_stat64                               5
    sys_inotify_add_watch                    4
    [...]
该报表分别按进程和按系统调用显示失败的次数。非常简单明了,而如果通过普通的 perf record 加 perf report 命令,则需要自己手工或者编写脚本来统计这些数字。
4. perf扩展应用
4.1 Flame Graph
1.抓取perf信息并转换
perf record -F 99 -a -g -- sleep 60
perf script > out.perf
./stackcollapse-perf.pl out.perf > out.folded
./flamegraph.pl out.kern_folded > kernel.svg
5. 参考资料
系统级性能分析工具 — Perf:http://blog.csdn.net/zhangskd/article/details/37902159/
linux perf - 性能测试和优化工具:http://www.cnblogs.com/hushaojun/p/4848269.html
Linux下的内核测试工具——perf使用简介:http://www.blogjava.net/qileilove/archive/2013/09/04/403646.html
Perf -- Linux下的系统性能调优工具,第 1 部分:http://www.ibm.com/developerworks/cn/linux/l-cn-perf1/
Perf -- Linux下的系统性能调优工具,第 2 部分:https://www.ibm.com/developerworks/cn/linux/l-cn-perf2/
性能分析工具---Perf简介汇总整理:http://sanwen.net/a/nzsrvoo.html


 浙公网安备 33010602011771号