PyTorch Profiler:简介、主要功能、数据流、环境配置和测试分析@CUDA
1. PyTorch Profiler 简介
1.1 什么是 PyTorch Profiler?
PyTorch Profiler 是官方统一性能分析工具,目标是帮助开发者:
- 精确定位性能瓶颈(CPU/GPU)
- 分析显存使用
- 查看算子执行顺序与耗时
- 分析分布式训练与通信瓶颈
- 输出可视化 trace(TensorBoard / Chrome)
核心组件来自 Kineto,可捕获 Python、C++、CUDA、NCCL、Memory 等层面的事件。
输出 JSON 事件示例:


{
  "schemaVersion": 1,
  "deviceProperties": [
    {
      "id": 0, "name": "NVIDIA GeForce RTX 4090", "totalGlobalMem": 25250627584,
      "computeMajor": 8, "computeMinor": 9,
      "maxThreadsPerBlock": 1024, "maxThreadsPerMultiprocessor": 1536,
      "regsPerBlock": 65536, "warpSize": 32,
      "sharedMemPerBlock": 49152, "numSms": 128
    , "regsPerMultiprocessor": 65536, "sharedMemPerBlockOptin": 101376, "sharedMemPerMultiprocessor": 102400...
  ],
...
  "with_flops": 1,
  "record_shapes": 1,
  "with_stack": 1,
  "profile_memory": 1,
  "traceEvents": [
  {
    "ph": "X", "cat": "cpu_op", "name": "autograd::engine::evaluate_function: NllLossBackward0", "pid": 586214, "tid": 589500,
    "ts": 7700400446421.433, "dur": 124.742,
    "args": {
      "External id": 513,"Record function id": 0, "Sequence number": 32, "Fwd thread id": 1, "Ev Idx": 0
    }
  },
...
  {
    "name": "Record Window End", "ph": "i", "s": "g",
    "pid": "", "tid": "", "ts": 7700400500584.044
  }
  ],
  "traceName": "./logs/training_profile/powerleader_586214.1767000474530444484.pt.trace.json",
  "displayTimeUnit": "ms",
  "baseTimeNanoseconds": 1759300074000000000
}
1.2 核心价值
PyTorch Profiler 的目标是“从算子级别理解 PyTorch 模型在 CPU/GPU 上的真实运行性能瓶颈”。
核心价值总结:
| 价值点 | 说明 |
| 精准定位性能瓶颈 | 自动捕获每一层(算子)的执行时间、内存占用、调用栈,帮助定位最耗时的算子。 |
| 跨设备分析 (CPU/GPU) | 同时支持 CPU、CUDA、ROCm Profiling,查看算子在哪个设备上耗时。 |
| 显存使用追踪 | 记录模型在每一时刻的显存分配与释放,快速发现内存泄漏或溢出。 |
| 多维度可视化分析 | 提供多种可视化后端(TensorBoard、Chrome、Perfetto),支持火焰图、timeline、表格分析等。 |
| 可与训练循环无缝集成 | 可嵌入 training loop 中自动捕获 forward/backward/optimizer step 各阶段性能,支持 schedule 控制(warmup、active)。 |
1.3 支持平台
|
平台
|
支持状态
|
主要后端
|
|
NVIDIA GPU
|
✅ 完整支持
|
CUPTI
|
|
AMD GPU
|
✅ 支持
|
ROCtracer
|
|
Intel GPU
|
✅ 支持
|
VTune/XPU
|
|
CPU
|
✅ 完整支持
|
perf_event
|
2. 主要功能特性
2.1 功能矩阵
| 功能类别 | 具体能力 | 说明 |
| ⏱️ 性能统计 | 分析每个算子耗时(CPU/GPU) | 找出最慢算子 |
| 💾 内存分析 | CPU/GPU 内存分配与释放 | profile_memory=True |
| 📉 时间线追踪 | 多线程/多GPU 时间轴 | Chrome trace / TensorBoard 可视化 |
| 🧩 Kernel 层分析 | CUDA Kernel 执行、重叠情况 | 通过 Kineto 捕获 |
| 🔗 通信分析 | DDP/NCCL 通信开销 | 通信与计算 overlap |
| 🔍 调用栈追踪 | 反向映射到 Python 代码 | with_stack=True |
| 📦 数据加载分析 | DataLoader 线程与 batch 时间 | 发现数据瓶颈 |
| 🔧 自定义事件标记 | torch.profiler.record_function("my_block") | 用于自定义代码块的 profiling |
| 🧭 逐步分析 (schedule) | 定义 warmup/active/skip 阶段 | 控制采样窗口,减少开销 |
| 📊 可视化导出 | TensorBoard / Chrome trace / JSON | 支持多种格式导出 |
| 🔄 分布式模式支持 | 多 rank trace 同步 | 用于多 GPU 训练分析 |
Profiler能分析的主要模块:
| 模块类别 | 内容 | 说明 |
| 🧠 算子 (Operators) | aten::conv2d, aten::matmul, aten::relu 等 | 分析每个算子的执行时间、显存、调用次数 |
| ⚡ GPU Kernel (CUDA Kernels) | CUDA kernel 执行时间线 | 对应 GPU 上的实际执行 kernel,显示 launch、执行时间 |
| 🧩 内存 (Memory) | CPU/GPU 内存分配、释放、峰值 | 启用 profile_memory=True 后追踪 |
| 🔗 通信 (NCCL / Distributed) | ncclAllReduce, ncclBroadcast 等 | 用于多 GPU 分布式训练分析通信开销 |
| 📦 DataLoader / I/O | 数据加载线程、CPU→GPU 数据拷贝 | 分析 I/O 或数据预处理瓶颈 |
| ⚙️ Autograd Engine | 前向/反向计算、梯度计算耗时 | 对每层反向传播开销分析 |
| 🧵 Python 调用栈 | 每个算子的 Python 层调用位置 | 启用 with_stack=True 可追踪 |
| 🕓 时间线 (Timeline) | 多线程/多设备执行时间分布 | 用于可视化各事件交叠与同步 |
| 🌐 分布式 (DDP) | 各 rank 训练时间线对齐分析 | 可发现通信等待或负载不均 |
| 🔬 自定义事件 (Custom Markers) | 用户自定义区域标记 | 用于细分自定义逻辑的耗时 |
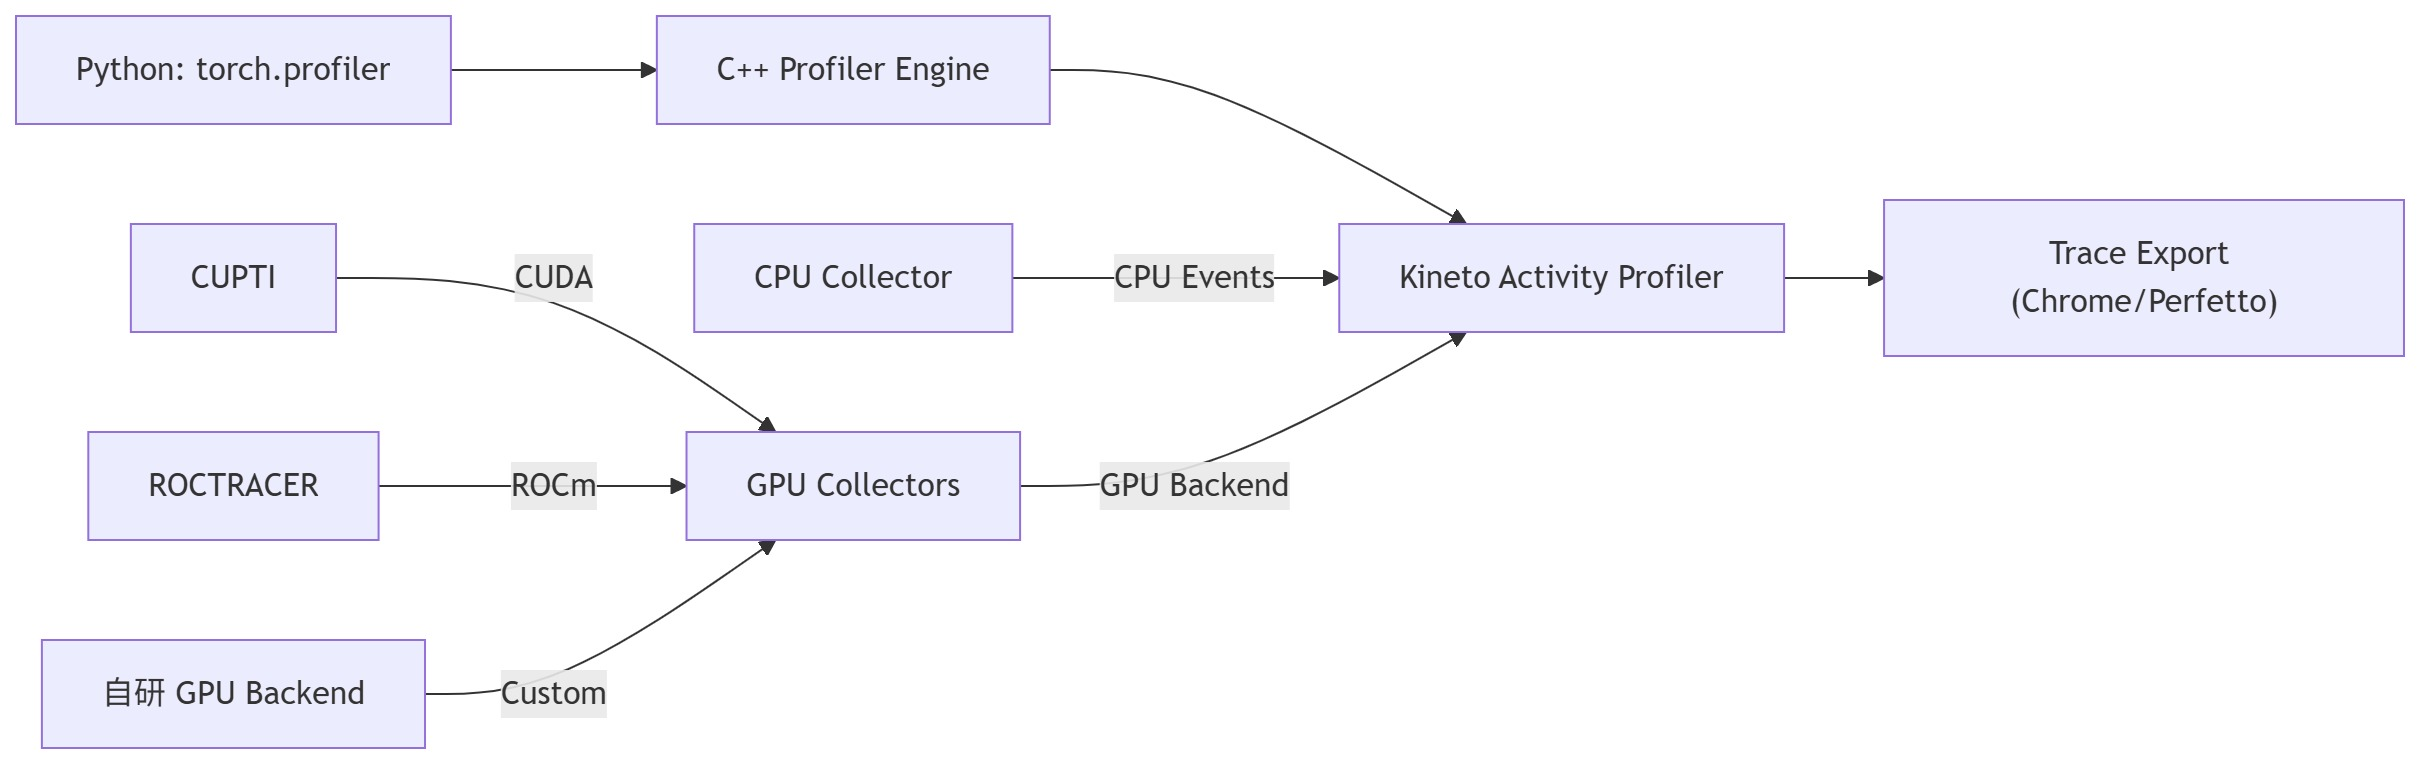
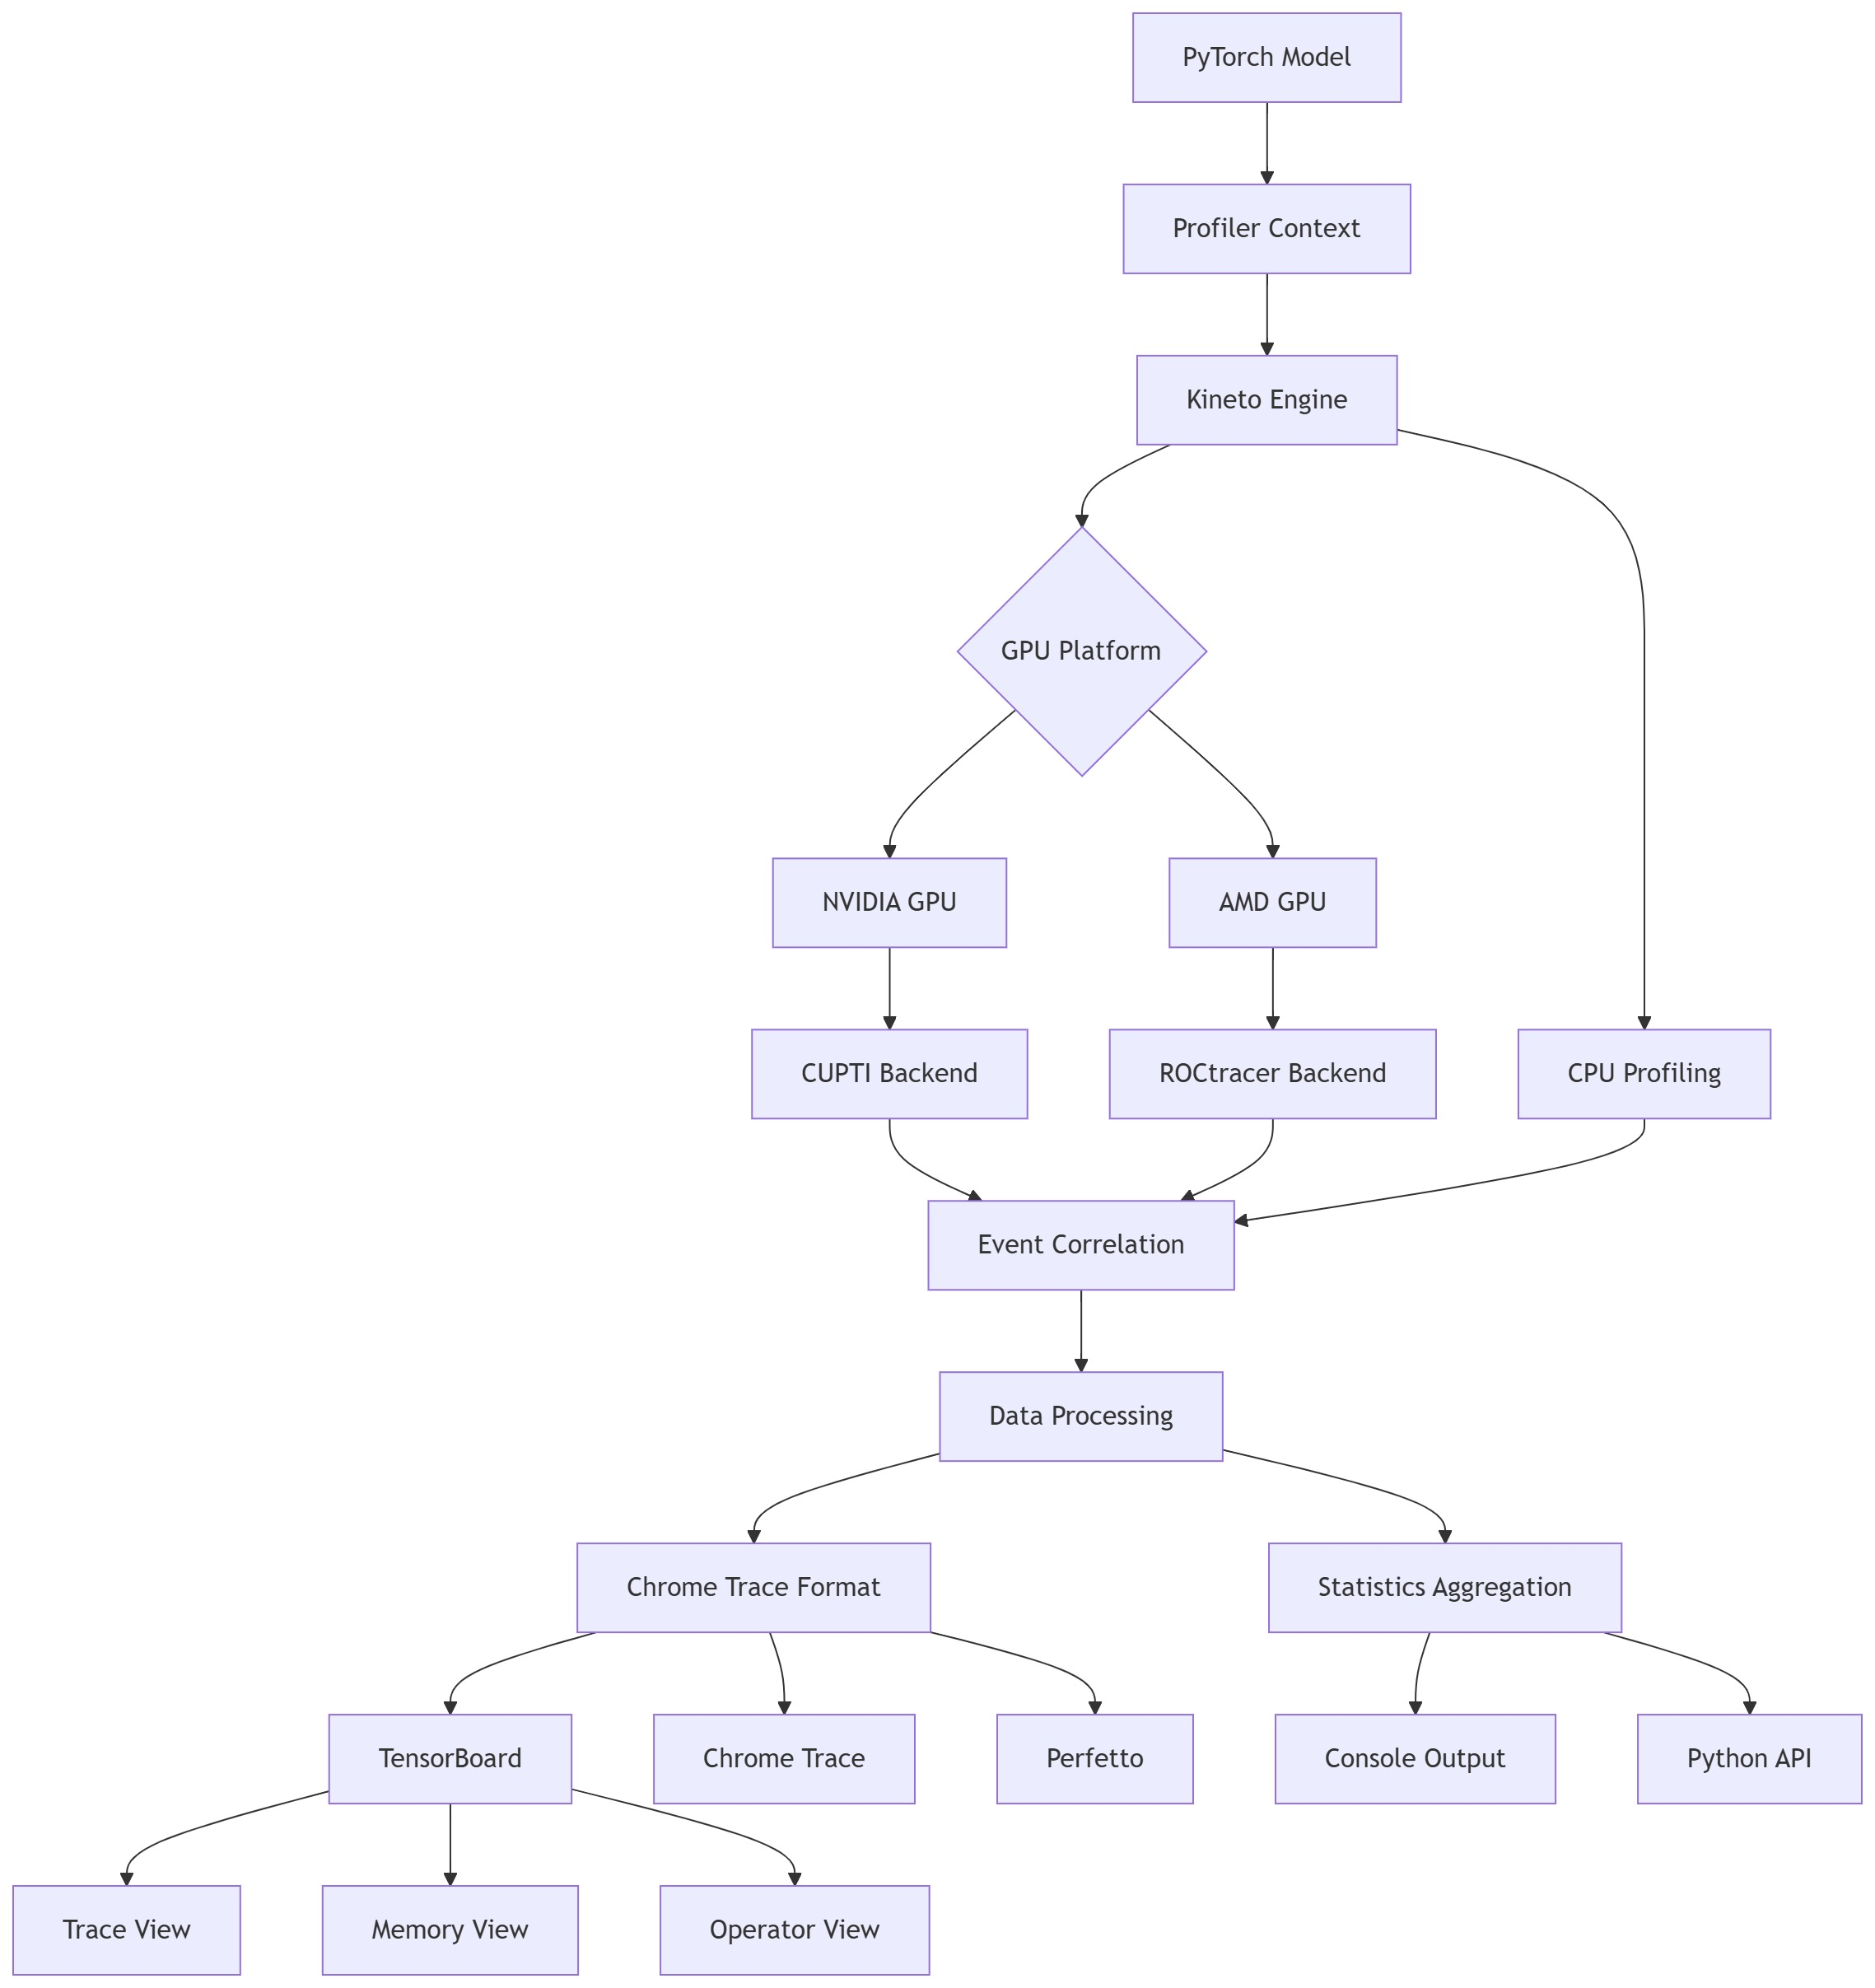
2.2 架构总览
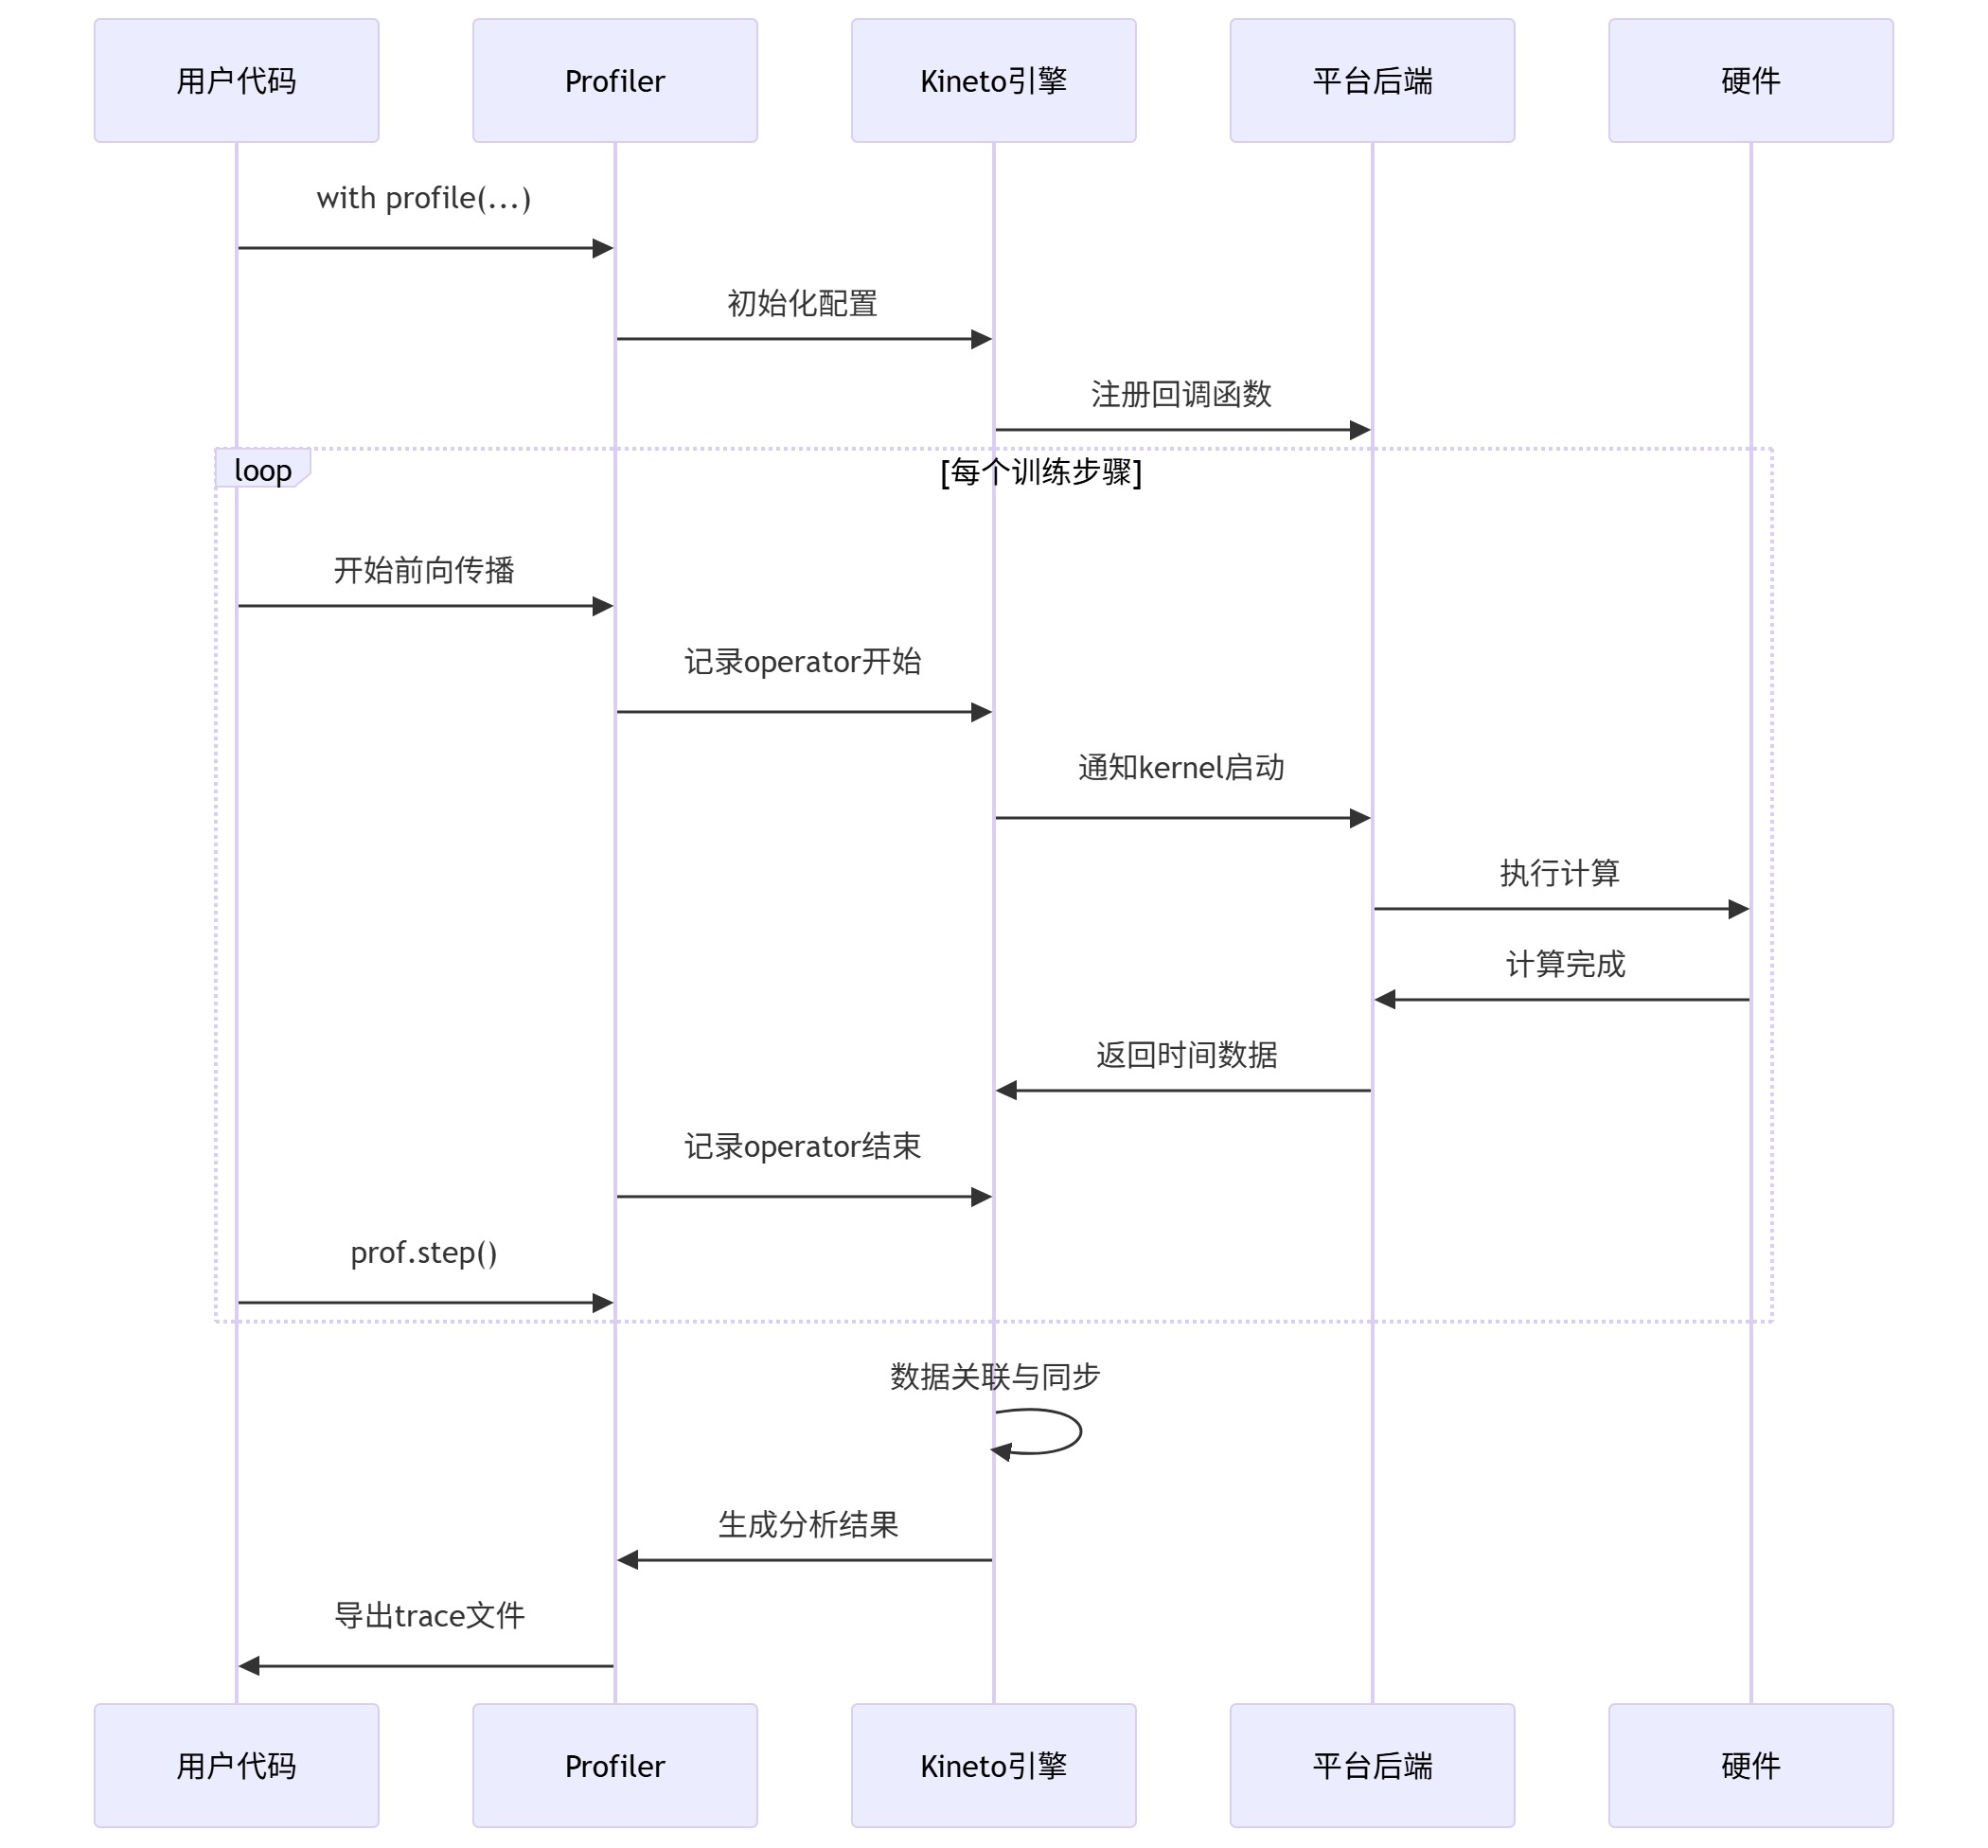
3. 数据收集流程
4. 环境配置与隔离
首先安装Miniconda
4.1 创建隔离的 Python 环境
NVIDIA CUDA 13.0 环境
conda create -n torch-profiler python=3.10 -y
conda activate torch-profiler

pip install --upgrade pip

pip install torch torchvision torchaudio \
  --index-url https://download.pytorch.org/whl/cu121

pip install tensorboard

# 验证安装
python - << 'EOF'
import torch
print("torch:", torch.__version__)
print("compiled cuda:", torch.version.cuda)
print("cuda available:", torch.cuda.is_available())
print("gpu:", torch.cuda.get_device_name(0))
EOF
4.2 环境验证脚本
最小CUDA Kernel Trace,Sanity测试:
import torch
from torch.profiler import profile, ProfilerActivity

x = torch.randn(1024, 1024, device="cuda")

with profile(
    activities=[ProfilerActivity.CPU, ProfilerActivity.CUDA]
) as prof:
    y = x @ x

print(prof.key_averages().table(sort_by="cuda_time_total"))
得到:
-------------------------------------------------------  ------------  ------------  ------------  ------------  ------------  ------------  ------------  ------------  ------------  ------------
                                                   Name    Self CPU %      Self CPU   CPU total %     CPU total  CPU time avg     Self CUDA   Self CUDA %    CUDA total  CUDA time avg    # of Calls
-------------------------------------------------------  ------------  ------------  ------------  ------------  ------------  ------------  ------------  ------------  ------------  ------------
                                           aten::matmul         0.13%      32.038us        99.98%      24.583ms      24.583ms       0.000us         0.00%      48.128us      48.128us             1
                                               aten::mm        32.33%       7.950ms        99.85%      24.551ms      24.551ms      48.128us       100.00%      48.128us      48.128us             1
void cutlass::Kernel<cutlass_80_simt_sgemm_128x64_8x...         0.00%       0.000us         0.00%       0.000us       0.000us      48.128us       100.00%      48.128us      48.128us             1
                                               cudaFree        55.61%      13.675ms        55.61%      13.675ms       6.837ms       0.000us         0.00%       0.000us       0.000us             2
                                 cudaDeviceGetAttribute         0.02%       5.566us         0.02%       5.566us       0.371us       0.000us         0.00%       0.000us       0.000us            15
                                   cudaGetSymbolAddress         0.50%     124.003us         0.50%     124.003us     124.003us       0.000us         0.00%       0.000us       0.000us             1
                                             cudaMalloc         0.83%     203.027us         0.83%     203.027us      67.676us       0.000us         0.00%       0.000us       0.000us             3
cudaOccupancyMaxActiveBlocksPerMultiprocessorWithFla...        10.45%       2.569ms        10.45%       2.569ms       1.285ms       0.000us         0.00%       0.000us       0.000us             2
                                       cudaLaunchKernel         0.10%      24.312us         0.10%      24.312us      24.312us       0.000us         0.00%       0.000us       0.000us             1
                                  cudaDeviceSynchronize         0.02%       5.363us         0.02%       5.363us       5.363us       0.000us         0.00%       0.000us       0.000us             1
-------------------------------------------------------  ------------  ------------  ------------  ------------  ------------  ------------  ------------  ------------  ------------  ------------
Self CPU time total: 24.588ms
Self CUDA time total: 48.128us
环境检测:
# environment_check.py
import torch
import sys

def check_environment():
    print("=" * 50)
    print("Environment Check Report")
    print("=" * 50)

    # Python 环境
    print(f"Python version: {sys.version}")
    print(f"PyTorch version: {torch.__version__}")

    # CUDA/ROCm 环境
    cuda_available = torch.cuda.is_available()
    print(f"CUDA/ROCm available: {cuda_available}")

    if cuda_available:
        print(f"GPU device count: {torch.cuda.device_count()}")
        for i in range(torch.cuda.device_count()):
            print(f"  GPU {i}: {torch.cuda.get_device_name(i)}")
        print(f"CUDA version: {torch.version.cuda}")

        # 测试基本功能
        x = torch.randn(3, 3).cuda()
        y = torch.randn(3, 3).cuda()
        z = x + y
        print(f"GPU computation test: {z.shape}")

    # Profiler 可用性
    try:
        from torch.profiler import profile, ProfilerActivity
        print("Profiler module: ✅ Available")
    except ImportError:
        print("Profiler module: ❌ Not available")

    print("=" * 50)

if __name__ == "__main__":
    check_environment()
得到:
==================================================
Environment Check Report
==================================================
Python version: 3.10.19 (main, Oct 21 2025, 16:43:05) [GCC 11.2.0]
PyTorch version: 2.5.1+cu121
CUDA/ROCm available: True
GPU device count: 2
  GPU 0: NVIDIA GeForce RTX 4090
  GPU 1: NVIDIA GeForce RTX 4090
CUDA version: 12.1
GPU computation test: torch.Size([3, 3])
Profiler module: ✅ Available
==================================================
5. 使用方法详解
5.1 基础使用模式
模式一:简单上下文分析
import torch
import torch.profiler

def simple_profiling():
    model = torch.nn.Linear(1000, 500).cuda()
    x = torch.randn(64, 1000).cuda()

    with torch.profiler.profile(
        activities=[
            torch.profiler.ProfilerActivity.CPU,
            torch.profiler.ProfilerActivity.CUDA,
        ],
        profile_memory=True,
        record_shapes=True
    ) as prof:
        for _ in range(10):
            y = model(x)
            loss = y.sum()
            loss.backward()

    # 控制台查看结果
    print(prof.key_averages().table(
        sort_by="cuda_time_total",
        row_limit=10
    ))

if __name__ == "__main__":
    simple_profiling()
python test_simple_context.py结果如下:
-------------------------------------------------------  ------------  ------------  ------------  ------------  ------------  ------------  ------------  ------------  ------------  ------------  ------------  ------------  ------------  ------------
                                                   Name    Self CPU %      Self CPU   CPU total %     CPU total  CPU time avg     Self CUDA   Self CUDA %    CUDA total  CUDA time avg       CPU Mem  Self CPU Mem      CUDA Mem  Self CUDA Mem    # of Calls
-------------------------------------------------------  ------------  ------------  ------------  ------------  ------------  ------------  ------------  ------------  ------------  ------------  ------------  ------------  ------------  ------------
    autograd::engine::evaluate_function: AddmmBackward0         0.22%     153.712us        14.73%      10.136ms       1.014ms       0.000us         0.00%      91.260us       9.126us           0 b           0 b      27.22 Mb           0 b            10
                                           aten::linear         0.11%      78.697us        45.20%      31.097ms       3.110ms       0.000us         0.00%      73.024us       7.302us           0 b           0 b       9.35 Mb           0 b            10
                                            aten::addmm        12.26%       8.433ms        44.81%      30.830ms       3.083ms      73.024us        29.67%      73.024us       7.302us           0 b           0 b       9.35 Mb       9.35 Mb            10
                                              aten::sum         0.81%     557.580us        20.54%      14.129ms     706.441us      71.168us        28.92%      71.168us       3.558us           0 b           0 b      25.00 Kb      25.00 Kb            20
void at::native::reduce_kernel<512, 1, at::native::R...         0.00%       0.000us         0.00%       0.000us       0.000us      71.168us        28.92%      71.168us       3.558us           0 b           0 b           0 b           0 b            20
                                         AddmmBackward0         0.17%     115.482us        14.08%       9.687ms     968.705us       0.000us         0.00%      62.878us       6.288us           0 b           0 b      27.20 Mb           0 b            10
                                               aten::mm         0.80%     549.090us        13.74%       9.452ms     945.165us      49.023us        19.92%      62.878us       6.288us           0 b           0 b      27.20 Mb      25.98 Mb            10
                        ampere_sgemm_64x32_sliced1x4_tn         0.00%       0.000us         0.00%       0.000us       0.000us      55.455us        22.53%      55.455us       5.545us           0 b           0 b           0 b           0 b            10
                                 ampere_sgemm_32x128_nn         0.00%       0.000us         0.00%       0.000us       0.000us      49.023us        19.92%      49.023us       4.902us           0 b           0 b           0 b           0 b            10
autograd::engine::evaluate_function: torch::autograd...         0.17%     114.779us        13.40%       9.222ms     461.098us       0.000us         0.00%      30.241us       1.512us           0 b           0 b     -17.19 Mb           0 b            20
-------------------------------------------------------  ------------  ------------  ------------  ------------  ------------  ------------  ------------  ------------  ------------  ------------  ------------  ------------  ------------  ------------
Self CPU time total: 68.804ms
Self CUDA time total: 246.111us
模式二:完整训练循环分析
import torch
import torch.nn as nn
from torch.utils.data import DataLoader, TensorDataset

def get_sample_dataloader(batch_size=32):
    """创建示例数据加载器"""
    data = torch.randn(1000, 3, 224, 224)
    targets = torch.randint(0, 10, (1000,))
    dataset = TensorDataset(data, targets)
    return DataLoader(dataset, batch_size=batch_size, shuffle=True)

def build_model():
    """创建简单模型"""
    return nn.Sequential(
        nn.Conv2d(3, 64, kernel_size=3, padding=1),
        nn.ReLU(),
        nn.MaxPool2d(2),
        nn.Conv2d(64, 128, kernel_size=3, padding=1),
        nn.ReLU(),
        nn.AdaptiveAvgPool2d((1, 1)),
        nn.Flatten(),
        nn.Linear(128, 10)
    )

def training_profiling():
    model = build_model().cuda()
    optimizer = torch.optim.Adam(model.parameters())
    dataloader = get_sample_dataloader()

    with torch.profiler.profile(
        activities=[
            torch.profiler.ProfilerActivity.CPU,
            torch.profiler.ProfilerActivity.CUDA,
        ],
        schedule=torch.profiler.schedule(
            wait=1,      # 跳过第1个step
            warmup=1,    # 预热1个step(不记录)
            active=3,    # 记录3个step
            repeat=2     # 重复2轮
        ),
        on_trace_ready=torch.profiler.tensorboard_trace_handler(
            './logs/training_profile'
        ),
        record_shapes=True,
        profile_memory=True,
        with_stack=True,  # 记录调用栈(可定位到代码行)
        with_flops=True   # 估算FLOPs
    ) as prof:
        for step, (inputs, targets) in enumerate(dataloader):
            if step >= 10:  # 只分析前10个step
                break

            inputs, targets = inputs.cuda(), targets.cuda()

            outputs = model(inputs)
            loss = torch.nn.functional.cross_entropy(outputs, targets)

            optimizer.zero_grad()
            loss.backward()
            optimizer.step()

            prof.step()  # 重要:通知profiler步骤完成

    return prof

if __name__ == "__main__":
    prof = training_profiling()
    # 启动TensorBoard查看结果
    print("Run: tensorboard --logdir=./logs/training_profile")
执行结果如下:
5.2 高级使用技巧
5.2.1 自定义代码段标记
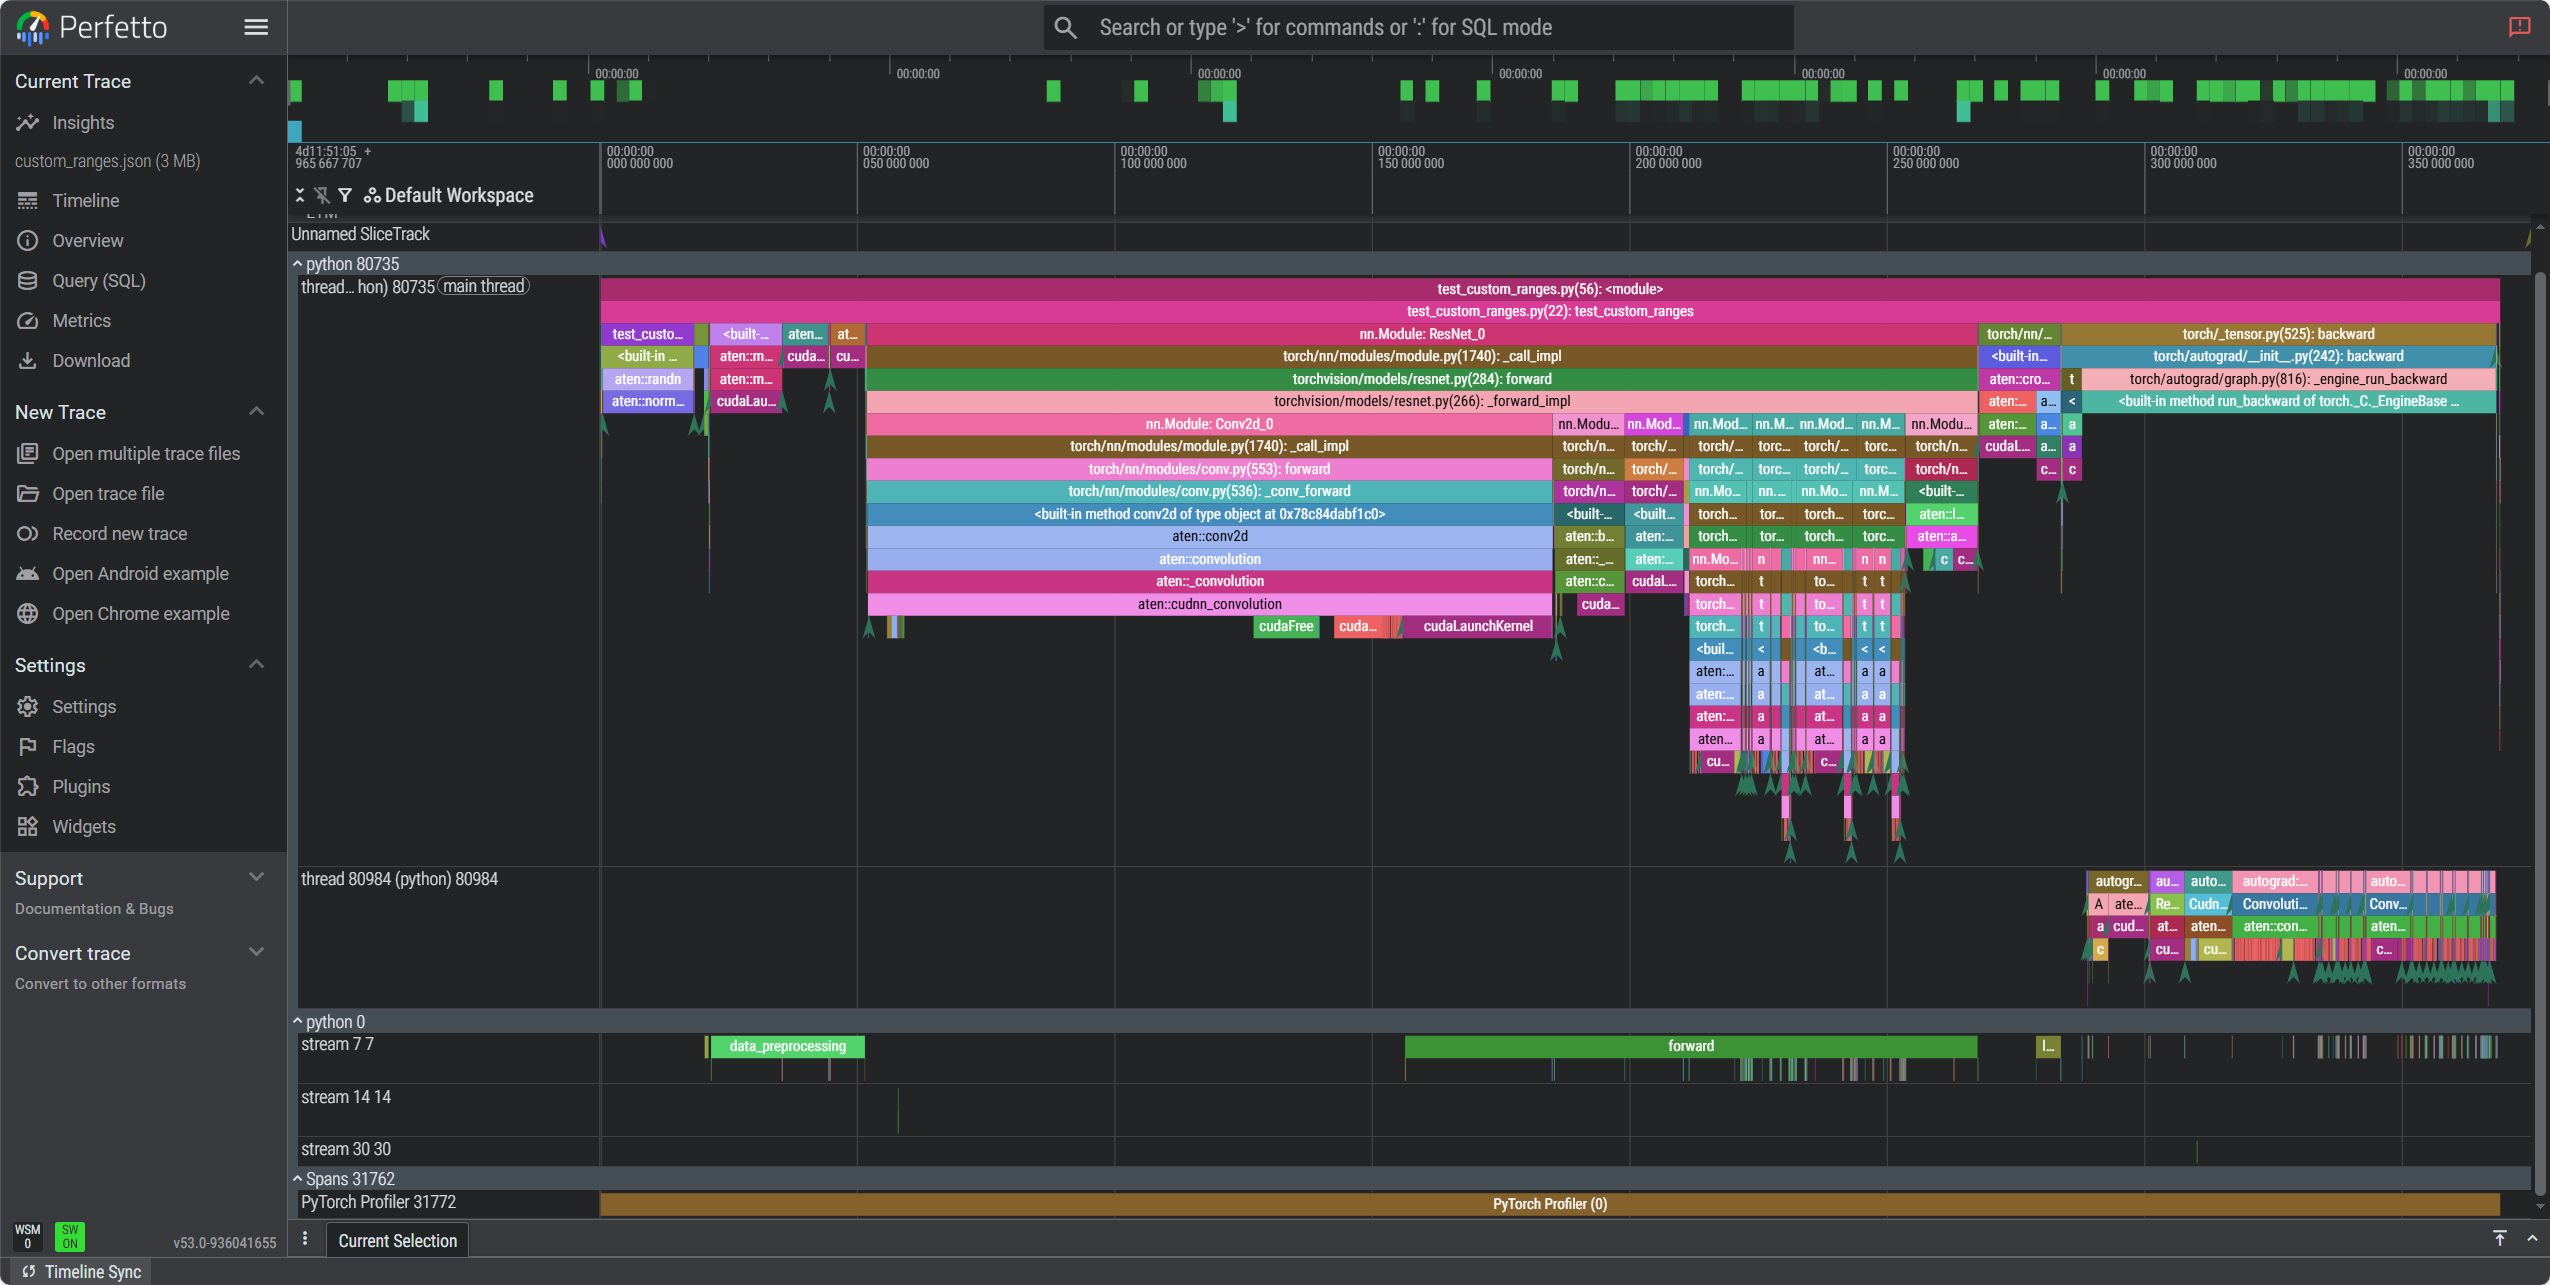
# test_custom_ranges.py
import torch
import torchvision.models as models
from torch.profiler import profile, ProfilerActivity, record_function


def build_model():
    return models.resnet18()


def get_dataloader(batch_size=16):
    x = torch.randn(batch_size, 3, 224, 224)
    y = torch.randint(0, 1000, (batch_size,))
    yield x, y


def test_custom_ranges():
    device = "cuda"
    model = build_model().to(device)
    model.train()

    with profile(
        activities=[ProfilerActivity.CPU, ProfilerActivity.CUDA],
        record_shapes=True,
        profile_memory=True,
        with_stack=True,
    ) as prof:

        for x, y in get_dataloader():
            x, y = x.to(device), y.to(device)

            with record_function("data_preprocessing"):
                x = (x - x.mean()) / x.std()

            with record_function("model_inference"):
                with record_function("forward"):
                    out = model(x)
                with record_function("loss"):
                    loss = torch.nn.functional.cross_entropy(out, y)

            with record_function("backward"):
                loss.backward()

            break  # 只跑一个 batch

    prof.export_chrome_trace("custom_ranges.json")
    print("Exported custom_ranges.json")

    print(
        prof.key_averages()
        .table(sort_by="cuda_time_total", row_limit=10)
    )


if __name__ == "__main__":
    test_custom_ranges()
测试结果如下:
Exported custom_ranges.json
-------------------------------------------------------  ------------  ------------  ------------  ------------  ------------  ------------  ------------  ------------  ------------  ------------  ------------  ------------  ------------  ------------
                                                   Name    Self CPU %      Self CPU   CPU total %     CPU total  CPU time avg     Self CUDA   Self CUDA %    CUDA total  CUDA time avg       CPU Mem  Self CPU Mem      CUDA Mem  Self CUDA Mem    # of Calls
-------------------------------------------------------  ------------  ------------  ------------  ------------  ------------  ------------  ------------  ------------  ------------  ------------  ------------  ------------  ------------  ------------
                                                forward         0.00%       0.000us         0.00%       0.000us       0.000us     111.210ms      1517.90%     111.210ms      55.605ms           0 b           0 b           0 b           0 b             2
                                     data_preprocessing         0.00%       0.000us         0.00%       0.000us       0.000us      29.841ms       407.30%      29.841ms      29.841ms           0 b           0 b           0 b           0 b             1
                                                   loss         0.00%       0.000us         0.00%       0.000us       0.000us       4.794ms        65.43%       4.794ms       4.794ms           0 b           0 b           0 b           0 b             1
autograd::engine::evaluate_function: ConvolutionBack...         0.08%     353.866us        10.43%      46.475ms       2.324ms       0.000us         0.00%       3.573ms     178.654us           0 b           0 b     -54.71 Mb    -223.25 Mb            20
                                   ConvolutionBackward0         0.04%     188.077us        10.31%      45.948ms       2.297ms       0.000us         0.00%       3.472ms     173.601us           0 b           0 b     168.54 Mb           0 b            20
                             aten::convolution_backward         3.16%      14.065ms        10.27%      45.760ms       2.288ms       3.472ms        47.39%       3.472ms     173.601us           0 b           0 b     168.54 Mb     124.56 Mb            20
                                        model_inference         0.02%      91.217us        52.06%     232.036ms     232.036ms       0.000us         0.00%       1.977ms       1.977ms           0 b           0 b     341.13 Mb           0 b             1
                                                forward         0.83%       3.694ms        48.43%     215.872ms     215.872ms       0.000us         0.00%       1.973ms       1.973ms           0 b           0 b     341.07 Mb     -10.94 Mb             1
                                           aten::conv2d         0.02%     110.351us        37.87%     168.806ms       8.440ms       0.000us         0.00%       1.459ms      72.973us           0 b           0 b     153.44 Mb           0 b            20
                                      aten::convolution         0.07%     291.180us        37.85%     168.696ms       8.435ms       0.000us         0.00%       1.459ms      72.973us           0 b           0 b     153.44 Mb           0 b            20
-------------------------------------------------------  ------------  ------------  ------------  ------------  ------------  ------------  ------------  ------------  ------------  ------------  ------------  ------------  ------------  ------------
Self CPU time total: 445.709ms
Self CUDA time total: 7.327ms
5.2.2 内存泄漏调试
# test_memory_debug.py
import torch
import torchvision.models as models
from torch.profiler import profile, ProfilerActivity


def build_model():
    return models.resnet18()


def get_dataloader(batch_size=32, steps=5):
    for _ in range(steps):
        x = torch.randn(batch_size, 3, 224, 224)
        y = torch.randint(0, 1000, (batch_size,))
        yield x, y


def test_memory_debug():
    device = "cuda"

    # 开启 CUDA allocator 记录
    torch.cuda.memory._record_memory_history(True)

    try:
        model = build_model().to(device)
        optimizer = torch.optim.Adam(model.parameters(), lr=1e-3)

        with profile(
            activities=[ProfilerActivity.CPU, ProfilerActivity.CUDA],
            profile_memory=True,
            with_stack=True,
            record_shapes=True,
        ) as prof:

            for epoch in range(3):
                for x, y in get_dataloader():
                    x, y = x.to(device), y.to(device)

                    out = model(x)
                    loss = torch.nn.functional.cross_entropy(out, y)

                    optimizer.zero_grad()
                    loss.backward()
                    optimizer.step()

                print(
                    f"[Epoch {epoch}] "
                    f"allocated={torch.cuda.memory_allocated() / 1024**2:.1f} MB, "
                    f"peak={torch.cuda.max_memory_allocated() / 1024**2:.1f} MB"
                )

    finally:
        torch.cuda.memory._dump_snapshot("memory_snapshot.pickle")
        torch.cuda.memory._record_memory_history(False)
        print("Saved memory_snapshot.pickle")

    print(
        prof.key_averages()
        .table(sort_by="self_cuda_memory_usage", row_limit=10)
    )


if __name__ == "__main__":
    test_memory_debug()
使用python -m torch.utils._memory_viz memory_snapshot.pickle查看结果。
5.3 结果导出与分析
import torch
import torch.nn as nn
from torch.utils.data import DataLoader, TensorDataset

def get_sample_dataloader(batch_size=32):
    """创建示例数据加载器"""
    data = torch.randn(1000, 3, 224, 224)
    targets = torch.randint(0, 10, (1000,))
    dataset = TensorDataset(data, targets)
    return DataLoader(dataset, batch_size=batch_size, shuffle=True)

def build_model():
    """创建简单模型"""
    return nn.Sequential(
        nn.Conv2d(3, 64, kernel_size=3, padding=1),
        nn.ReLU(),
        nn.MaxPool2d(2),
        nn.Conv2d(64, 128, kernel_size=3, padding=1),
        nn.ReLU(),
        nn.AdaptiveAvgPool2d((1, 1)),
        nn.Flatten(),
        nn.Linear(128, 10)
    )

def training_profiling():
    model = build_model().cuda()
    optimizer = torch.optim.Adam(model.parameters())
    dataloader = get_sample_dataloader()

    with torch.profiler.profile(
        activities=[
            torch.profiler.ProfilerActivity.CPU,
            torch.profiler.ProfilerActivity.CUDA,
        ],
        schedule=torch.profiler.schedule(
            wait=1,      # 跳过第1个step
            warmup=1,    # 预热1个step(不记录)
            active=3,    # 记录3个step
            repeat=2     # 重复2轮
        ),
        on_trace_ready=torch.profiler.tensorboard_trace_handler(
            './logs/training_profile'
        ),
        record_shapes=True,
        profile_memory=True,
        with_stack=True,  # 记录调用栈(可定位到代码行)
        with_flops=True   # 估算FLOPs
    ) as prof:
        for step, (inputs, targets) in enumerate(dataloader):
            if step >= 10:  # 只分析前10个step
                break

            inputs, targets = inputs.cuda(), targets.cuda()

            outputs = model(inputs)
            loss = torch.nn.functional.cross_entropy(outputs, targets)

            optimizer.zero_grad()
            loss.backward()
            optimizer.step()

            prof.step()  # 重要:通知profiler步骤完成

    return prof
def safe_analyze_results(prof):
    """完全安全的分析函数 - 兼容所有PyTorch版本"""

    print("=" * 80)
    print("PYTORCH PROFILER SAFE ANALYSIS REPORT")
    print("=" * 80)

    # 1. 首先检查可用的属性
    sample_event = None
    for event in prof.key_averages():
        sample_event = event
        break

    if sample_event:
        print("🔍 Available event attributes:")
        for attr in dir(sample_event):
            if not attr.startswith('_') and not callable(getattr(sample_event, attr)):
                value = getattr(sample_event, attr)
                if value and attr in ['cpu_time_total', 'cuda_time_total', 'key', 'count']:
                    print(f"  {attr}: {value}")

    # 2. 使用表格输出(最兼容的方法)
    print("\n🔹 Performance Summary Table:")
    print("-" * 60)
    table_output = prof.key_averages().table(sort_by="cpu_time_total", row_limit=10)
    print(table_output)

    # 3. 手动计算统计信息
    print(f"\n📊 Manual Statistics:")
    total_events = list(prof.key_averages())

    total_cpu_time = 0
    total_cuda_time = 0
    event_count = 0

    for event in total_events:
        event_count += 1
        # 安全地获取CPU时间
        if hasattr(event, 'cpu_time_total'):
            total_cpu_time += event.cpu_time_total
        # 安全地获取CUDA时间 - 尝试不同的属性名
        cuda_time = 0
        if hasattr(event, 'cuda_time_total'):
            cuda_time = event.cuda_time_total
        elif hasattr(event, 'cuda_time_total'):  # 旧版本拼写
            cuda_time = event.cuda_time_total
        elif hasattr(event, 'self_cuda_time_total'):
            cuda_time = event.self_cuda_time_total

        total_cuda_time += cuda_time

    print(f"  Total events processed: {event_count}")
    print(f"  Total CPU time: {total_cpu_time / 1000:.2f} ms")
    print(f"  Total CUDA time: {total_cuda_time / 1000:.2f} ms")

    total_time = total_cpu_time + total_cuda_time
    if total_time > 0:
        cpu_percent = (total_cpu_time / total_time) * 100
        cuda_percent = (total_cuda_time / total_time) * 100
        print(f"  CPU percentage: {cpu_percent:.1f}%")
        print(f"  CUDA percentage: {cuda_percent:.1f}%")

    # 4. 内存统计
    print(f"\n💾 Memory Statistics:")
    current_memory = torch.cuda.memory_allocated() / 1024**2
    max_memory = torch.cuda.max_memory_allocated() / 1024**2
    print(f"  Current GPU memory: {current_memory:.2f} MB")
    print(f"  Peak GPU memory: {max_memory:.2f} MB")

    # 5. 导出结果
    try:
        prof.export_chrome_trace("trace.json")
        print(f"\n💾 Chrome trace exported to: trace.json")
    except Exception as e:
        print(f"⚠️  Could not export trace: {e}")

    print("=" * 80)
    return {
        'total_cpu_time': total_cpu_time,
        'total_cuda_time': total_cuda_time,
        'peak_memory_mb': max_memory
    }

# 使用示例
if __name__ == "__main__":
    prof = training_profiling()
    safe_analyze_results(prof)
6. NVIDIA GPU (CUDA 13.0) 实测示例
6.1 ResNet50 深度性能分析
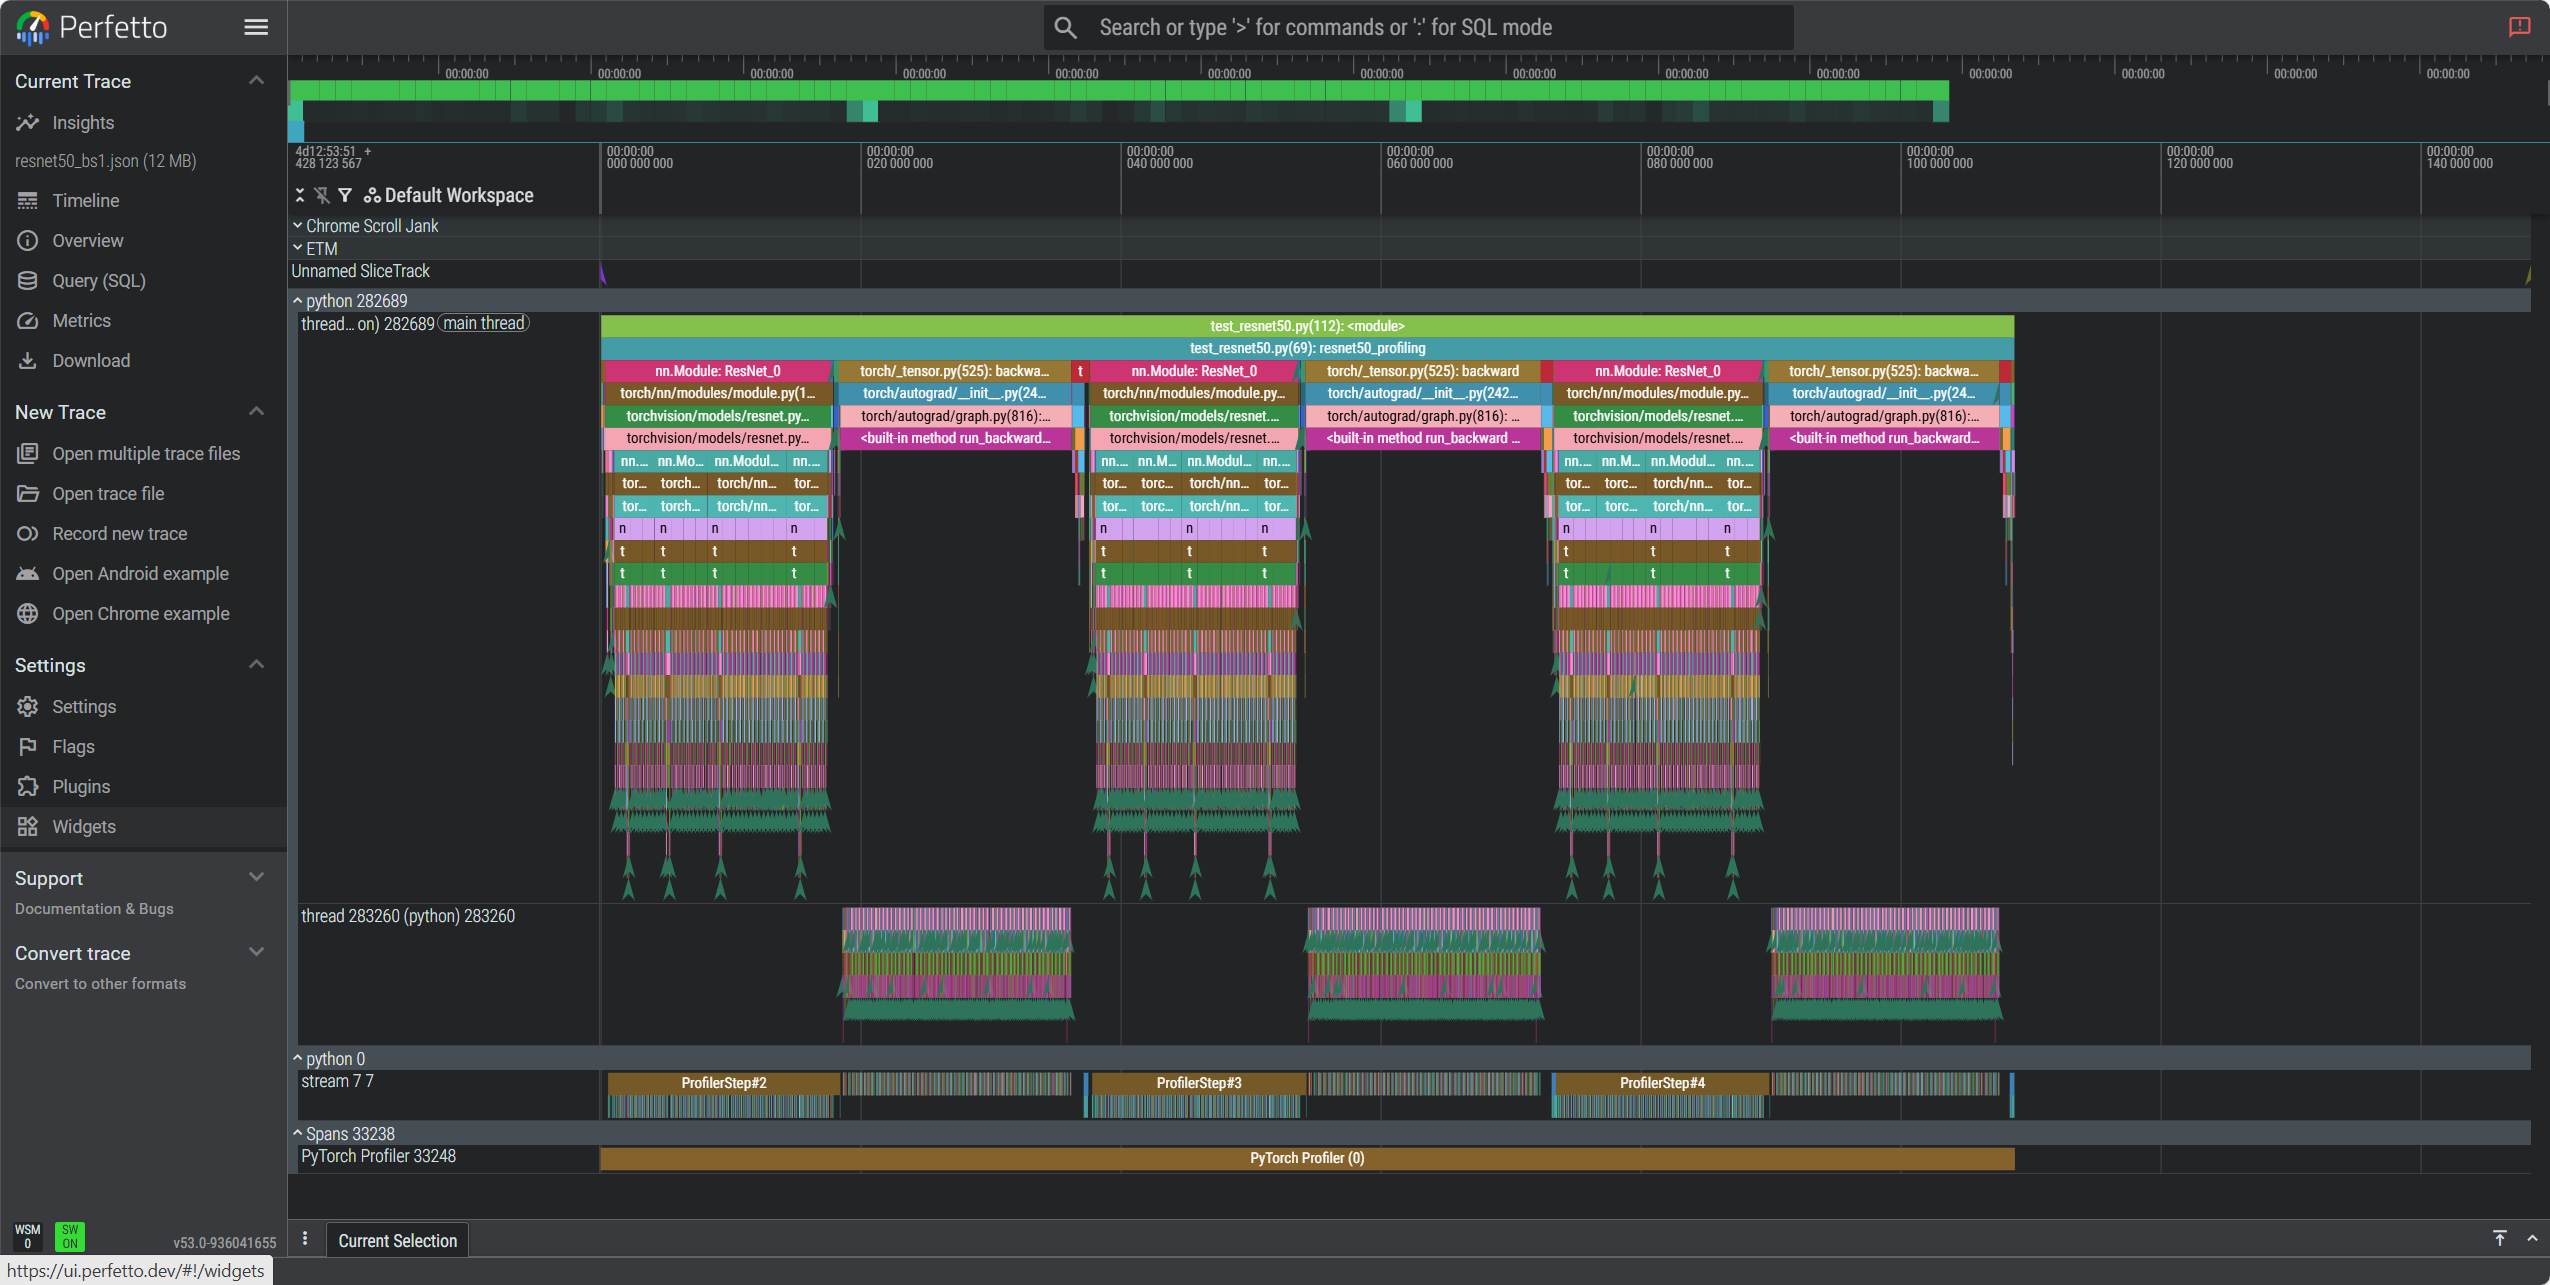
import torch
import torchvision.models as models
import torch.profiler
import time
import os

def ensure_dir(path):
    os.makedirs(path, exist_ok=True)
    return path

def resnet50_profiling(batch_sizes=[1, 2, 4]):
    device = torch.device('cuda' if torch.cuda.is_available() else 'cpu')
    print(f"Device: {device}")

    if torch.cuda.is_available():
        print(f"GPU: {torch.cuda.get_device_name()}")

    results = {}

    for batch_size in batch_sizes:
        print(f"\nBatch Size: {batch_size}")

        model = models.resnet50().to(device)
        model.train()

        inputs = torch.randn(batch_size, 3, 224, 224).to(device)
        targets = torch.randint(0, 1000, (batch_size,)).to(device)

        optimizer = torch.optim.SGD(model.parameters(), lr=0.01)
        criterion = torch.nn.CrossEntropyLoss()

        # 预热
        for i in range(2):
            outputs = model(inputs)
            loss = criterion(outputs, targets)
            optimizer.zero_grad()
            loss.backward()
            optimizer.step()

        if torch.cuda.is_available():
            torch.cuda.synchronize()
            torch.cuda.reset_peak_memory_stats()

        # 性能分析
        start_time = time.time()

        chrome_trace_file = f'./profiling_results/resnet50_bs{batch_size}.json'
        ensure_dir('./profiling_results')

        with torch.profiler.profile(
            activities=[
                torch.profiler.ProfilerActivity.CPU,
                torch.profiler.ProfilerActivity.CUDA,
            ] if torch.cuda.is_available() else [
                torch.profiler.ProfilerActivity.CPU,
            ],
            schedule=torch.profiler.schedule(wait=1, warmup=1, active=3, repeat=1),
            record_shapes=True,
            profile_memory=True,
            with_stack=True,
        ) as prof:

            for step in range(5):
                outputs = model(inputs)
                loss = criterion(outputs, targets)
                optimizer.zero_grad()
                loss.backward()
                optimizer.step()
                prof.step()

        prof.export_chrome_trace(chrome_trace_file)

        end_time = time.time()

        if torch.cuda.is_available():
            peak_memory = torch.cuda.max_memory_allocated() / 1024**3
        else:
            peak_memory = 0

        total_time = end_time - start_time
        throughput = batch_size / total_time if total_time > 0 else 0

        # 性能分析
        events = prof.key_averages()
        cpu_time = sum(getattr(event, 'cpu_time_total', 0) for event in events) / 1000
        cuda_time = sum(getattr(event, 'cuda_time_total', 0) for event in events) / 1000

        results[batch_size] = {
            'total_time': total_time,
            'throughput': throughput,
            'peak_memory_gb': peak_memory,
            'cpu_time_ms': cpu_time,
            'cuda_time_ms': cuda_time,
            'chrome_trace': chrome_trace_file
        }

        print(f"Time: {total_time:.3f}s, Throughput: {throughput:.1f} samples/s")
        print(f"Memory: {peak_memory:.3f} GB, CPU: {cpu_time:.1f}ms, CUDA: {cuda_time:.1f}ms")
        print(f"Trace: {chrome_trace_file}")

    return results

def print_summary(results):
    print(f"\n{'Batch':<8} {'Time(s)':<10} {'Throughput':<12} {'Memory(GB)':<12} {'CPU(ms)':<10} {'CUDA(ms)':<10}")
    print("-" * 70)

    for batch_size, result in sorted(results.items()):
        print(f"{batch_size:<8} {result['total_time']:<10.3f} {result['throughput']:<12.1f} "
              f"{result['peak_memory_gb']:<12.3f} {result['cpu_time_ms']:<10.1f} {result['cuda_time_ms']:<10.1f}")

if __name__ == "__main__":
    results = resnet50_profiling([1, 2, 4])
    print_summary(results)
6.3 NVIDIA 平台典型分析结果
控制台输出:
Device: cuda
GPU: NVIDIA GeForce RTX 4090

Batch Size: 1
Time: 0.514s, Throughput: 1.9 samples/s
Memory: 0.301 GB, CPU: 247.0ms, CUDA: 0.0ms
Trace: ./profiling_results/resnet50_bs1.json

Batch Size: 2
Time: 0.502s, Throughput: 4.0 samples/s
Memory: 0.389 GB, CPU: 260.7ms, CUDA: 0.0ms
Trace: ./profiling_results/resnet50_bs2.json

Batch Size: 4
Time: 0.472s, Throughput: 8.5 samples/s
Memory: 0.548 GB, CPU: 263.2ms, CUDA: 0.0ms
Trace: ./profiling_results/resnet50_bs4.json

Batch    Time(s)    Throughput   Memory(GB)   CPU(ms)    CUDA(ms)
----------------------------------------------------------------------
1        0.514      1.9          0.301        247.0      0.0
2        0.502      4.0          0.389        260.7      0.0
4        0.472      8.5          0.548        263.2      0.0
PyTorch Profiler 火焰图总结:
- 横轴宽度:表示函数耗时占比,越宽越可能是瓶颈。
- 纵轴深度:表示函数调用栈层次。
- 颜色:仅用于区分函数,无性能含义。
分析重点:
- 找最宽的函数:定位耗时最多的操作。
- 关注数据加载、模型计算、GPU 同步等关键环节。
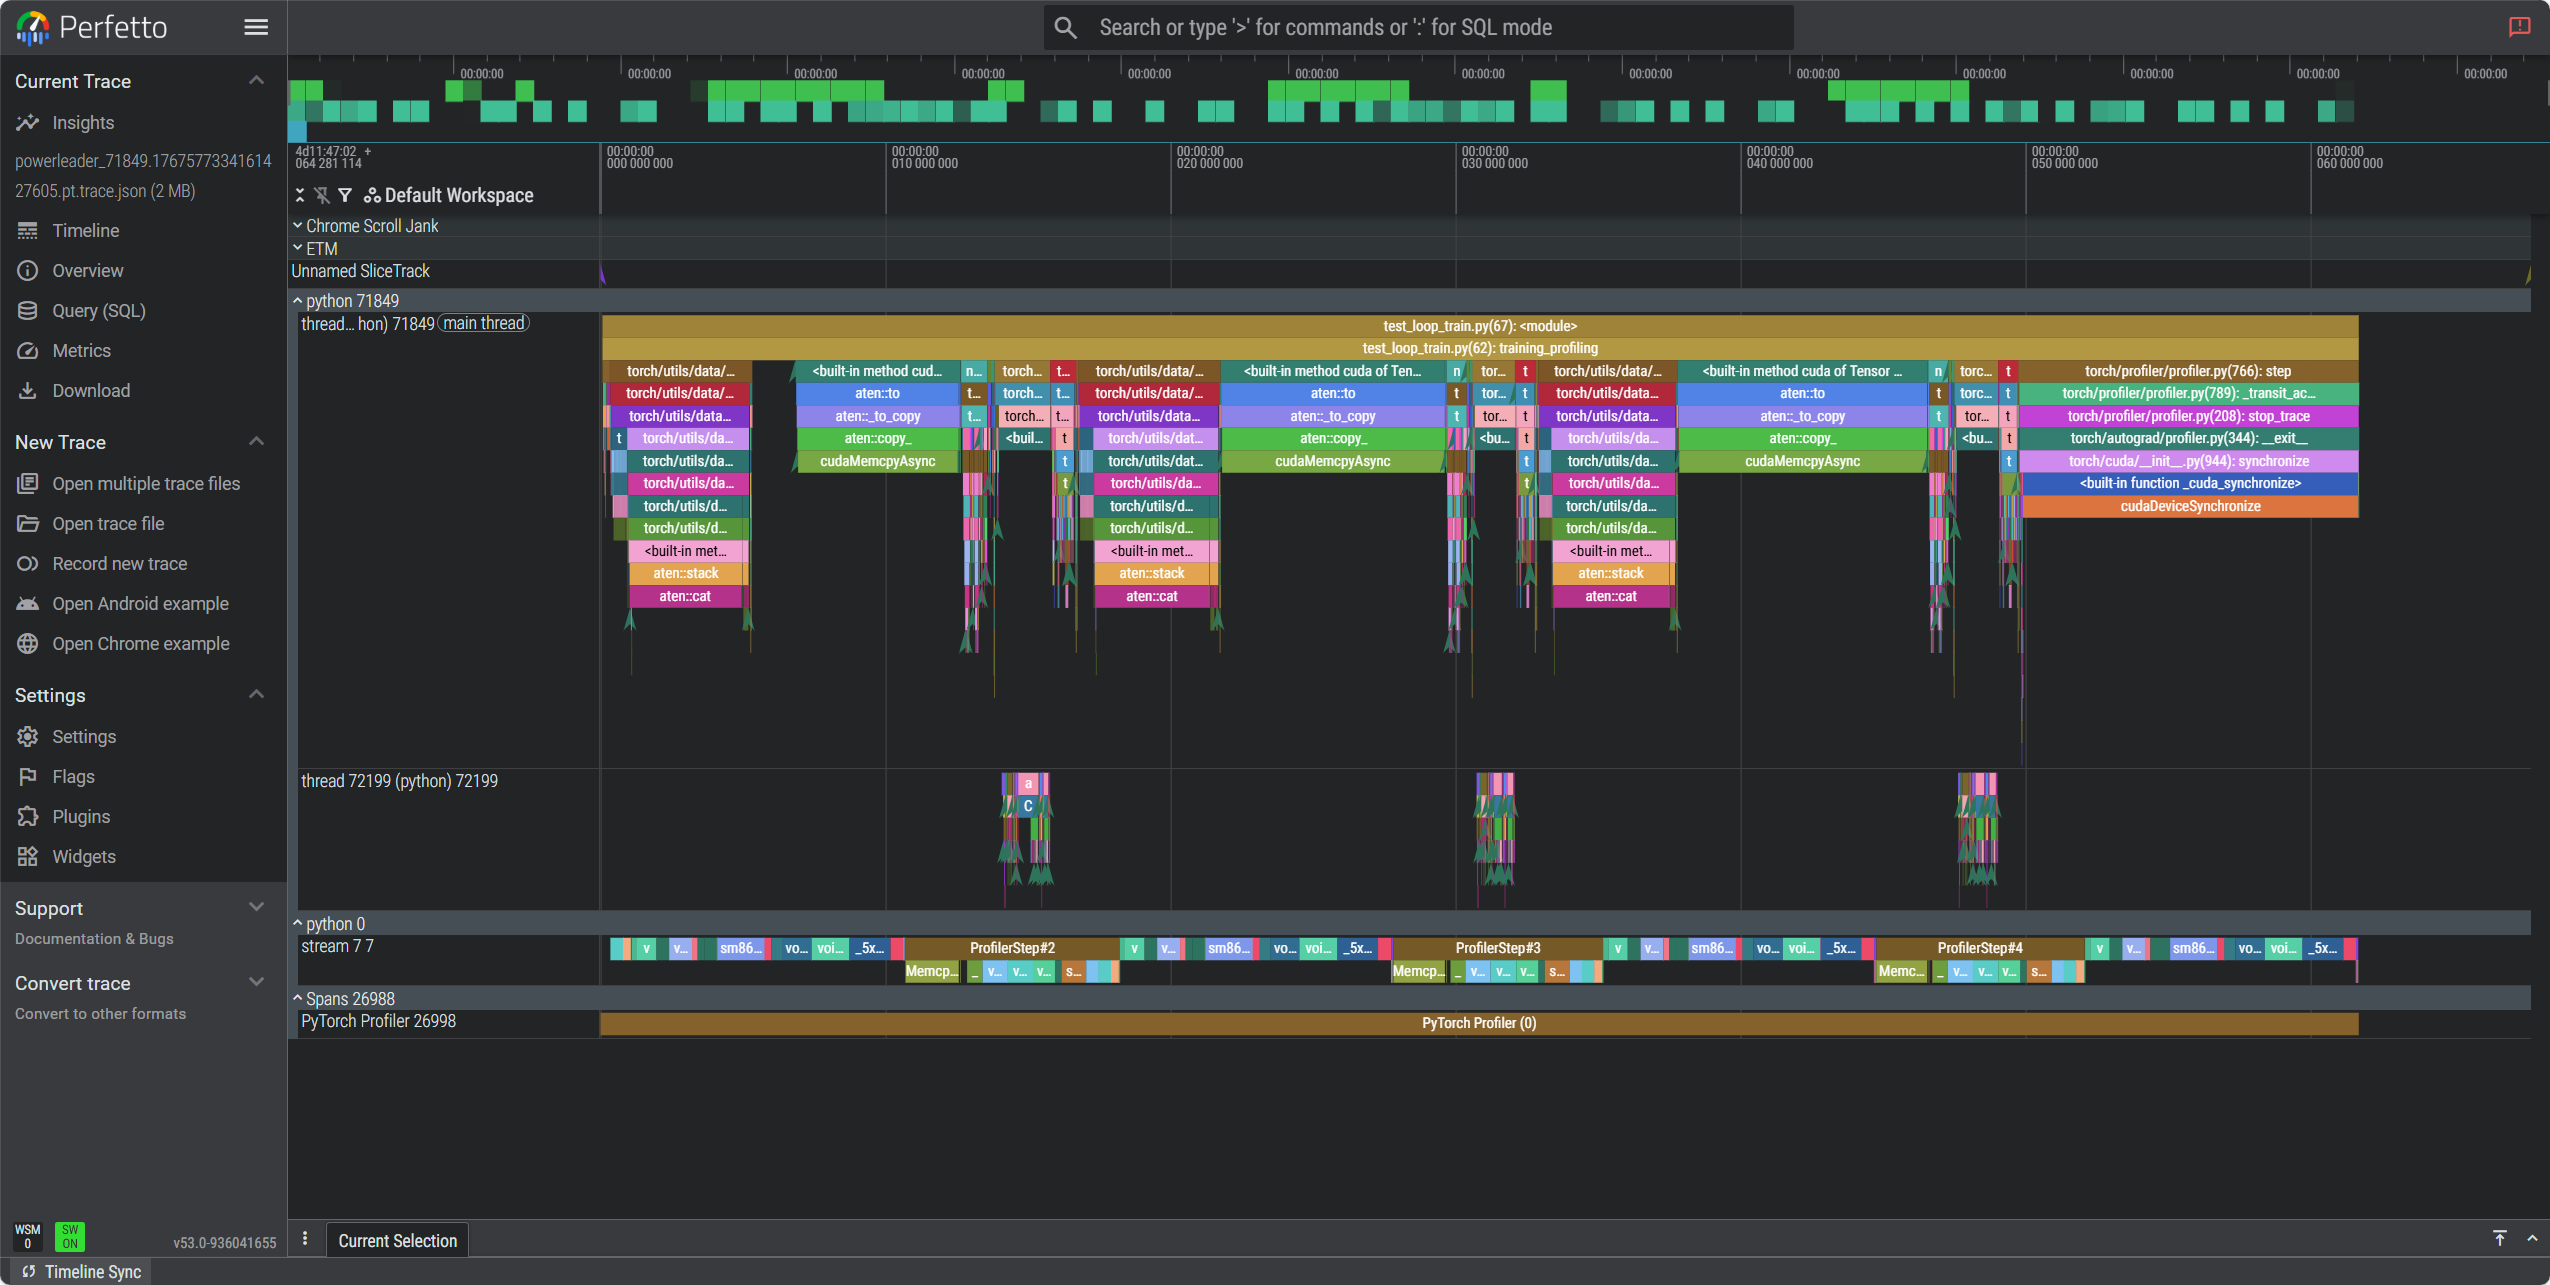
在https://ui.perfetto.dev/中打开分析:
联系方式:arnoldlu@qq.com


 浙公网安备 33010602011771号