基于工具分析代码调用栈(静态/动态/插桩等等)
当代码比较复杂,不易于分析的时候,通过执行一遍来分析调用关系,不失为一种有效的方法。同时还能对阅读结果进行正确性校验。
1 示例 C++ 调用路径分析代码
示例代码:
#include <iostream>
#include <vector>
#include <memory>
#include <thread>
#include <chrono>

class Base {
public:
    virtual void foo() { std::cout << "Base::foo\n"; }
    virtual ~Base() = default;
};

class Derived : public Base {
public:
    void foo() override {
        std::cout << "Derived::foo\n";
        helper();
    }
    void helper() { std::cout << "Derived::helper\n"; }
};

void worker(std::shared_ptr<Base> obj) {
    obj->foo();
    std::this_thread::sleep_for(std::chrono::milliseconds(10));
}

int main() {
    auto d = std::make_shared<Derived>();
    std::vector<std::thread> threads;
    for (int i = 0; i < 3; ++i) {
        threads.emplace_back(worker, d);
    }
    for (auto &t : threads) t.join();
    return 0;
}
编译:
g++ -g -O0 -pthread main.cpp -o a.out
2 分析方法分类 + 操作示例
2.1 静态分析
-
nm / objdump
nm -C a.out | grep foo
objdump -dC a.out | less
查看符号、反汇编出
call调用。 -
readelf / dwarfdump
readelf --debug-dump=info a.out | less可见类继承关系、虚函数表。
2.2 动态调试
-
gdb
gdb ./a.out
(gdb) break Derived::foo
(gdb) run
(gdb) bt
输出运行时调用栈:
(gdb) bt
#0  Derived::foo (this=0x5555555712c0) at main.cpp:16
#1  0x000055555555639f in worker (obj=std::shared_ptr<Base> (use count 3, weak count 0) = {...}) at main.cpp:23
#2  0x0000555555559403 in std::__invoke_impl<void, void (*)(std::shared_ptr<Base>), std::shared_ptr<Derived> > (__f=@0x555555571308: 0x555555556369 <worker(std::shared_ptr<Base>)>)
    at /usr/include/c++/13/bits/invoke.h:61
#3  0x00005555555592ff in std::__invoke<void (*)(std::shared_ptr<Base>), std::shared_ptr<Derived> > (__fn=@0x555555571308: 0x555555556369 <worker(std::shared_ptr<Base>)>)
    at /usr/include/c++/13/bits/invoke.h:96
#4  0x0000555555559223 in std::thread::_Invoker<std::tuple<void (*)(std::shared_ptr<Base>), std::shared_ptr<Derived> > >::_M_invoke<0ul, 1ul> (this=0x5555555712f8)
    at /usr/include/c++/13/bits/std_thread.h:292
#5  0x00005555555591ba in std::thread::_Invoker<std::tuple<void (*)(std::shared_ptr<Base>), std::shared_ptr<Derived> > >::operator() (this=0x5555555712f8) at /usr/include/c++/13/bits/std_thread.h:299
#6  0x0000555555558ffa in std::thread::_State_impl<std::thread::_Invoker<std::tuple<void (*)(std::shared_ptr<Base>), std::shared_ptr<Derived> > > >::_M_run (this=0x5555555712f0)
    at /usr/include/c++/13/bits/std_thread.h:244
#7  0x00007ffff7cecdb4 in std::execute_native_thread_routine (__p=0x5555555712f0) at ../../../../../src/libstdc++-v3/src/c++11/thread.cc:104
#8  0x00007ffff789caa4 in start_thread (arg=<optimized out>) at ./nptl/pthread_create.c:447
#9  0x00007ffff7929c3c in clone3 () at ../sysdeps/unix/sysv/linux/x86_64/clone3.S:78
-
strace / ltrace
strace ./a.out
ltrace ./a.out
查看系统调用、库调用。
-
ftrace
参考《Linux ftrace框架介绍及运用 - ArnoldLu - 博客园》。sudo su echo function_graph > /sys/kernel/debug/tracing/current_tracer ./a.out cat /sys/kernel/debug/tracing/trace
内核 tracing,完整函数调用链。
-
eBPF / bpftrace
sudo bpftrace -e 'uprobe:/home/user/a.out:Derived::foo { printf("foo called\\n"); ustack(); }'
动态钩用户态函数,打印调用栈。
2.3 全量插桩
-
-finstrument-functionsg++ -g -O0 -finstrument-functions -pthread main.cpp log.cpp -o a.outlog.cpp:#include <stdio.h> #include <dlfcn.h> #include <cxxabi.h> extern "C" { void __attribute__((no_instrument_function)) __cyg_profile_func_enter(void *this_fn, void *call_site) { Dl_info info; if (dladdr(this_fn, &info) && info.dli_sname) { int status; char *demangled = abi::__cxa_demangle(info.dli_sname, 0, 0, &status); if (status == 0 && demangled) { printf("Enter: %s\n", demangled); } else { printf("Enter: %s\n", info.dli_sname); } } else { printf("Enter: %p\n", this_fn); } } void __attribute__((no_instrument_function)) __cyg_profile_func_exit(void *this_fn, void *call_site) { Dl_info info; if (dladdr(this_fn, &info) && info.dli_sname) { int status; char *demangled = abi::__cxa_demangle(info.dli_sname, 0, 0, &status); if (status == 0 && demangled) { printf("Exit: %s\n", demangled); } else { printf("Exit: %s\n", info.dli_sname); } } else { printf("Exit: %p\n", this_fn); } } } // extern "C"
自动打印函数进入/退出。
-
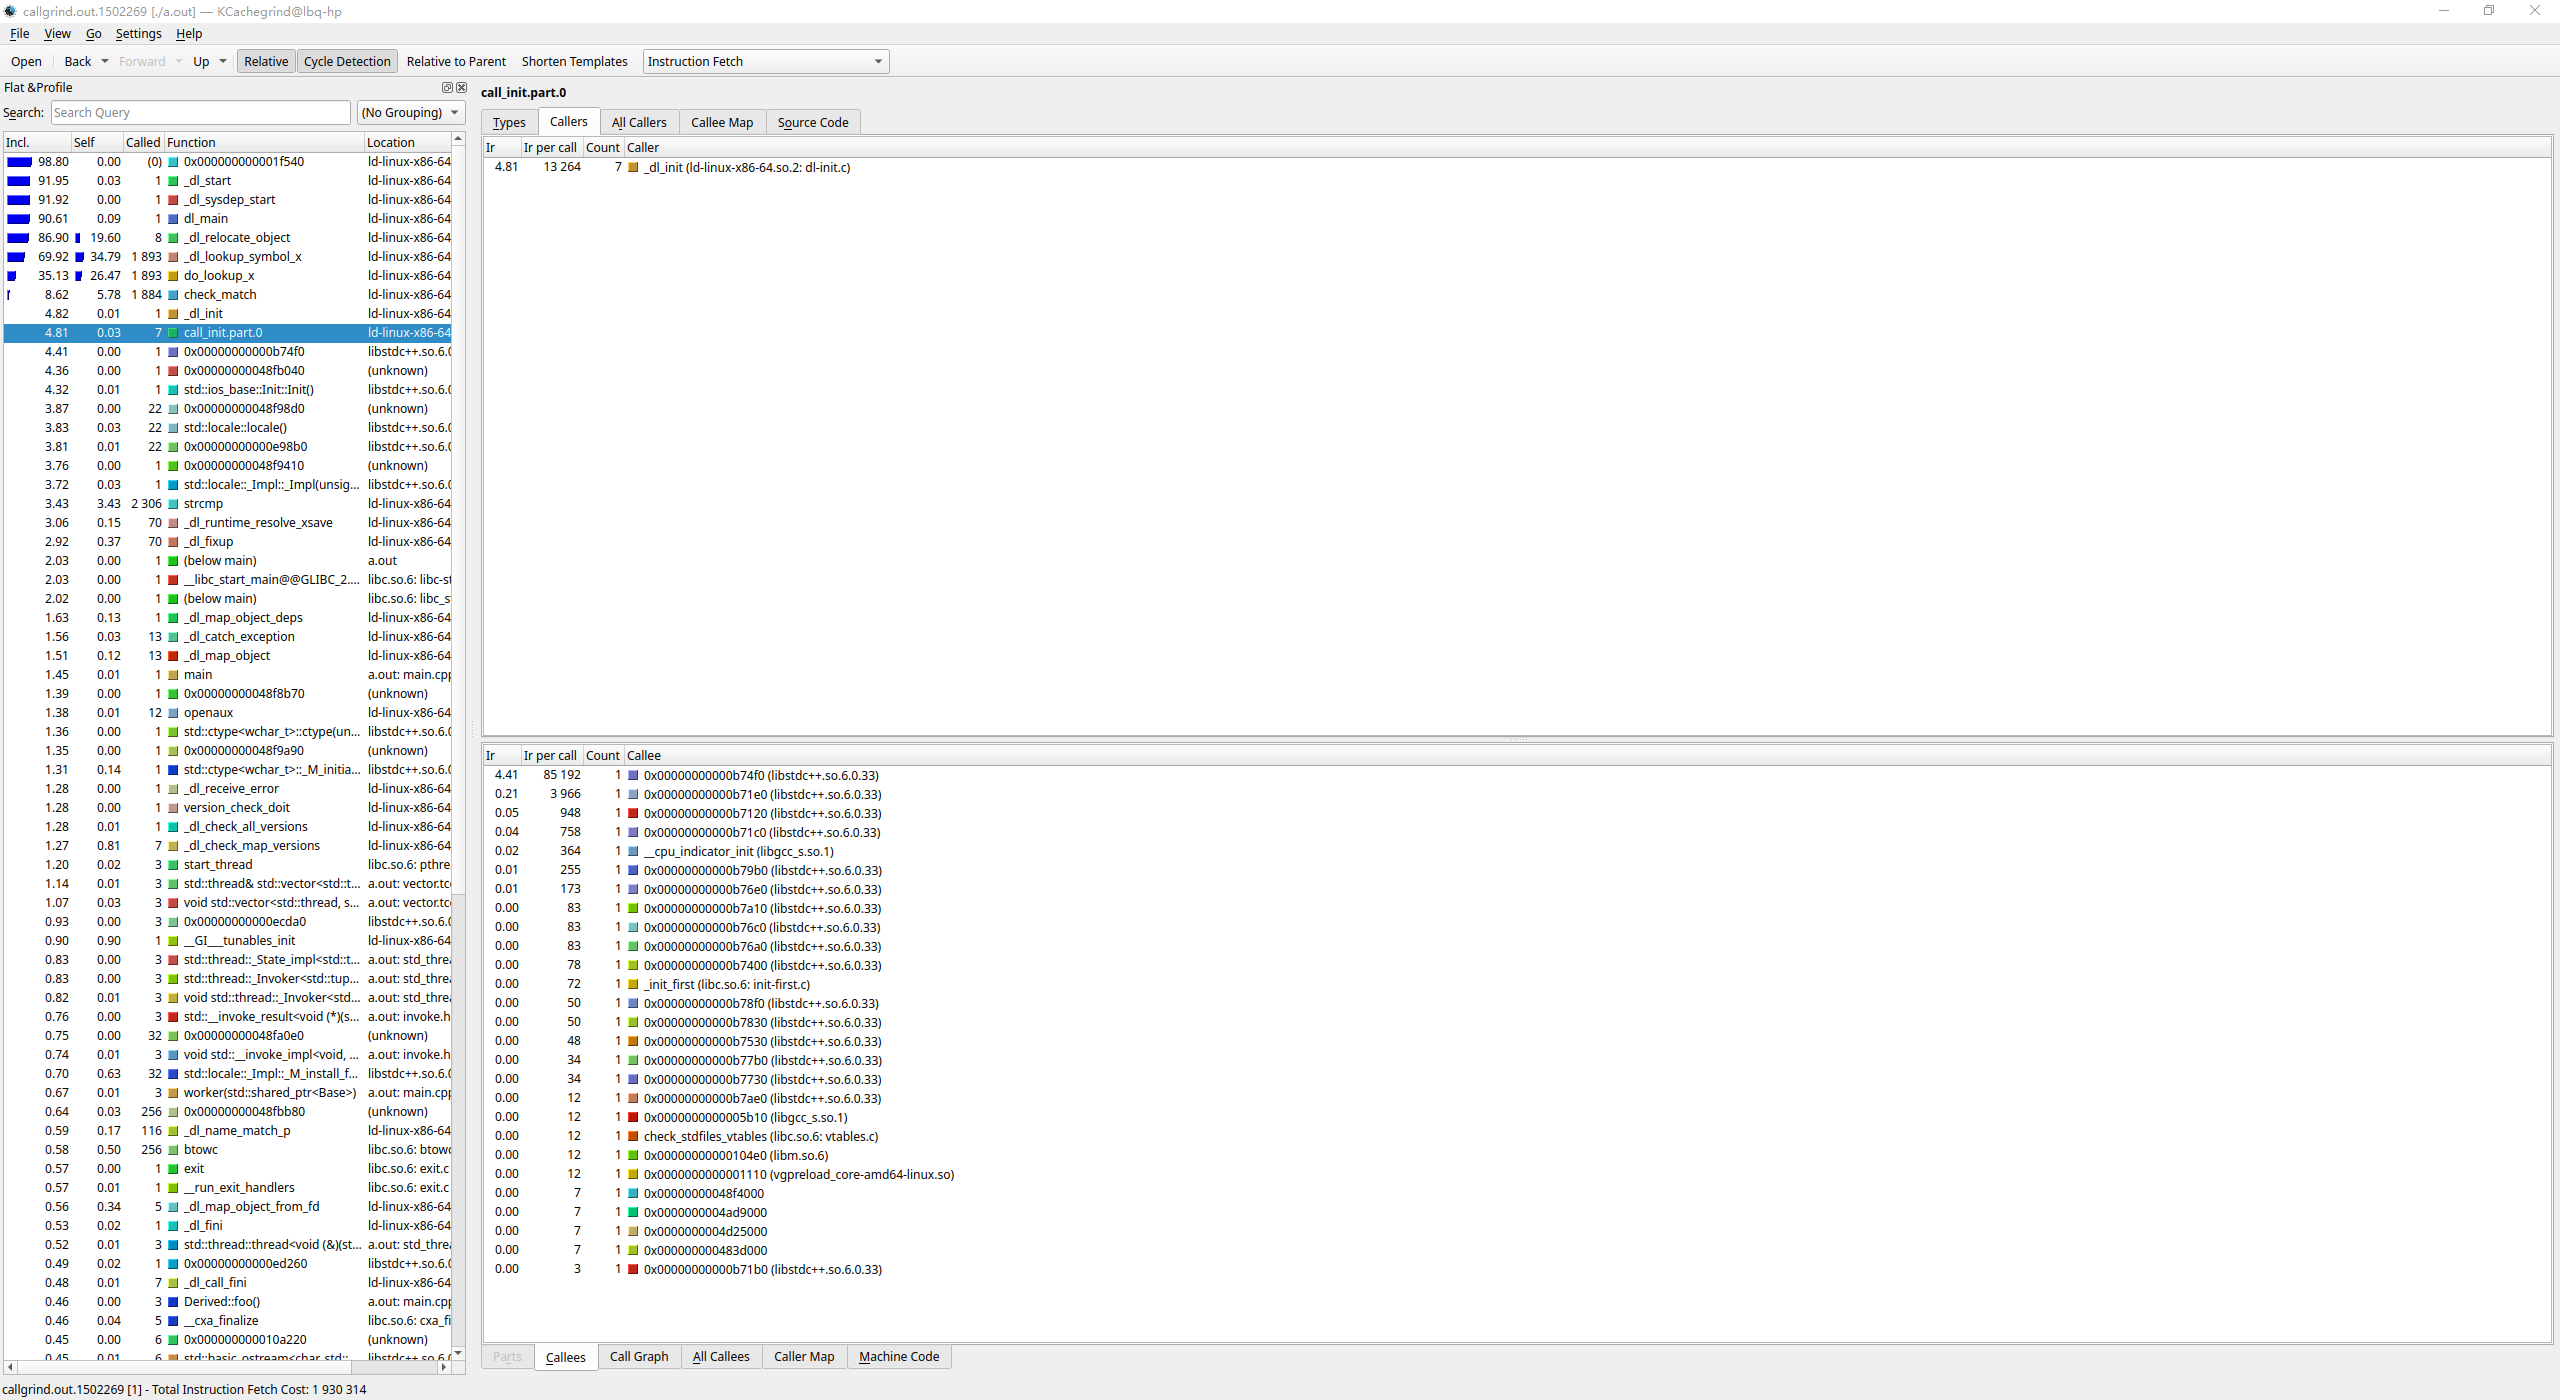
Valgrind + KCachegrind
valgrind --tool=callgrind ./a.out
kcachegrind callgrind.out.<pid>
生成函数调用图:
![image]()
2.4 性能采样
-
perf
perf record -g ./a.out
perf report
采样调用栈,查看热点。
Samples: 8  of event 'cpu_atom/cycles/Pu', Event count (approx.): 1297064, Thread: a.out
  Children      Self  Comma  Shared Object         Symbol
+   82.88%     0.00%  a.out  ld-linux-x86-64.so.2  [.] _dl_start_user                     ▒
+   82.88%     0.00%  a.out  ld-linux-x86-64.so.2  [.] _dl_start                          ▒
+   82.88%     0.00%  a.out  ld-linux-x86-64.so.2  [.] _dl_sysdep_start                   ▒
+   82.88%     0.00%  a.out  ld-linux-x86-64.so.2  [.] dl_main                            ▒
+   63.61%    22.88%  a.out  ld-linux-x86-64.so.2  [.] _dl_relocate_object                ▒
+   40.73%    10.52%  a.out  ld-linux-x86-64.so.2  [.] _dl_lookup_symbol_x                ▒
+   30.21%    14.32%  a.out  ld-linux-x86-64.so.2  [.] do_lookup_x                        ▒
+   17.12%    17.12%  a.out  a.out                 [.] std::vector<std::thread, std::alloc▒
+   17.12%     0.00%  a.out  a.out                 [.] _start                             ▒
+   17.12%     0.00%  a.out  libc.so.6             [.] __libc_start_main@@GLIBC_2.34      ▒
+   17.12%     0.00%  a.out  libc.so.6             [.] __libc_start_call_main             ▒
-   17.12%     0.00%  a.out  a.out                 [.] main                               ▒
     main                                                                                 ▒
     std::thread& std::vector<std::thread, std::allocator<std::thread> >::emplace_back<voi▒
     void std::vector<std::thread, std::allocator<std::thread> >::_M_realloc_insert<void (▒
     std::vector<std::thread, std::allocator<std::thread> >::_M_check_len(unsigned long, c▒
     std::vector<std::thread, std::allocator<std::thread> >::max_size() const             ▒
     std::vector<std::thread, std::allocator<std::thread> >::_S_max_size(std::allocator<st▒
+   17.12%     0.00%  a.out  a.out                 [.] std::thread& std::vector<std::threa▒
+   17.12%     0.00%  a.out  a.out                 [.] void std::vector<std::thread, std::▒
+   17.12%     0.00%  a.out  a.out                 [.] std::vector<std::thread, std::alloc◆
+   17.12%     0.00%  a.out  a.out                 [.] std::vector<std::thread, std::alloc▒
+   15.89%    15.89%  a.out  ld-linux-x86-64.so.2  [.] check_match                        ▒
+    9.64%     9.64%  a.out  ld-linux-x86-64.so.2  [.] _dl_map_object_from_fd             ▒
+    9.64%     9.64%  a.out  libc.so.6             [.] __x86_cacheinfo_ifunc              ▒
+    9.64%     0.00%  a.out  ld-linux-x86-64.so.2  [.] _dl_map_object_deps                ▒
+    9.64%     0.00%  a.out  ld-linux-x86-64.so.2  [.] _dl_catch_exception                ▒
+    9.64%     0.00%  a.out  ld-linux-x86-64.so.2  [.] openaux                            ▒
+    9.64%     0.00%  a.out  ld-linux-x86-64.so.2  [.] _dl_map_object                     ▒
+    9.64%     0.00%  a.out  [unknown]             [.] 0xffffffffafa00b90
-
FlameGraph
参考《使用Flame Graph进行系统性能分析 - ArnoldLu - 博客园》。perf script | stackcollapse-perf.pl > out.folded flamegraph.pl out.folded > flame.svg
火焰图展示调用路径。
-
LTTng
lttng create mysession
lttng enable-event -u -a
lttng start
./a.out
lttng stop
lttng view
全系统调用追踪。
3 方法优劣总结表
| 方法 | 类型 | 是否需要源码 | 粒度 | 优点 | 缺点 | 适用场景 |
|---|---|---|---|---|---|---|
| nm / objdump | 静态 | 否 | 符号级 | 简单直接,快速查看符号 | 无调用链 | ELF 符号确认 |
| readelf / dwarfdump | 静态 | 否 | 函数级 | 继承关系、DWARF 信息 | 需调试信息 | 类/继承分析 |
| gdb | 动态 | 否 | 栈回溯 | 精确可交互 | 需断点 | 调用链定位 |
| strace / ltrace | 动态 | 否 | 系统/库调用 | 快速 | 粒度粗 | API 追踪 |
| ftrace | 动态 | 否 | 全函数 | 全路径 | 输出大 | 调用链完整性 |
| eBPF / bpftrace | 动态 | 否 | 自定义 | 低开销可选函数 | 写脚本复杂 | 精确追踪 |
| -finstrument-functions | 插桩 | 否 | 全函数 | 自动日志 | 开销大 | 调用链生成 |
| Valgrind / KCachegrind | 插桩 | 否 | 全函数 | 调用图+性能统计 | 慢 | 小规模研究 |
| perf | 采样 | 否 | 调用栈 | 热点分析 | 采样不全 | 性能调优 |
| FlameGraph | 采样 | 否 | 调用栈 | 直观 | 依赖 perf | 热点路径分析 |
| LTTng | 采样/追踪 | 否 | 系统级 | 大规模 trace | 学习成本高 | 系统级调试 |
联系方式:arnoldlu@qq.com


 浙公网安备 33010602011771号