使用Flame Graph进行系统性能分析
关键词:Flame Graph、perf、perl。
FlameGraph是由BrendanGregg开发的一款开源可视化性能分析工具,形象的成为火焰图。
从底向上像火苗一样逐渐变小,也反映了相互之间的包含关系,下面的框条包含上面内容。
经过FlameGraph.git处理,最终生成矢量SVG图形,可以形象的看出不同部分占用情况,以及包含与被包含情况。
除了反应CPU使用情况的CPU FlameGraph,还有几种Flame Graph:Memory Flame Graph、Off-CPU Flame Graph、Hot/Cold Flame Graph、Differential Flame Graph。
本文目的是记录如何使用Flame Graph;然后对其流程进行简单分析,了解其数据来龙去脉;最后分析测试结果。
基本上做到知其然知其所以然。
1. Flame Graph使用
构造测试程序如下,可以启动5个线程。
每个线程都有自己的thread_funcx(),while(1)里面再调用函数。
在8核CPU上执行,预测应该每个thread_funcx()都会占用相同的比例,因为都是100%占用CPU,然后里面的函数比例呈现阶梯形。


#include <stdio.h>
#include <pthread.h>

#define LOOP_COUNT 1000000

void func_a(void)
{
    int i;
    for(i=0; i<LOOP_COUNT; i++);
}

void func_b(void)
{
    int i;
    for(i=0; i<LOOP_COUNT; i++);
    func_a();
}

void func_c(void)
{
    int i;
    for(i=0; i<LOOP_COUNT; i++);
    func_b();
}

void func_d(void)
{
    int i;
    for(i=0; i<LOOP_COUNT; i++);
    func_c();
}

void func_e(void)
{
    int i;
    for(i=0; i<LOOP_COUNT; i++);
    func_d();
}

void* thread_fun1(void* param)
{
    while(1) {
        int i;
        for(i=0;i<LOOP_COUNT;i++);
        func_a();
    }
}

void* thread_fun2(void* param)
{
    while(1) {
        int i;
        for(i=0;i<LOOP_COUNT;i++);
        func_b();
    }
}

void* thread_fun3(void* param)
{
    while(1) {
        int i;
        for(i=0;i<LOOP_COUNT;i++);
        func_c();
    }
}

void* thread_fun4(void* param)
{
    while(1) {
        int i;
        for(i=0;i<LOOP_COUNT;i++);
        func_d();
    }
}

void* thread_fun5(void* param)
{
    while(1) {
        int i;
        for(i=0;i<LOOP_COUNT;i++);
        func_e();
    }
}
int main(void)
{
    int ret;
    pthread_t tid1, tid2, tid3, tid4, tid5;


    ret=pthread_create(&tid1, NULL, thread_fun1, NULL);
    if(ret==-1){
        printf("Create pthread failed.\n");
        return -1;
    }

    ret=pthread_create(&tid2, NULL, thread_fun2, NULL);
    if(ret==-1){
        printf("Create pthread failed.\n");
        return -1;
    }

    ret=pthread_create(&tid3, NULL, thread_fun3, NULL);
    if(ret==-1){
        printf("Create pthread failed.\n");
        return -1;
    }

    ret=pthread_create(&tid4, NULL, thread_fun4, NULL);
    if(ret==-1){
        printf("Create pthread failed.\n");
        return -1;
    }

    ret=pthread_create(&tid5, NULL, thread_fun5, NULL);
    if(ret==-1){
        printf("Create pthread failed.\n");
        return -1;
    }


    if(pthread_join(tid1,NULL)!=0){
        printf("pthrad join failed.\n");
        return -1;
    }

    if(pthread_join(tid2,NULL)!=0){
        printf("pthrad join failed.\n");
        return -1;
    }

    if(pthread_join(tid3,NULL)!=0){
        printf("pthrad join failed.\n");
        return -1;
    }
    if(pthread_join(tid4,NULL)!=0){
        printf("pthrad join failed.\n");
        return -1;
    }
    if(pthread_join(tid5,NULL)!=0){
        printf("pthrad join failed.\n");
        return -1;
    }

    return 0;
}
编译然后执行结果:
gcc createFlame.c -o createFlame -pthread
./createFlame
在sudo su权限中进行perf record和FlameGraph生成;-F 999采样率999Hz,-a包括所有CPU,-g使能call-graph录制,-- sleep 60记录60秒时长。
perf record -F 999 -a -g -- sleep 60
perf script | ./stackcollapse-perf.pl | ./flamegraph.pl > out.svg
在浏览器中查看结果如下:
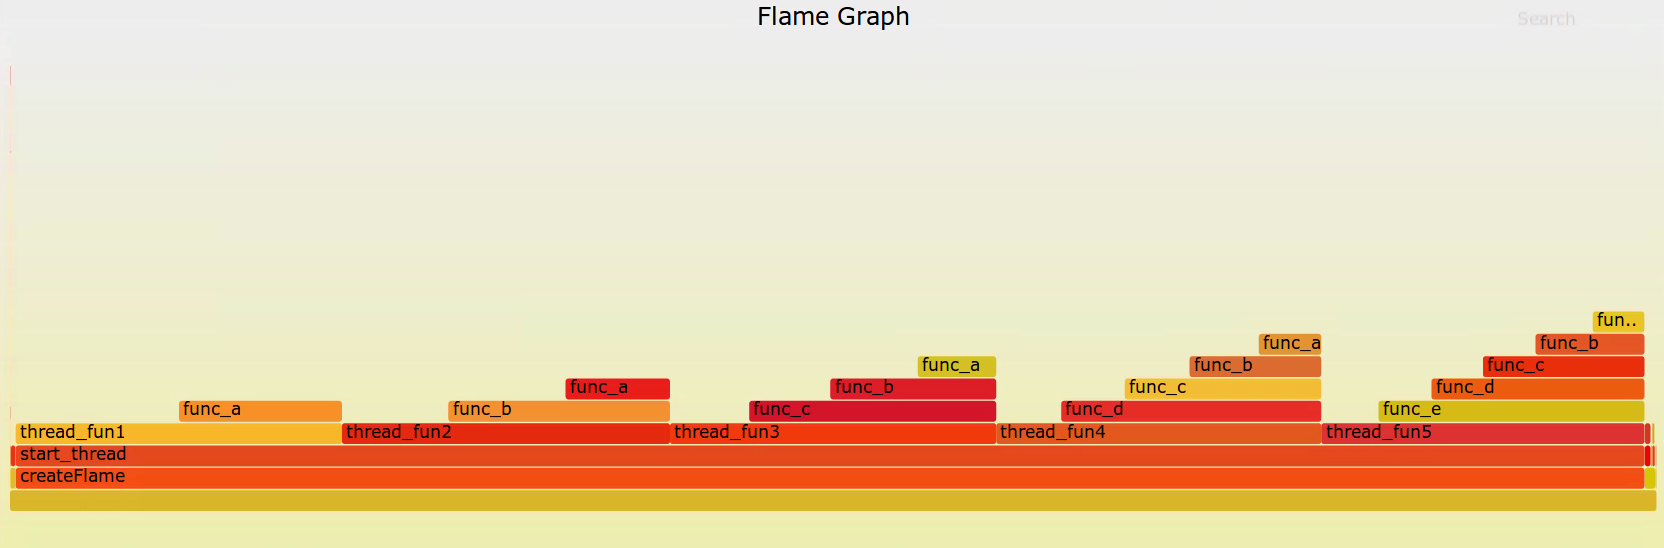
可以看出createFlame应用,调用start_thread创建线程,五个线程函数占用相等宽度。
线程函数以下的层级调用宽度相差基本一致。
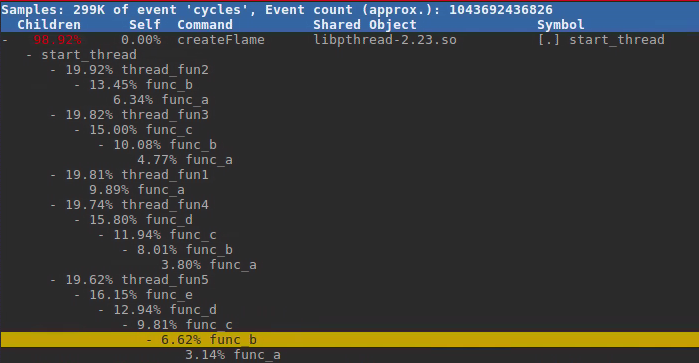
使用perf report -g查看start_thread,然后逐级展开调用及其占比。
整个start_thread占据99%,然后5个线程均分,因为每个都独占一个CPU。
每个线程里面函数占比,与FlameGraph中一致。
1.1 查看细节
鼠标移动到FlameGraph框图上时,会显示对应进程或函数的被采样信息。
如果点击框图,则以其为基础展开,放大显示后面的找关系。已达到缩放,显示细节和整体。
1.2 查找
在右上角Search或者Ctrl+F,可以在FlameGraph中查找相应符号的框图。
2. Flame Graph流程分析
从perf record输出的perf.data,到最终生成out.svg文件,可以分为三步:1.perf script、2.stackcollapse-perf.pl、3.flamegraph.pl。
如果要详细了解其如何一步一步解析字符串,到最终生成svg矢量图形可以阅读stackcollapse-perf.pl和flamegraph.pl两个perl脚本。
下面借助构造伪数据,来理解其流程。
2.1 perf script
perf script将perf record的记录转换成可读的采样记录,每一个下采样记录包含应用名称、以及采样到的stack信息。
进程名后的进程ID、CPU号、时间戳、cycles数目都是无用信息,下面的stack也只有函数名有效。
createFlame  0 [0]  0.0:   0 cycles:
                 000 func_a (xxx)
                 000 func_b (xxx)
                 000 func_c (xxx)
                 000 func_d (xxx)
                 000 func_e (xxx)
                 000 thread_fun5 (xxx)
                 000 start_thread (xxx)
构造一份perf script生成的伪数据,来分析流程以及明白FlameGraph的含义。
createFlame  0 [0]  0.0:   0 cycles:
                 000 thread_fun1 (xxx)
                 000 start_thread (xxx)

createFlame  0 [0]  0.0:   0 cycles:
                 000 func_a (xxx)
                 000 thread_fun1 (xxx)
                 000 start_thread (xxx)

createFlame  0 [0]  0.0:   0 cycles:
                 000 thread_fun2 (xxx)
                 000 start_thread (xxx)

createFlame  0 [0]  0.0:   0 cycles:
                 000 func_b (xxx)
                 000 thread_fun2 (xxx)
                 000 start_thread (xxx)

createFlame  0 [0]  0.0:   0 cycles:
                 000 func_a (xxx)
                 000 func_b (xxx)
                 000 thread_fun2 (xxx)
                 000 start_thread (xxx)

createFlame  0 [0]  0.0:   0 cycles:
                 000 thread_fun3 (xxx)
                 000 start_thread (xxx)

createFlame  0 [0]  0.0:   0 cycles:
                 000 func_c (xxx)
                 000 thread_fun3 (xxx)
                 000 start_thread (xxx)

createFlame  0 [0]  0.0:   0 cycles:
                 000 func_b (xxx)
                 000 func_c (xxx)
                 000 thread_fun3 (xxx)
                 000 start_thread (xxx)

createFlame  0 [0]  0.0:   0 cycles:
                 000 func_a (xxx)
                 000 func_b (xxx)
                 000 func_c (xxx)
                 000 thread_fun3 (xxx)
                 000 start_thread (xxx)

createFlame  0 [0]  0.0:   0 cycles:
                 000 thread_fun4 (xxx)
                 000 start_thread (xxx)

createFlame  0 [0]  0.0:   0 cycles:
                 000 func_d (xxx)
                 000 thread_fun4 (xxx)
                 000 start_thread (xxx)

createFlame  0 [0]  0.0:   0 cycles:
                 000 func_c (xxx)
                 000 func_d (xxx)
                 000 thread_fun4 (xxx)
                 000 start_thread (xxx)

createFlame  0 [0]  0.0:   0 cycles:
                 000 func_b (xxx)
                 000 func_c (xxx)
                 000 func_d (xxx)
                 000 thread_fun4 (xxx)
                 000 start_thread (xxx)

createFlame  0 [0]  0.0:   0 cycles:
                 000 func_a (xxx)
                 000 func_b (xxx)
                 000 func_c (xxx)
                 000 func_d (xxx)
                 000 thread_fun4 (xxx)
                 000 start_thread (xxx)

createFlame  0 [0]  0.0:   0 cycles:
                 000 thread_fun5 (xxx)
                 000 start_thread (xxx)

createFlame  0 [0]  0.0:   0 cycles:
                 000 func_e (xxx)
                 000 thread_fun5 (xxx)
                 000 start_thread (xxx)

createFlame  0 [0]  0.0:   0 cycles:
                 000 func_d (xxx)
                 000 func_e (xxx)
                 000 thread_fun5 (xxx)
                 000 start_thread (xxx)

createFlame  0 [0]  0.0:   0 cycles:
                 000 func_c (xxx)
                 000 func_d (xxx)
                 000 func_e (xxx)
                 000 thread_fun5 (xxx)
                 000 start_thread (xxx)

createFlame  0 [0]  0.0:   0 cycles:
                 000 func_b (xxx)
                 000 func_c (xxx)
                 000 func_d (xxx)
                 000 func_e (xxx)
                 000 thread_fun5 (xxx)
                 000 start_thread (xxx)

createFlame  0 [0]  0.0:   0 cycles:
                 000 func_a (xxx)
                 000 func_b (xxx)
                 000 func_c (xxx)
                 000 func_d (xxx)
                 000 func_e (xxx)
                 000 thread_fun5 (xxx)
                 000 start_thread (xxx)
2.2 stackcollapse-perf.pl
stackcollapse-perf.pl将perf script生成的多行stack记录转换成一行,函数之间用逗号隔开,最后的记录采样次数用空格隔开。
可以通过./stackcollapse-perf.pl -h查看帮助,查看cat perf_fake.txt | ./stackcollapse-perf.pl输出。
可以清晰地看出栈的关系和采样到的次数。
createFlame;start_thread;thread_fun1 1
createFlame;start_thread;thread_fun1;func_a 1
createFlame;start_thread;thread_fun2 1
createFlame;start_thread;thread_fun2;func_b 1
createFlame;start_thread;thread_fun2;func_b;func_a 1
createFlame;start_thread;thread_fun3 1
createFlame;start_thread;thread_fun3;func_c 1
createFlame;start_thread;thread_fun3;func_c;func_b 1
createFlame;start_thread;thread_fun3;func_c;func_b;func_a 1
createFlame;start_thread;thread_fun4 1
createFlame;start_thread;thread_fun4;func_d 1
createFlame;start_thread;thread_fun4;func_d;func_c 1
createFlame;start_thread;thread_fun4;func_d;func_c;func_b 1
createFlame;start_thread;thread_fun4;func_d;func_c;func_b;func_a 1
createFlame;start_thread;thread_fun5 1
createFlame;start_thread;thread_fun5;func_e 1
createFlame;start_thread;thread_fun5;func_e;func_d 1
createFlame;start_thread;thread_fun5;func_e;func_d;func_c 1
createFlame;start_thread;thread_fun5;func_e;func_d;func_c;func_b 1
createFlame;start_thread;thread_fun5;func_e;func_d;func_c;func_b;func_a 1
2.3 flamegraph.pl
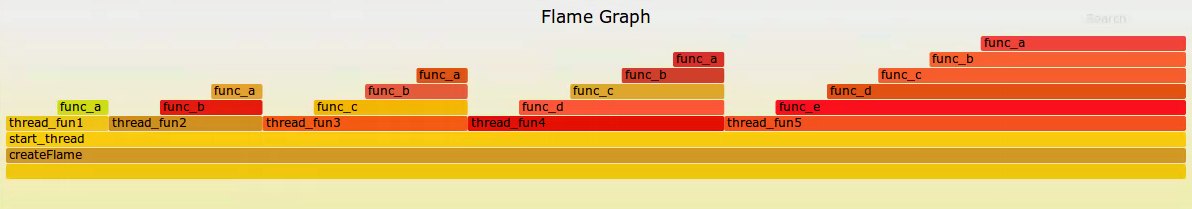
那么stackcollapse-perf.pl的数据经过flamegraph.pl处理之后又是什么样子呢?
可以看出svg图形,就像stackcollapse-perf.pl每一行竖向显示。
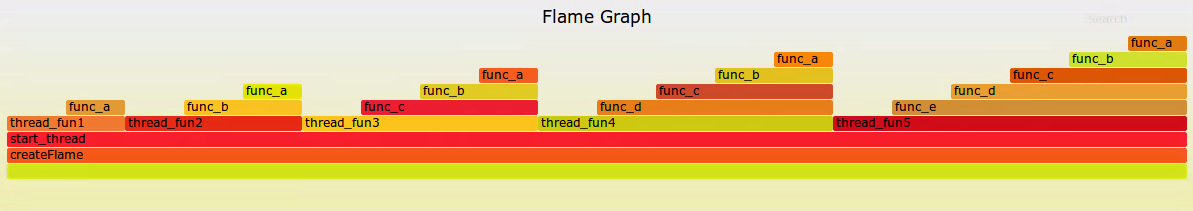
那么简单修改一下,将thread_fun5的func_a的stack重复4次,图形会变成什么样子呢?
可以看出thread_fun5的func_a变得更宽了。
所以不难理解,Flame Graph纵向表示一次调用栈深度,调用关系从下到上;Flame Graph横向宽度表示被perf record采样到的次数。
3. Flame Graph结果分析
所有的FlameGraph都是统计采样结果,根据进程、函数栈进行匹配,同样栈的采样计数累加。
FlameGraph的实际应用除了查看CPU使用情况之外,还有通过监控内存分配/释放函数的MemoryFlameGraph;
记录进程因为IO、唤醒等耗费时间的Off-CPU FlameGraph;
以及将CPU FlameGraph和Off-CPU FlameGraph进行合并的Hot/Cold FlameGraph;
对两次不同测试进行比较的DifferentialFlameGraph。
之前对CPU FlameGraph进行了介绍,下面详细介绍其余四种FlameGraph的使用。
3.1 MemoryFlameGraph
《Memory Leak (and Growth) Flame Graphs》关于内存的FlameGraph和CPU FlameGraph的区别在于CPU是采样,Memory跟踪内存trace events,比如malloc()/free()/realloc()/calloc()/brk()/mmap()。
然后在对调用栈进行统计,显示FlameGraph。其本质上是一样的。
perf record -e syscalls:sys_enter_mmap -a -g -- sleep 120
perf script | ./stackcollapse-perf.pl | ./flamegraph.pl --color=mem \ --title="Heap Expansion Flame Graph" --countname="calls" > out_mmap.svg
结果如下:

但从实际来看这张图并不能反映Memory Leak,也不能准确反映Memory Grouth。
因为只是记录mmap()的次数,没有记录每次大小;同时没有记录munmap()的次数。
3.1.1 一个通过trace events定位内存泄漏的案例
记得之前Debug过内存泄漏问题:运行过一段时间,发现总的内存在增加。查看/proc/meminfo大概是slab内存泄漏,然后查看一下/proc/slabinfo看出是kmalloc-64在不停增加。
所以借助tracing/events/kmem/kmalloc和kfree两个events,观察是哪个进程在泄漏内存,同时修改call_site从显示地址编程显示符号。
如何确定内存泄漏呢?
以进程作为组,kmalloc()分配大小累加;如果有kfree(),通过ptr匹配从累计值中减去对应kmalloc()大小。
这样在运行一段时间过后,每个进程的累计值就是增量,可以很轻松的确定增量是多少,以及每个增量的符号表。
3.2 Off-CPU FlameGraph
和CPU FlameGraph相反,Off-CPU FlameGraph反映的是进程没有在CPU上运行的时间都在干嘛,这也是影响进程性能的关键因素。
比如进程时间片用完导致的进程切换、映射到内存的IO操作、调度延迟等。
《Off-CPU Flame Graphs》循序渐进的介绍了IO造成的Off-CPU时间、包括IO延迟的Off-CPU时间、进程唤醒延时,以及展示进程之间唤醒点栈关系的Chain Graphs。
比如查看Block I/O次数的FlameGraph,这个只能做个参考。如果想要更准确的看IO延迟时间,还需要借助文中提到的biostacks、fileiostacks等工具。
sudo perf record -e block:block_rq_insert -a -g -- sleep 30
sudo perf script --header | ./stackcollapse-perf.pl | ./flamegraph.pl --color=io --title="Block I/O Flame Graph" --countname="I/O" > out.svg
结果如下:

3.3 Hot/Cold FlameGraph
《Hot/Cold FlameGraph》将On-CPU FlameGraph和Off-CPU FlameGraph融合到一张图中,这样就可以一目了然时间都耗费在哪里了。
但是目前生成的结果分析起来仍然比较困难,还处在实验阶段。
3.4 Differential FlameGraph
《Differential FlameGraph》比较两份FlameGraph,用于比较两个版本差异,更好地确定性能regression。
实际环境中的Differential FlameGraph较难分析,这里构造两个FlameGraph然后进行Differential比较。
分别构造伪数据out.folded1和out.folded2如下:
out.folded1
createFlame;start_thread;thread_fun1 1
createFlame;start_thread;thread_fun1;func_a 1
createFlame;start_thread;thread_fun2 1
createFlame;start_thread;thread_fun2;func_b 1
createFlame;start_thread;thread_fun2;func_b;func_a 1
createFlame;start_thread;thread_fun3 1
createFlame;start_thread;thread_fun3;func_c 1
createFlame;start_thread;thread_fun3;func_c;func_b 1
createFlame;start_thread;thread_fun3;func_c;func_b;func_a 1
createFlame;start_thread;thread_fun4 1
createFlame;start_thread;thread_fun4;func_d 1
createFlame;start_thread;thread_fun4;func_d;func_c 1
createFlame;start_thread;thread_fun4;func_d;func_c;func_b 1
createFlame;start_thread;thread_fun4;func_d;func_c;func_b;func_x 1
createFlame;start_thread;thread_fun4;func_d;func_c;func_b;func_a 5
createFlame;start_thread;thread_fun5 1
createFlame;start_thread;thread_fun5;func_e 1
createFlame;start_thread;thread_fun5;func_e;func_d 1
createFlame;start_thread;thread_fun5;func_e;func_d;func_c 1
createFlame;start_thread;thread_fun5;func_e;func_d;func_c;func_b 1
createFlame;start_thread;thread_fun5;func_e;func_d;func_c;func_b;func_a 1
out.folded2
createFlame;start_thread;thread_fun1 1
createFlame;start_thread;thread_fun1;func_a 1
createFlame;start_thread;thread_fun2 1
createFlame;start_thread;thread_fun2;func_b 1
createFlame;start_thread;thread_fun2;func_b;func_a 1
createFlame;start_thread;thread_fun3 1
createFlame;start_thread;thread_fun3;func_c 1
createFlame;start_thread;thread_fun3;func_c;func_b 1
createFlame;start_thread;thread_fun3;func_c;func_b;func_a 1
createFlame;start_thread;thread_fun4 1
createFlame;start_thread;thread_fun4;func_d 1
createFlame;start_thread;thread_fun4;func_d;func_c 1
createFlame;start_thread;thread_fun4;func_d;func_c;func_b 1
createFlame;start_thread;thread_fun4;func_d;func_c;func_b;func_a 1
createFlame;start_thread;thread_fun5 1
createFlame;start_thread;thread_fun5;func_e 1
createFlame;start_thread;thread_fun5;func_e;func_d 1
createFlame;start_thread;thread_fun5;func_e;func_d;func_c 1
createFlame;start_thread;thread_fun5;func_e;func_d;func_c;func_b 1
createFlame;start_thread;thread_fun5;func_e;func_d;func_c;func_b;func_x 1
createFlame;start_thread;thread_fun5;func_e;func_d;func_c;func_b;func_a 5
分别生成两者FlameGraph及Differential FlameGraph。
./flamegraph.pl < out.folded1 > out_1.svg
./flamegraph.pl < out.folded2 > out_2.svg
./difffolded.pl out.folded1 out.folded2 | ./flamegraph.pl > diff.svg
./difffolded.pl out.folded2 out.folded1 | ./flamegraph.pl > diff2.svg
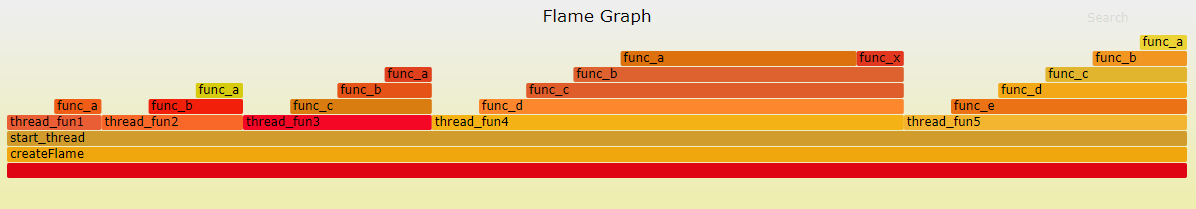
图1
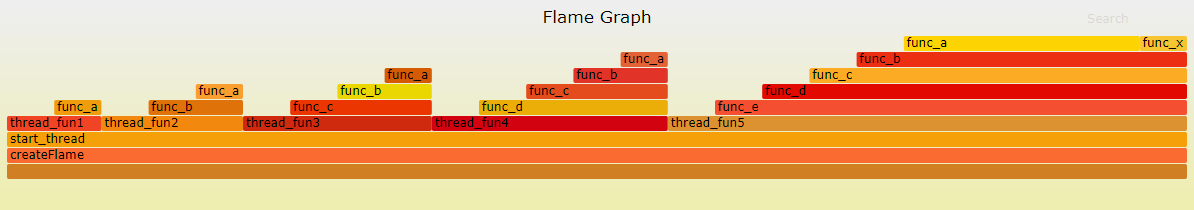
图2
图1和图2反映了两组数据的差异,图2相比图1thread_fun4少了func_x,减小了func_a;thread_fun5的func_a增大了,多了func_x。
下面是图1相对于图2的Differential FlameGraph,可以看出轮廓基本和图2一致。
图2丢掉的thread_fun4的func_x,不显示;func_a变小用蓝色标识。图2新增的thread_fun5的fun_x,thread_fun5的func_a用红色标识。
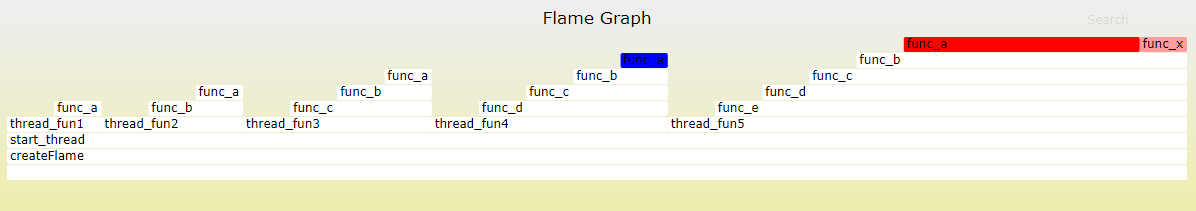
图3
然后再以图1为基础进行查分,如下图:
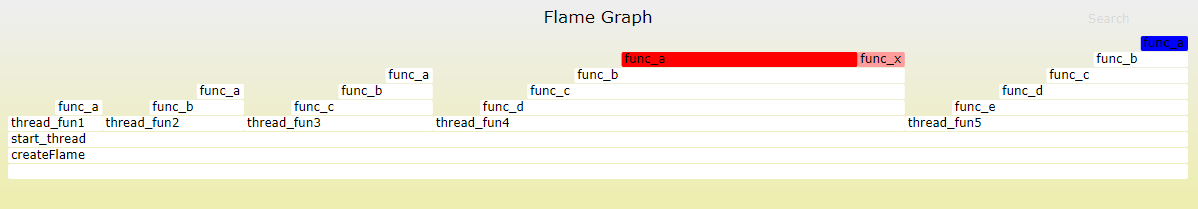
图4
4. 小结
CPU FlameGraph用于查找程序执行的热点,找出性能瓶颈。Memory FlameGraph用于简单分析内存泄漏或者增长趋势。
相对于CPU FlameGraph,Off-CPU FlameGraph能找出进程好在CPU之外的时间,对于提高进程性能找出浪费时间有效。
Hot/Cold FlameGraph将CPU FlameGraph和Off-CPU FlameGraph两者融合到一张图中,更清晰的展示进程时间分配。
Differential FlameGraph可用于性能Regression对比。
参考文档:
《Flame Graphs》:关于FlameGraph的来龙去脉,及其详细介绍汇总。
《The Flame Graph》:发表在acm.org文章,This visualization of software execution is a new necessity for performance profiling and debugging。


 浙公网安备 33010602011771号