数字图像处理1
文章目录
前言
图像类型:
1.真彩色图像(RGB)
2.索引图像(数据索引矩阵和颜色映射矩阵)
3.灰度图像(值域为[0,1]的颜色过渡图像)
4.二值图像(只有0和1两个值)
图像的格式:
bmp,jpg,png,tif,gif,pcx,tga,exif,fpx,svg,psd,cdr,pcd,dxf,ufo,eps,ai,raw,WMF,webp,avif,apng 等.
各种不同格式的图像往往用途不同,例如tif图像是数码相机拍摄的格式,hdr是一种记录亮度更广泛范围的格式,常用于游戏光照等影视场景。
一、转换为真彩色图像
1.将.tif格式转换为真彩色图像(demosaic)
demosaic(I,“sensorAlignment”);
sensorAlignment有四种传感器模式可选,
“bggr”,“rggb”,“grbg”,“gbrg”,其中rggb的模式最多,尼康,多数索尼相机使用。
该方法转换的是bayer模式编码的图片。。。
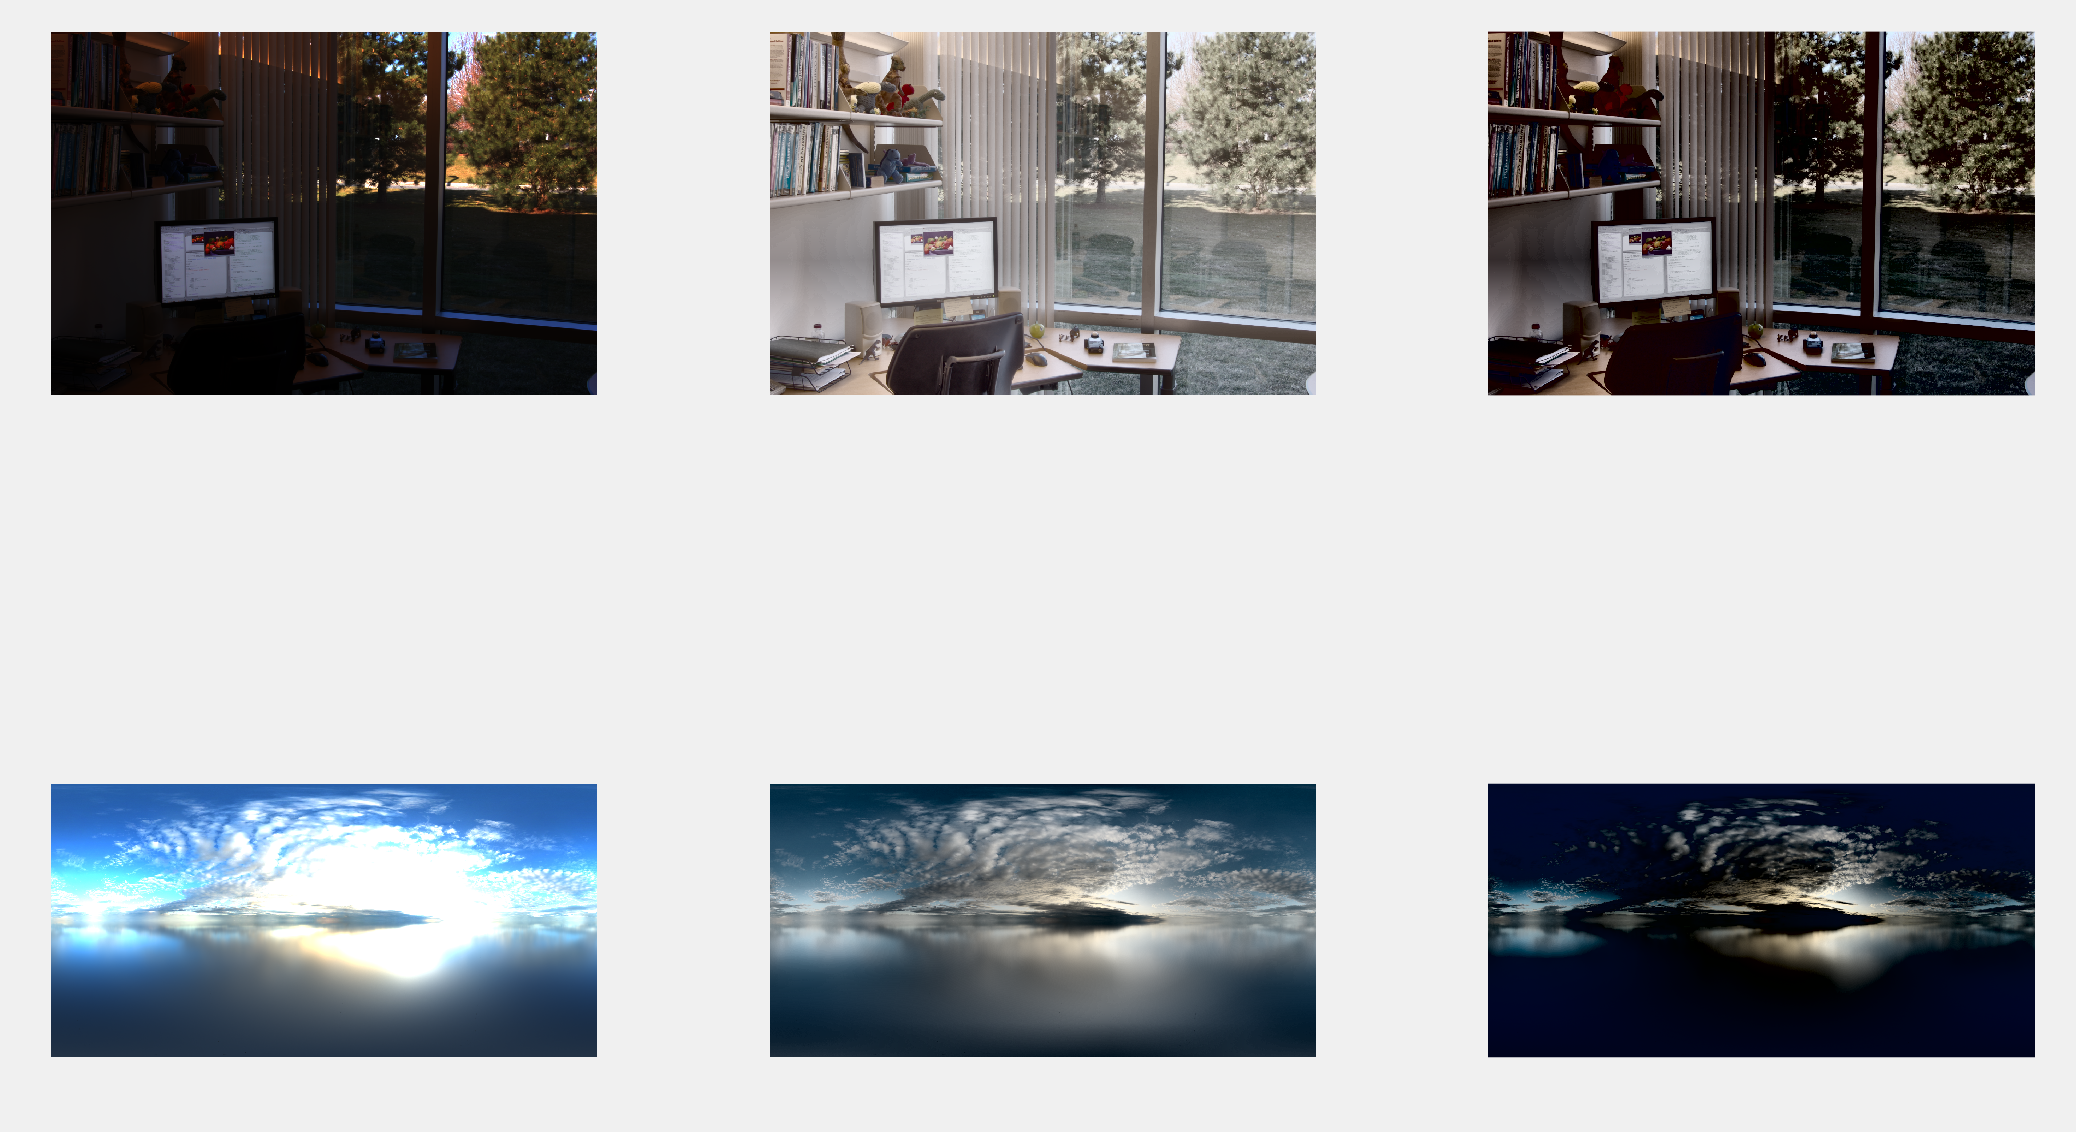
2.将.hdr格式转换为真彩色图像(tonemap)
hdr格式的图片常常用于游戏的光照系统,‘天空盒’,因此他的亮部会过曝,变得格外亮,因为会根据图片的亮度照亮游戏场景,而暗部会变得更暗,更凸显游戏内的光照方向,因为一个单调全亮的天空是无聊的。因此一个hdr的颜色包含了更多的颜色信息,更亮的亮部和更暗的暗部。
clear all;
%%office.hdr为matlab自带的图    图1
hdr=hdrread('office.hdr');
subplot(231);
imshow(hdr);

rgb1=tonemap(hdr);
subplot(232);
imshow(rgb1);

rgb2=tonemap(hdr,"AdjustLightness",[0.5 1.0],"AdjustSaturation",1.5);
%%转换为真彩色图像,将AdjustLightness亮度暗部增强到0.5,亮部调增到1.0;
%%AdjustSaturation饱和度>1为增强饱和度,<1为降低饱和度
subplot(233);
imshow(rgb2);


%%图2
hdr=hdrread('imageRe\img_001.hdr');
subplot(234);
imshow(hdr);

rgb1=tonemap(hdr);
subplot(235);
imshow(rgb1);

rgb2=tonemap(hdr,"AdjustLightness",[0.5 1.0],"AdjustSaturation",1.5);
%%转换为真彩色图像,将AdjustLightness亮度暗部增强到0.5,亮部调增到1.0;
%%AdjustSaturation饱和度>1为增强饱和度,<1为降低饱和度
subplot(236);
imshow(rgb2);
3.将索引图像转换为真彩色图像(ind2rgb)
clear all;
load trees;
imshow(X,map);
title('索引图像');
rgb=ind2rgb(X,map);
figure;
imshow(rgb);
title('真彩色图像');

二、转换为索引图像
索引图像通常只存储该图像中的像素的颜色值,由一个颜色映射表和颜色索引矩阵组成,不用存储整个0-255的颜色表,因此占用的内存更小,处理更高效。
索引图像的颜色映射表为map,颜色索引矩阵为X,常常在加载load trees,matlab自带的索引图像时在工作区可以看到。
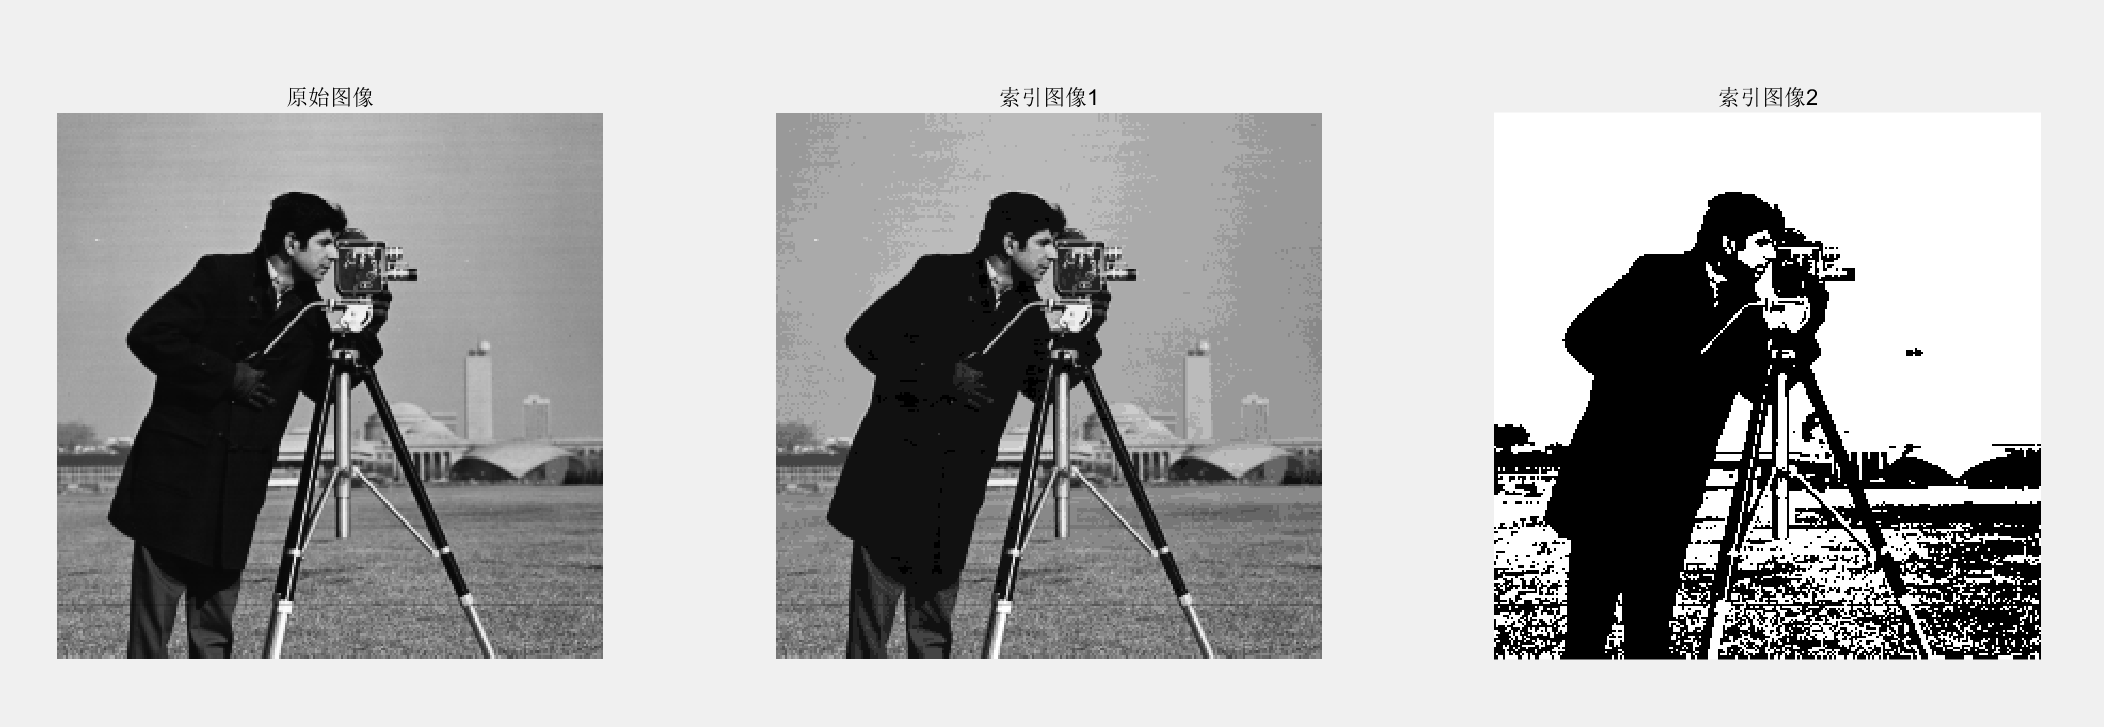
1.灰度图或二值图转换为索引图(gray2ind)
clear all;
I=imread('cameraman.tif');
subplot(131);
imshow(I);
title('原始图像');

subplot(132);
[X,map]=gray2ind(I,16);    %%I为图像,16为索引的颜色数
imshow(X,map);
title('索引图像1');


subplot(133);
[Y,map1]=gray2ind(I,2);
imshow(Y,map1);
title('索引图像2');
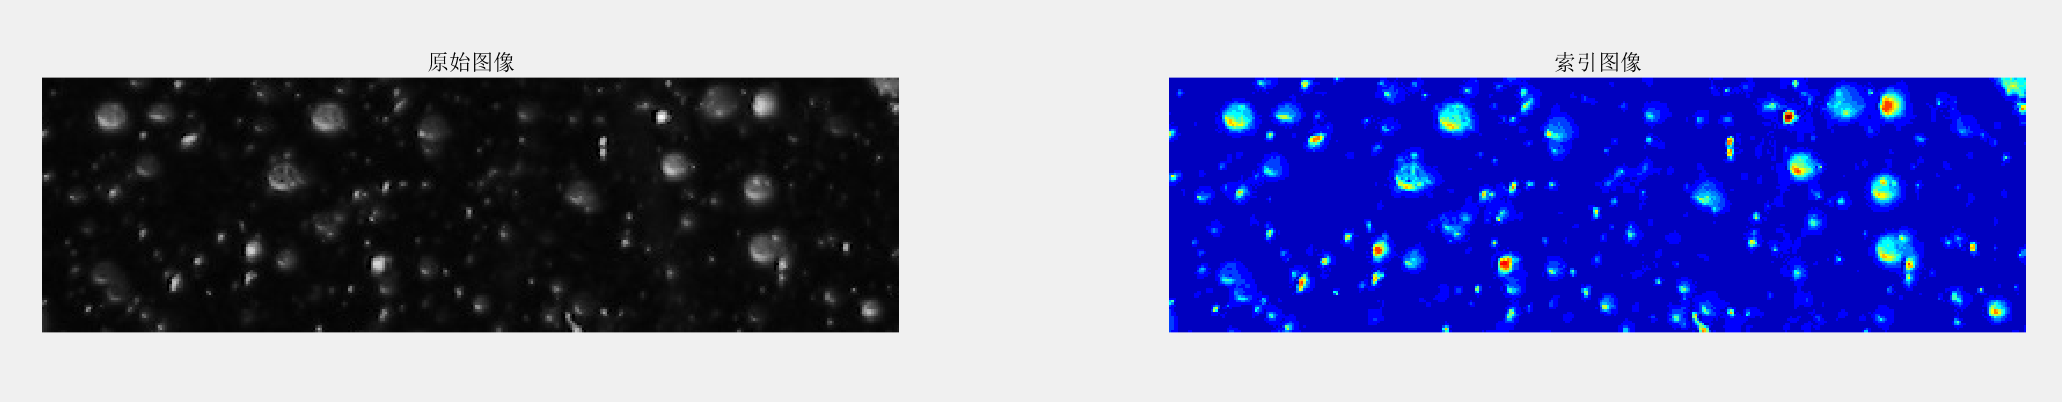
2.灰度图转换为索引图(grayslice)
clear all;
I=imread('snowflakes.png');
X=grayslice(I,16); %%将原始图片的灰度分为16个等级
subplot(121);
imshow(I);
title('原始图像');
subplot(122);
imshow(X,jet(16));   %%jet为颜色图数组,用16种颜色为16个等级上色
title('索引图像');
三、转换为灰度图像
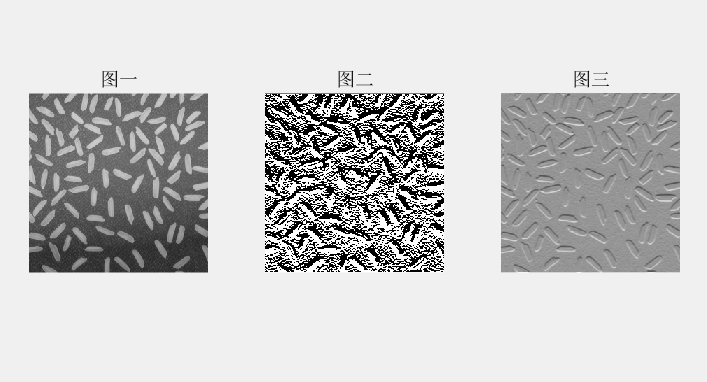
1.矩阵转灰度图像(mat2gray)
%%矩阵转灰度图像
clear all;
I=imread('rice.png');
subplot(131);
imshow(I);
title('图一');

J=filter2(fspecial('sobel'),I);  %二维滤波
subplot(132);
imshow(J);
title('图二');

subplot(133);
K=mat2gray(J);   %将矩阵转换成一个灰度图像
imshow(K);
title('图三');
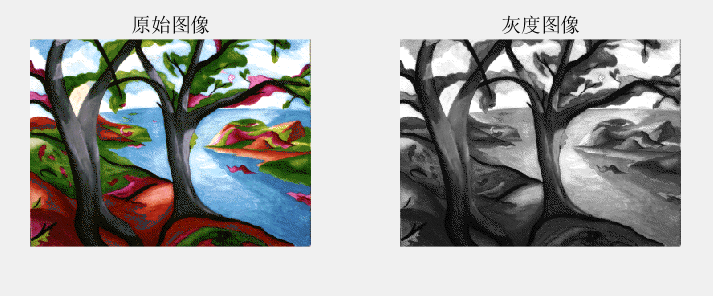
2.索引图像转灰度图像(ind2gray)
clear all;
load trees;
subplot(121);
imshow(X,map);
title('原始图像');
subplot(122);
I=ind2gray(X,map);
imshow(I);
title('灰度图像')
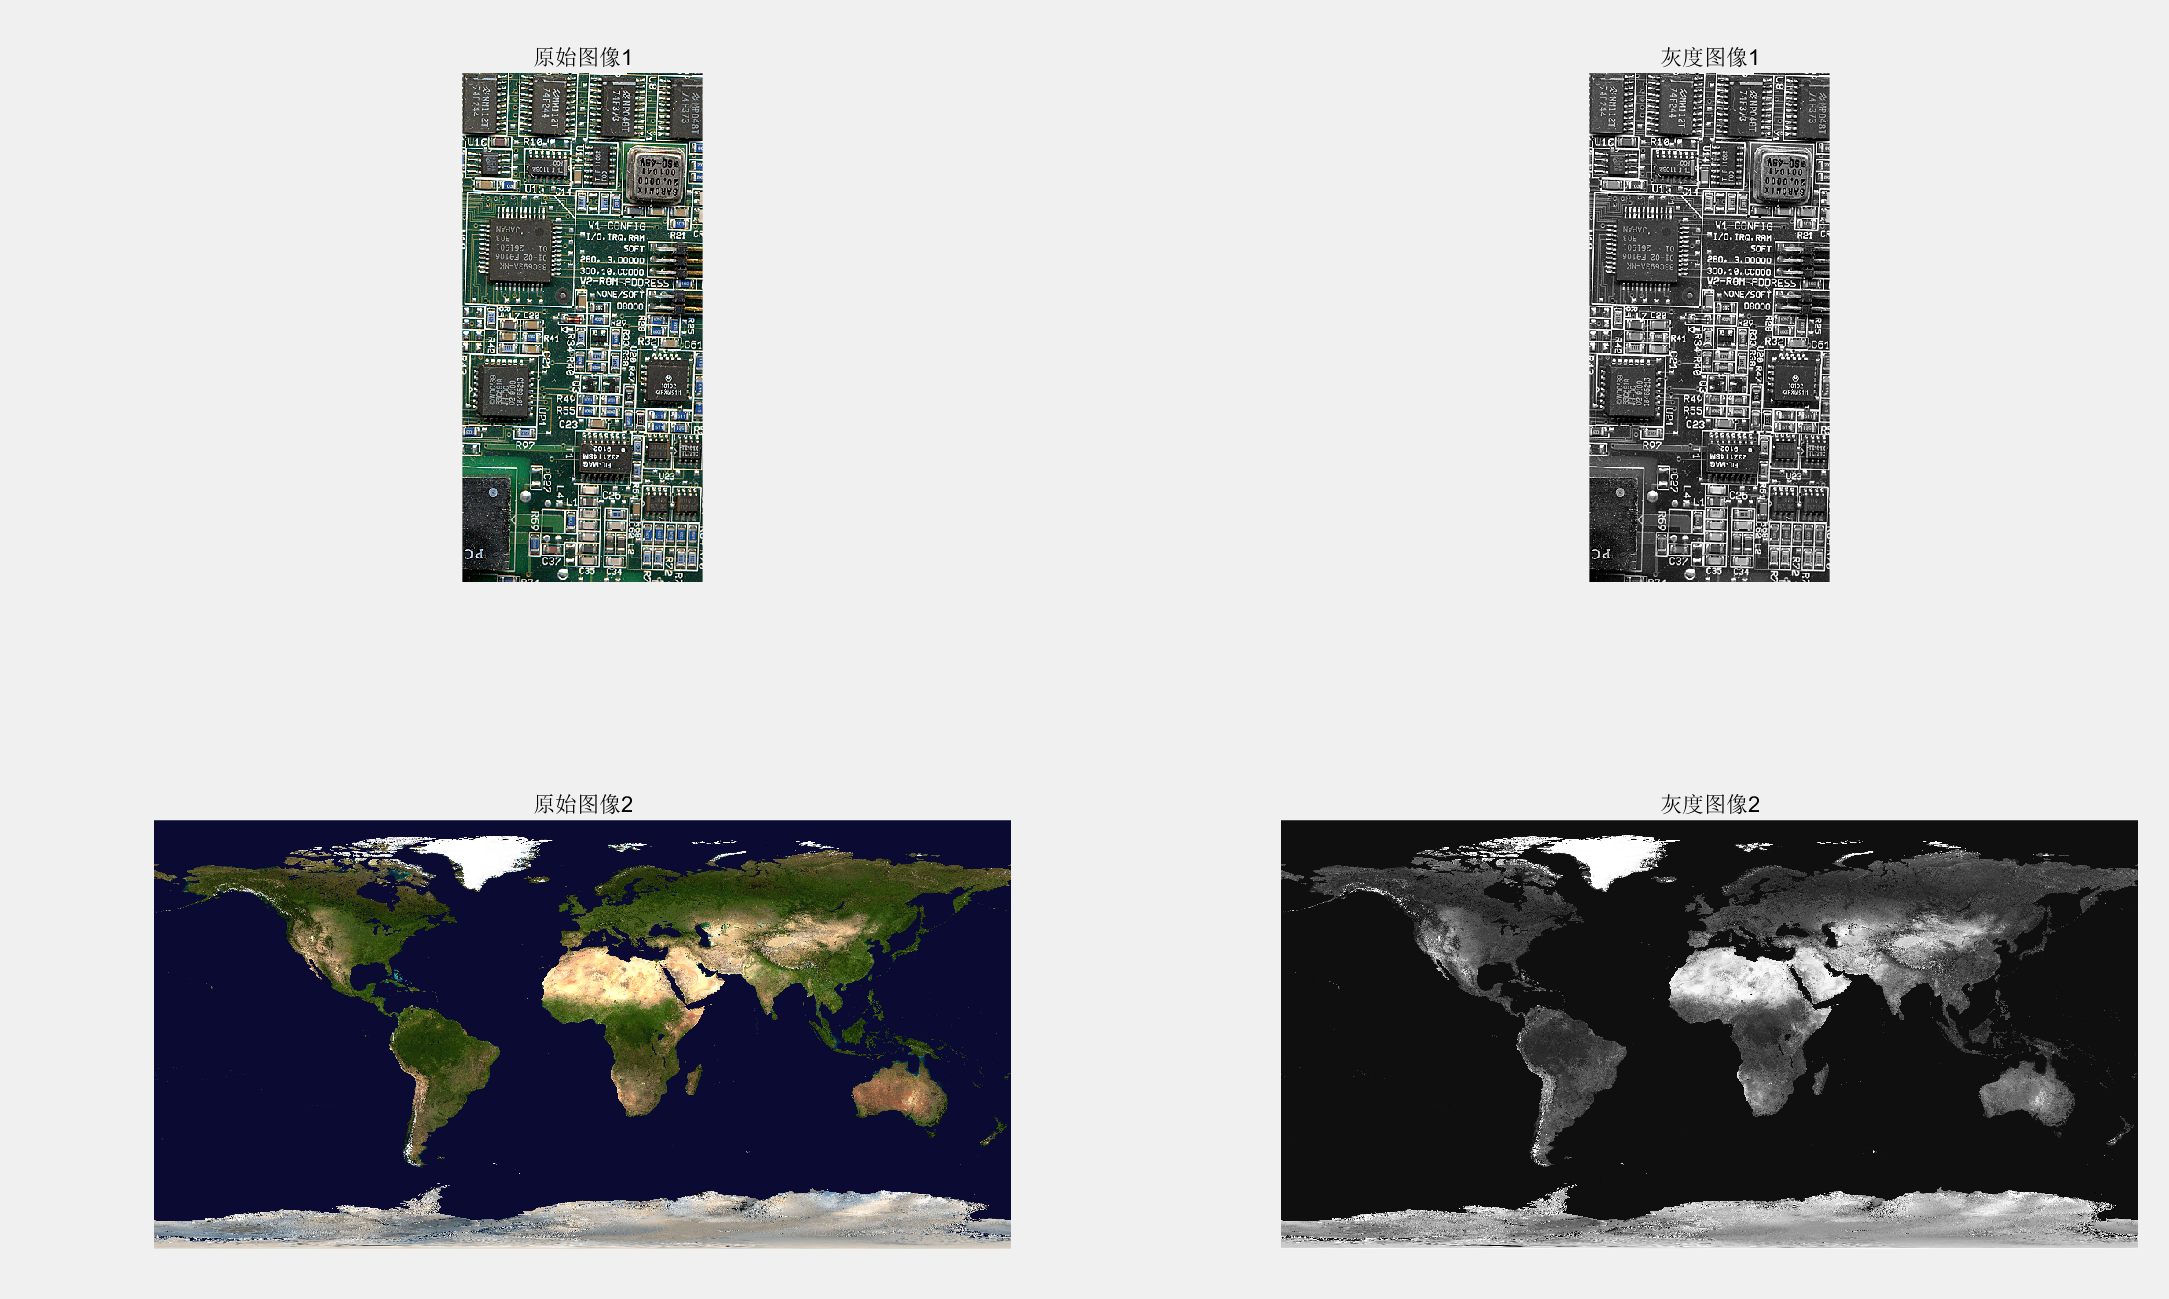
3.真彩色图像转灰度图像(rgb2gray)
clear all;
subplot(221);
I=imread('board.tif');
imshow(I);
title('原始图像1')
J=rgb2gray(I);
subplot(222);
imshow(J);
title('灰度图像1');

start=imread('imageRe\earth_color_10K.tif')
subplot(223)
imshow(start);
title('原始图像2');
gray_start=rgb2gray(start);
subplot(224);
imshow(gray_start);
title('灰度图像2')
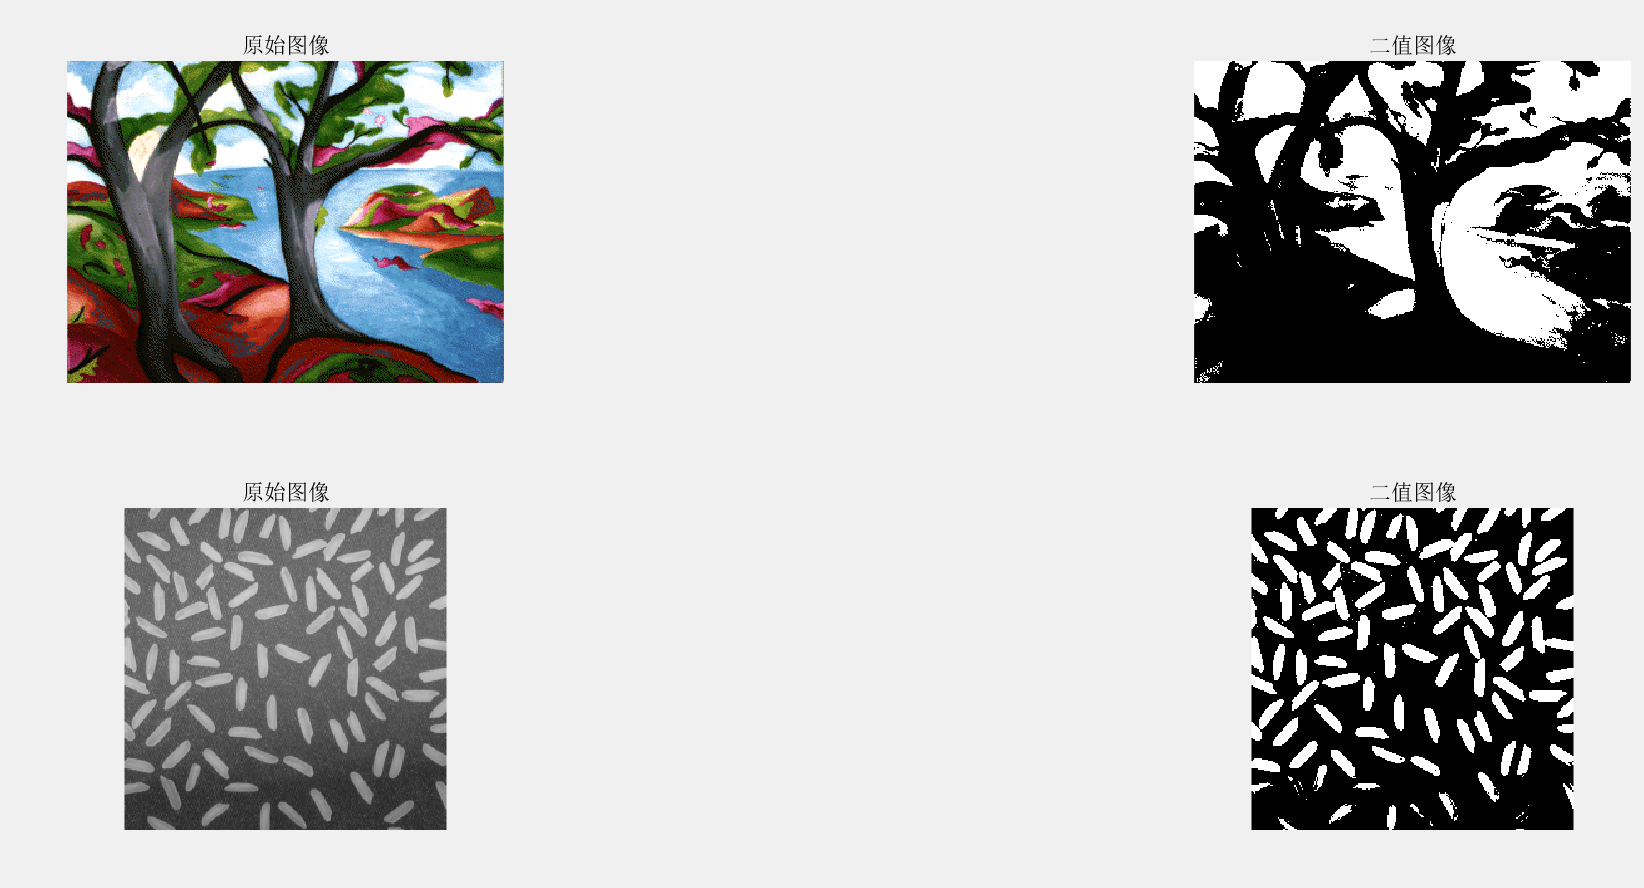
4.转换为二值图像
imbinarize
clear all;
load trees;     %加载matlab索引图像,trees,加载完成后会在工作区看到X,map数据
I=ind2gray(X,map);         %该索引图像为彩色图像,将索引图像转换为灰度图像
BW=imbinarize(I);     %转换为二值图像
figure
subplot(321);
imshow(X,map);
title('原始图像');
subplot(322);
imshow(BW);
title('二值图像');

J=imread('rice.png');
k=imbinarize(J);
subplot(323)
imshow(J);
title('原始图像');
subplot(324);
imshow(k);
title('二值图像');
总结
转换为真彩色:
demosaic bayer模式编码的tif图片转换成真彩色图片
tonemap用于hdr图片转换成真彩色图片
ind2rgb用于将索引图像转换为真彩色图像
转换为索引图像:
gray2ind用原始图像的色彩做颜色映射表
grayslice可以使用jet颜色组做颜色映射表
转换为灰度图像:
rgb2gray,rgb真彩色转换为灰度图像
ind2gray ,索引图像转换为灰度图像
mat2gray 矩阵转换为灰度图像
转换为二值图像:
imbinarize

 浙公网安备 33010602011771号