
Table of Contents
1 Motivation
use pacman python matplotlib graphviz to analysis ArchLinux Packages Repository by statistics and visualization.
2 Analysis
2.1 Number of packages and groups of remote repositories
| X | all | core | extra | community |
| packages | 5122 | 189 | 2681 | 2252 |
| groups | 70 | 0 | 0 | 0 |
2.2 Number of installed packages
| X | explict-installed | as-dependencies | orphans | foreign |
| N | 197 | 232 | 11 | 4 |
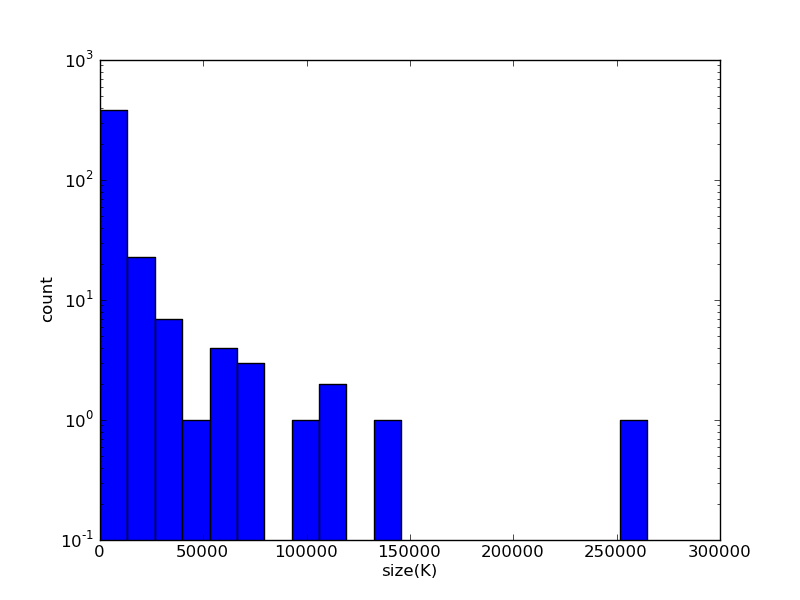
2.3 Package Installed Size Distribution
We use matplotlib to visualize package size distribution.
2.4 Package Dependencies
We use graphviz to visualize package dependencies. Red color nodes represent explict installed packages, Boxed nodes represent package groups.
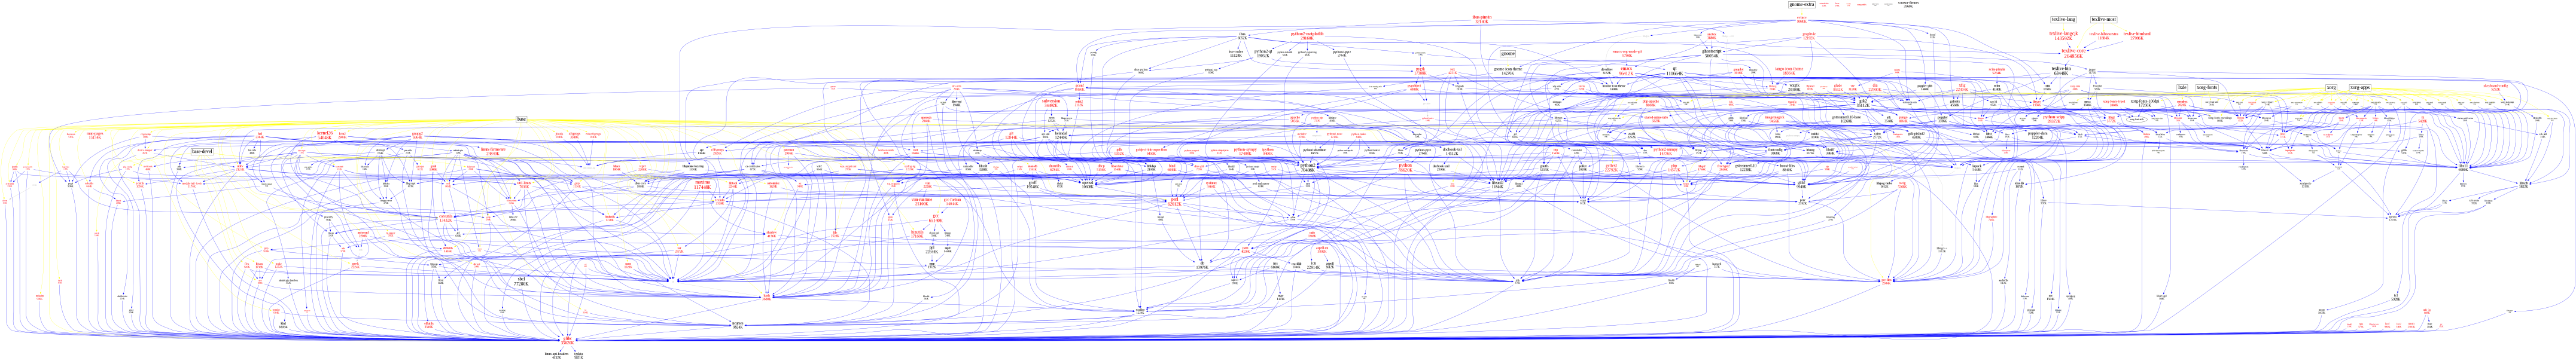 click here to see big image.
2.5 Source Code
You Can Access source code in https://github.com/huafengxi/pnotes/tree/master/pacman-analysis.

 浙公网安备 33010602011771号