vue 实现3D圆环图
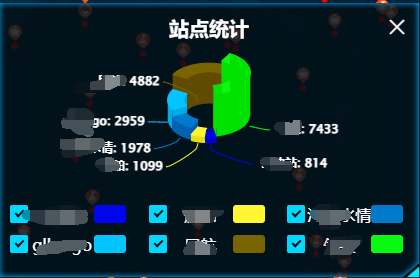
效果图如下:
实现程序主代码如下:
      initOption() {
          let quantity = 0; // 总数
          dataList.forEach((item) => {
          quantity += item.y;
          });
          if (dataList.length<=2) {
                dataList.forEach((item) => {
                item.bfb = parseInt((item.y / quantity) * 100);
                  item.h = item.bfb * 1.5 >= 70 ? 50 : 30
                });
          }else{
                dataList.forEach((item) => {
                item.bfb = parseInt((item.y / quantity) * 100);
                //   item.h = item.bfb * 1.5 >= 70 ? 70 : item.bfb * 1.5
                item.h = item.bfb * 1.5 >= 50 ? 50 : item.bfb * 1.5
                //   item.h = parseInt(0.86 * item.bfb); // 最高高度60,根据比例渲染高度
                // console.log(this.dataList, "dataList----->>>");
                });
          }
          // 修改3d饼图绘制过程
          var each = highcharts.each,
              round = Math.round,
              cos = Math.cos,
              sin = Math.sin,
              deg2rad = Math.deg2rad;
          highcharts.wrap(
          highcharts.seriesTypes.pie.prototype,
          "translate",
          function (proceed) {
              proceed.apply(this, [].slice.call(arguments, 1));
              // Do not do this if the chart is not 3D
              if (!this.chart.is3d()) {
              return;
              }
              var series = this,
              chart = series.chart,
              options = chart.options,
              seriesOptions = series.options,
              depth = seriesOptions.depth || 0,
              options3d = options.chart.options3d,
              alpha = options3d.alpha,
              beta = options3d.beta,
              z = seriesOptions.stacking
                  ? (seriesOptions.stack || 0) * depth
                  : series._i * depth;
              z += depth / 2;
              if (seriesOptions.grouping !== false) {
              z = 0;
              }
              each(series.data, function (point) {

              var shapeArgs = point.shapeArgs,
                  angle;
              point.shapeType = "arc3d";
              var ran = point.options.h;
              shapeArgs.z = z;
              shapeArgs.depth = depth * 0.75 + ran;
              shapeArgs.alpha = alpha;
              shapeArgs.beta = beta;
              shapeArgs.center = series.center;
              shapeArgs.ran = ran;
              angle = (shapeArgs.end + shapeArgs.start) / 2;
              point.slicedTranslation = {
                  translateX: round(
                  cos(angle) * seriesOptions.slicedOffset * cos(alpha * deg2rad)
                  ),
                  translateY: round(
                  sin(angle) * seriesOptions.slicedOffset * cos(alpha * deg2rad)
                  ),
              };
              });
          }
          );
          (function (H) {
          H.wrap(
              highcharts.SVGRenderer.prototype,
              "arc3dPath",
              function (proceed) {
              // Run original proceed method
              var ret = proceed.apply(this, [].slice.call(arguments, 1));
              ret.zTop = (ret.zOut + 0.5) / 100;
              return ret;
              }
          );
          })(highcharts);


          highcharts.chart(chart, {
          chart: {
              animation: false,
              backgroundColor: "none",
              type: "pie", //饼图
              margin: [0, 0, 0, 0],
              options3d: {
              enabled: true, //使用3d功能
              alpha: 58, //延y轴向内的倾斜角度
              //   beta: 0,
              },
              events: {
              load: function () {
                  var each = highcharts.each,
                  points = this.series[0].points;
                  each(points, function (p, i) {
                  p.graphic.attr({
                      translateY: -p.shapeArgs.ran,
                  });
                  p.graphic.side1.attr({
                      translateY: -p.shapeArgs.ran,
                  });
                  p.graphic.side2.attr({
                      translateY: -p.shapeArgs.ran,
                  });
                  });
              },
              },
          },
          legend: {
              enabled: false, // 关闭图例
              align: "right", //水平方向位置
              verticalAlign: "bottom", //垂直方向位置
              layout: "vertical",
              x: fontChart(-20),
              y: fontChart(30),
              symbolWidth: fontChart(10),
              symbolHeight: fontChart(10),
              symbolRadius: "50%", // 修改成圆
              itemMarginBottom: fontChart(8),
              useHTML: true,
              //labelFormat: '{name}    {y}',
              labelFormatter: function () {
              return (
                  // '<div style="width: .3125rem;display: inline-block">' +
                  this.name +
                  // ':  </div><div style="color: #00d7da;display: inline-block">' +
                  this.y
                  // +"</div>"
              );
              },
              itemStyle: {
              color: "#f4f4f6",
              fontSize: fontChart(12),
              },
          },
          title: {  //主标题
              text: ''
          },
          //   subtitle: {//二级标题
          //     text: "",
          //   },
          plotOptions: {
              pie: {
              allowPointSelect: false, // 禁用点击
              cursor: "pointer",
              //   depth: fontChart(50), //圆环的高度
              showInLegend: true,
              size: "50%", // 外圈直径大小
              innerSize: 50, // 内圈直径大小
              center: ["50%", "50%"],
              colors: color,
              dataLabels: {
                  useHTML: true,
                  enabled: true, //是否显示饼图的线形tip
                  inside:true,
                  crookDistance: '100%',
                  zIndex:999,
                  distance: 20,
                  borderColor: '#007acc',
                  align: "center",
                  position: "right",
                  padding: 0,
                //   format: "{point.name} : {point.y}",
                  formatter: function() {
                    if (this.percentage > 0)
                        return '<b>' + this.point.name + '</b>: ' + this.point.y; // 这里进行判断
                  },
                  color: "#ffffff",
                  x: 2,
                  style: {
                  fontSize: '8px',
                  },
              },
              },
          },
          credits: {
              enabled: false, // 禁用版权信息
          },
          series: [
              {
              type: "pie",
              name: "数量",
              startAngle:170,
              data: dataList,
              center:["50%", "50%"]
              },
          ],
          });
      }

 浙公网安备 33010602011771号