项目实战14—ELK 企业内部日志分析系统

本文收录在Linux运维企业架构实战系列
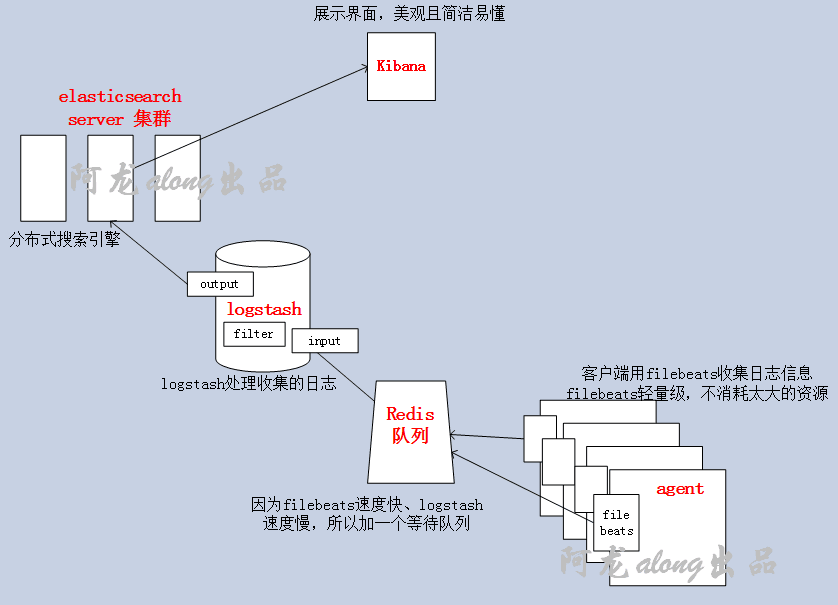
一、els、elk 的介绍
1、els,elk
els:ElasticSearch,Logstash,Kibana,Beats
elk:ElasticSearch,Logstash,Kibana
ElasticSearch 是一个基于Lucene的搜索引擎,提供索引,搜索功能。它提供了一个分布式多用户能力的全文搜索引擎,基于RESTful web接口。Elasticsearch是用Java开发的,并作为Apache许可条款下的开放源码发布,是当前流行的企业级搜索引擎。设计用于云计算中,能够达到实时搜索,稳定,可靠,快速,安装使用方便
Logstash 是一个开源的服务器端数据处理流水线,它可以同时从多个数据源获取数据,并将其转换为最喜欢的"存储"(Ours is Elasticsearch, naturally.)
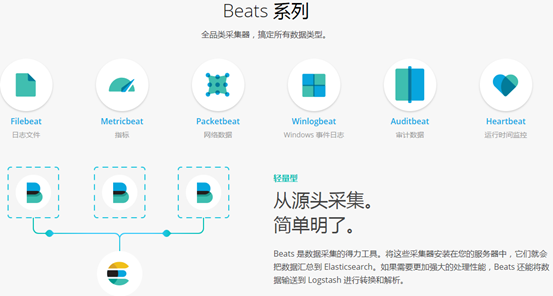
③ Beats:采集日志信息(加上beats 就是els),GO开发的,所以高效、很快
Filebeat:Log Files
Metricbeat:Metrics
Packetbeat:Network Data
Winlogbeat:Windows Event Logs
Heartbeat:Uptime Monitoring
Kibana 让你可视化你的Elasticsearch数据并导航Elastic Stack,所以你可以做任何事情,从凌晨2:00分析为什么你得到分页,了解雨水可能对你的季度数字造成的影响。
实验所需要的包(我用的是5.5.1版本),都放在我的网盘里了,需要的私聊 https://pan.baidu.com/s/1c2An0Co
|
机器名称 |
IP配置 |
服务角色 |
|
els |
192.168.1.101(私) 192.168.10.101(公) |
elasticsearch(搜索引擎) |
|
logstash |
192.168.1.102(私) 192.168.10.102(公) |
logstash(日志处理) redis(缓冲队列) |
|
filebeat
|
192.168.1.103(私) 192.168.10.103(公) |
filebeat(日志收集) httpd/mysql(生成日志) |
|
kibana |
192.168.1.104(私) 192.168.10.104(公) |
kibana(展示界面) |
② 修改主机名、hosts文件,确保节点直接能通过主机名连通
[root@els ~]# hostnamectl set-hostname els.along.com
[root@logstash ~]# hostnamectl set-hostname logstash.along.com
[root@filebeat ~]# hostnamectl set-hostname filebeat.along.com
[root@kibana ~]# hostnamectl set-hostname kibana.along.com
[root@els ~]# hostnamectl set-hostname 主机名
192.168.1.102 logstash.along.com
192.168.1.103 filebeat.along.com
192.168.1.104 kibana.along.com
[root@els ~]# ping filebeat.along.com
[root@els ~]# systemctl restart chronyd
二、安装搭建elasticsearch 和head 插件
1、安装elasticsearch
Elasticsearch 是一个分布式的 RESTful 风格的搜索和数据分析引擎,能够解决不断涌现出的各种用例。作为 Elastic Stack 的核心,它集中存储您的数据,帮助您发现意料之中以及意料之外的情况
[root@els ~]# yum install java-1.8.0-openjdk-devel -y
[root@els ~]# rpm -ivh elasticsearch-5.5.1.rpm
2、配置elasticsearch
[root@els ~]# vim /etc/elasticsearch/jvm.options 修改分配的空间大小
注意:不要超过32G,如果空间大,多跑几个实例,不要让一个实例太大内存
[root@els ~]# vim /etc/elasticsearch/elasticsearch.yml
cluster.name: alongels    #集群名字
node.name: els   #节点名
path.data: /els/data   #索引路径
path.logs: /els/logs    #日志存储路径
network.host: 192.168.10.101   #对外通信的地址,依次修改为自己机器对外的IP
#http.port: 9200    #默认端口
[root@els ~]# mkdir -pv /els/{data,logs} && chown -R elasticsearch.elasticsearch /els/*
[root@els ~]# systemctl start elasticsearch.service
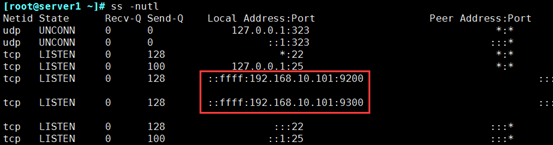
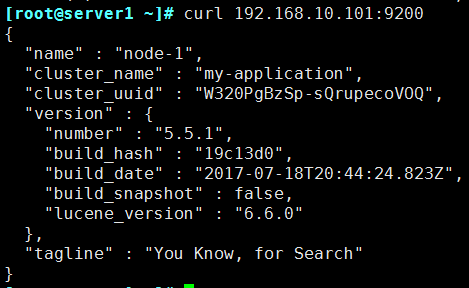
② [root@els ~]# curl 192.168.10.101:9200
3、搭建elasticsearch 集群(自己选择)
[root@els ~]# vim /etc/elasticsearch/elasticsearch.yml
cluster.name: alongels    #集群名字
node.name: els   #节点名,依次修改为els2,els3
path.data: /els/data   #索引路径
path.logs: /els/logs    #日志存储路径
network.host: 192.168.10.101   #对外通信的地址,依次修改为自己机器对外的IP
#http.port: 9200    #默认端口
discovery.zen.ping.unicast.hosts: ["els", "els2","els3"]   #发现方式,采用单播
discovery.zen.minimum_master_nodes: 2   #数量要大于集群中节点的半数
[root@els ~]# mkdir -pv /els/{data,logs} && chown -R elasticsearch.elasticsearch /els/*
[root@els2 ~]# mkdir -pv /els/{data,logs} && chown -R elasticsearch.elasticsearch /els/*
[root@els3 ~]# mkdir -pv /els/{data,logs} && chown -R elasticsearch.elasticsearch /els/*
[root@els3 ~]# systemctl start elasticsearch.service
4、安装elasticsearch 的head插件(Web前端)
https://github.com/mobz/elasticsearch-head 这里有github上的详细步骤
[root@els local]$ yum -y install git
[root@els local]$ git clone git://github.com/mobz/elasticsearch-head.git
[root@els local]$ cd elasticsearch-head/
[root@els elasticsearch-head]$ yum -y install npm
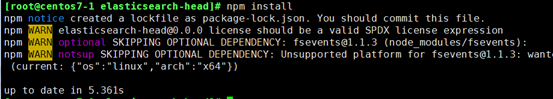
[root@els elasticsearch-head]$ npm install
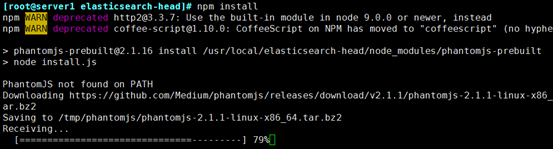
Error: Command failed: tar jxf /tmp/phantomjs/phantomjs-2.1.1-linux-x86_64.tar.bz2
bunzip2 /tmp/phantomjs/phantomjs-2.1.1-linux-x86_64.tar.bz2
tar -xvf /tmp/phantomjs/phantomjs-2.1.1-linux-x86_64.tar
再次执行[root@els elasticsearch-head]$ npm install
[root@els ~]$ vim /etc/elasticsearch/elasticsearch.yml
# ------------------------ Enable CORS in elasticsearch -------------------------
http.cors.enabled: true
http.cors.allow-origin: "*"      #授所有权限
① 重启elasticsearch 服务,打开了9100 端口
[root@els ~]$ service elasticsearch restart
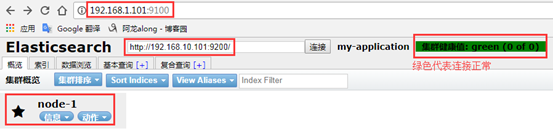
[root@els ~]# cd /usr/local/elasticsearch-head/
[root@els elasticsearch-head]# npm run start 前端运行
[root@els elasticsearch-head]# nohup npm run start & 后台运行
[root@els elasticsearch-head]# jobs 查看后台运行的任务
[1]+ Running nohup npm run start &
5、测试elasticsearch-head
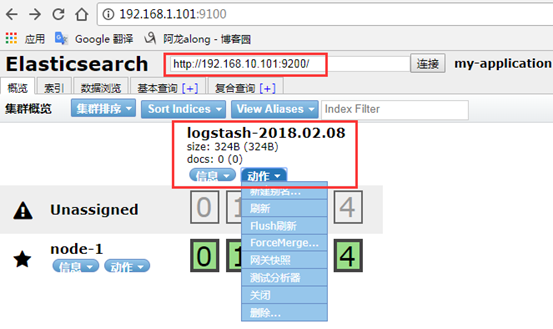
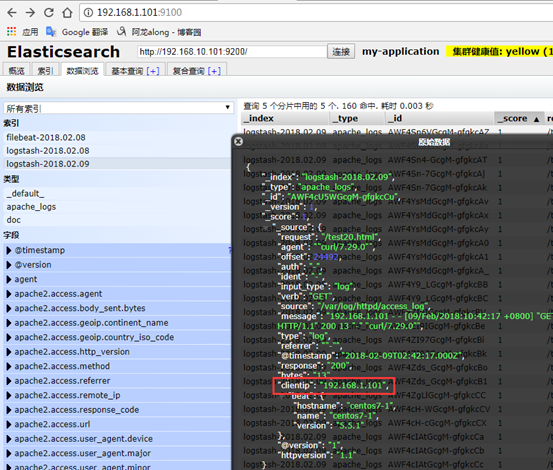
网页访问http://192.168.1.101:9100/
6、elasticsearch-head 的全功能文本搜索引擎库:lucene
https://lucene.apache.org/core/ 下载地址
Apache Lucene 是一个完全用Java编写的高性能,全功能的文本搜索引擎库。它几乎适用于任何需要全文搜索的应用程序,特别是跨平台的应用程序。
三、安装介绍logstash
1、介绍
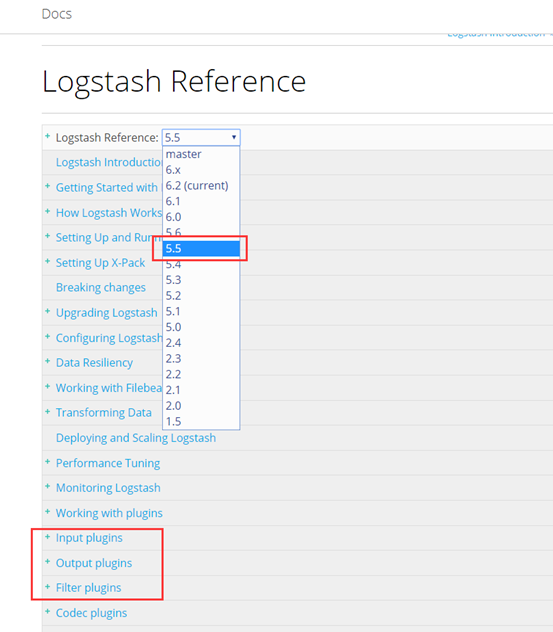
查看官方文档 https://www.elastic.co/cn/products/logstash
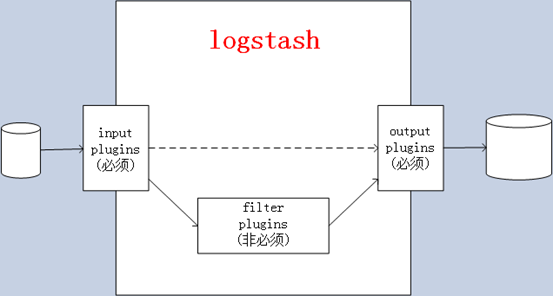
① 官方介绍:Logstash is an open source data collection engine with real-time pipelining capabilities。简单来说logstash就是一根具备实时数据传输能力的管道,负责将数据信息从管道的输入端传输到管道的输出端;与此同时这根管道还可以让你根据自己的需求在中间加上滤网,Logstash提供里很多功能强大的滤网以满足你的各种应用场景。
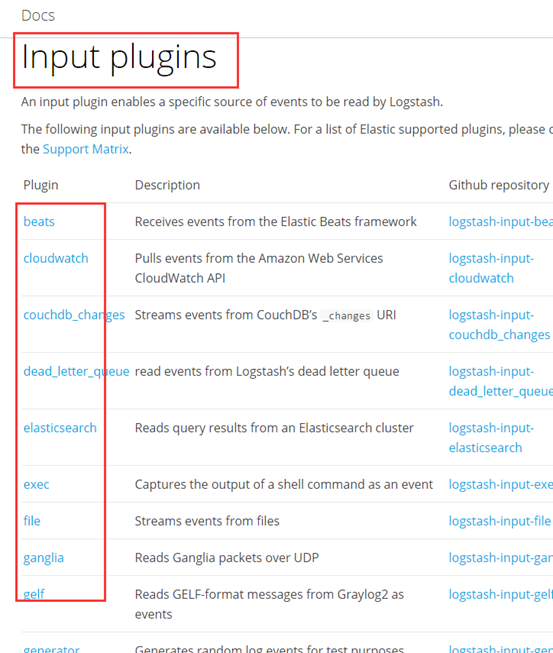
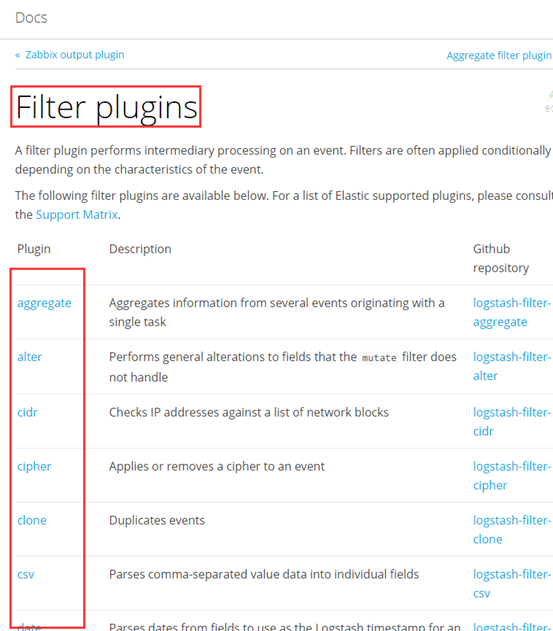
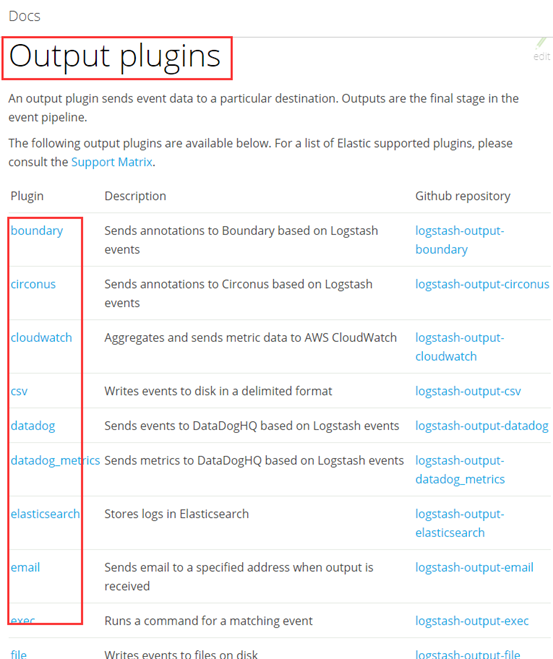
② Logstash的事件(logstash将数据流中等每一条数据称之为一个event)处理流水线有三个主要角色完成:inputs –> filters –> outputs:
- inpust:必须,负责产生事件(Inputs generate events),常用:File、syslog、redis、beats(如:Filebeats)
- filters:可选,负责数据处理与转换(filters modify them),常用:grok、mutate、drop、clone、geoip
- outpus:必须,负责数据输出(outputs ship them elsewhere),常用:elasticsearch、file、graphite、statsd
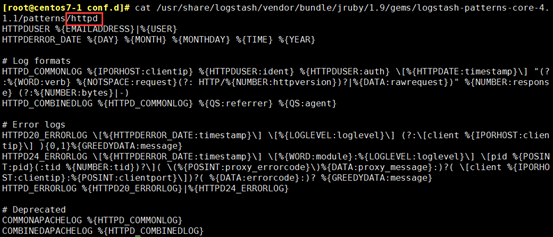
所谓的搜索模式就是像变量一样,把用的较多的事先定义好,便于多次引用
[root@centos7-1 conf.d]# rpm -ql logstash |grep pattern
[root@centos7-1 conf.d]# less /usr/share/logstash/vendor/bundle/jruby/1.9/gems/logstash-patterns-core-4.1.1/patterns/grok-patterns
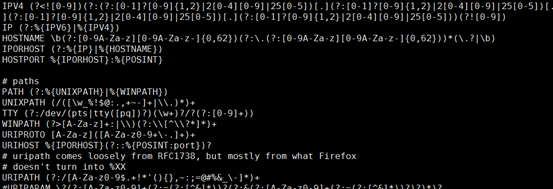
/usr/share/logstash/vendor/bundle/jruby/1.9/gems/logstash-patterns-core-4.1.1/patterns
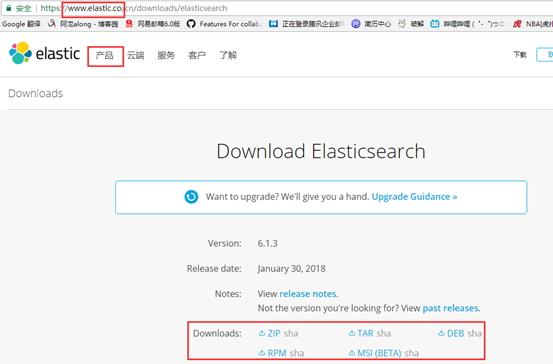
2、下载安装
① 去官网下载对应版本的logstash ,我下载的是5.5.1版本
https://www.elastic.co/cn/downloads/logstash
[root@centos7-1 els]# rpm -ivh logstash-5.5.1.rpm
[root@centos7-1 els]# vim /etc/profile.d/logstash.sh
export PATH=$PATH:/usr/share/logstash/bin/
[root@centos7-1 els]# . /etc/profile.d/logstash.sh
四、logstash 演示用法
[root@centos7-1 logstash]# cd /etc/logstash/conf.d/
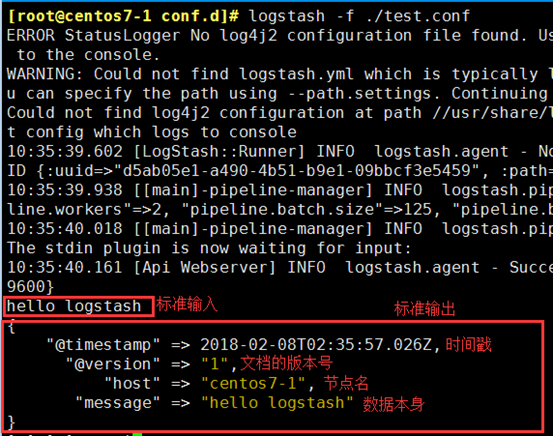
1、示例1:标准输入输出
[root@centos7-1 conf.d]# vim test.conf
input {
        stdin {}
}

output {
        stdout {
                codec => rubydebug
        }
}
[root@centos7-1 conf.d]# logstash -f ./test.conf -t
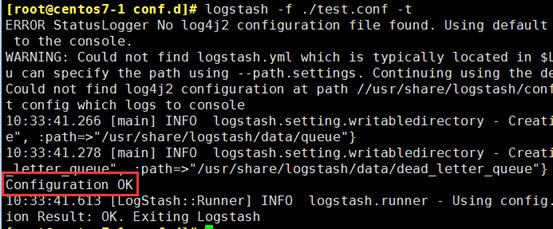
[root@centos7-1 conf.d]# logstash -f ./test.conf
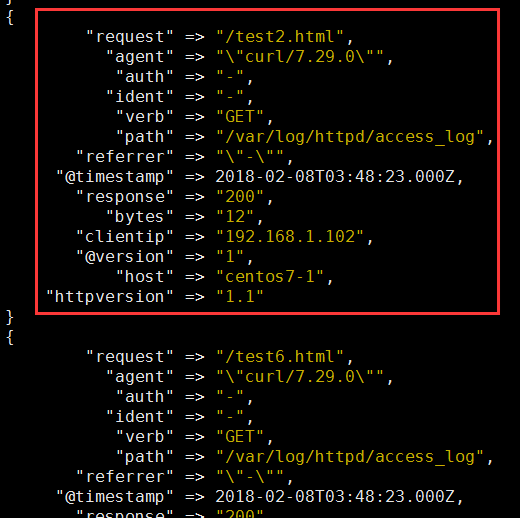
2、示例2:从文件输入数据,经grok 拆分插件过滤之后输出至标准输出
grok:拆分字段
date:修改时间格式
[root@centos7-1 ~]# yum install httpd
[root@centos7-1 ~]# systemctl start httpd
[root@centos7-1 ~]# vim /var/www/html/index.html
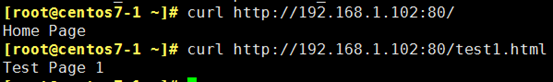
[root@centos7-1 ~]# for i in {1..20}; do echo "Test Page ${i}" > /var/www/html/test${i}.html; done
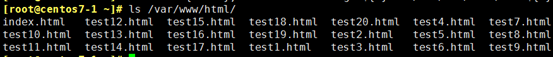

[root@centos7-1 ~]# for i in {1..200}; do j=$[$RANDOM%20+1]; curl http://192.168.1.102:80/test${j}.html; done
[root@centos7-1 conf.d]# vim test2.conf
input {
        file {
              path => ["/etc/httpd/logs/access_log"]
              start_position => "beginning"
}

filter {
    grok {    #拆分message 字段
         match => {      #指定匹配哪个字段
             "message" => "%{COMBINEDAPACHELOG}"   #引用定义好的搜索模式
         }
              remove_field => "message"    #删除message 字段
    }
    date {    #改变时间格式
              match => ["timestamp","dd/MMM/YYYY:H:m:s Z"]
              remove_field => "timestamp"    #删除原有的时间字段
    }
}

output {
        stdout {
                codec => rubydebug
        }
}
[root@centos7-1 conf.d]# logstash -f test2.conf -t
[root@centos7-1 conf.d]# logstash -f test2.conf
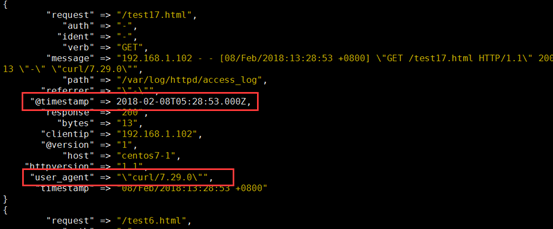
3、示例3:filter 的date、mutate 插件
mutate:修改字段
① 编辑配置文件,由于input、output还是标准输入输出,就没有贴出
[root@centos7-1 conf.d]# vim test3.conf
filter {
        grok {
                match => {
                "message" => "%{HTTPD_COMBINEDLOG}"
        }
}
        date {
                match => ["timestamp","dd/MMM/YYYY:H:m:s Z"]
        }
        mutate {
                rename => {
                        "agent" => "user_agent"
                }
        }
}
[root@centos7-1 conf.d]# logstash -f test3.conf -t
[root@centos7-1 conf.d]# logstash -f test3.conf
4、示例4:filter 的geoip 模块
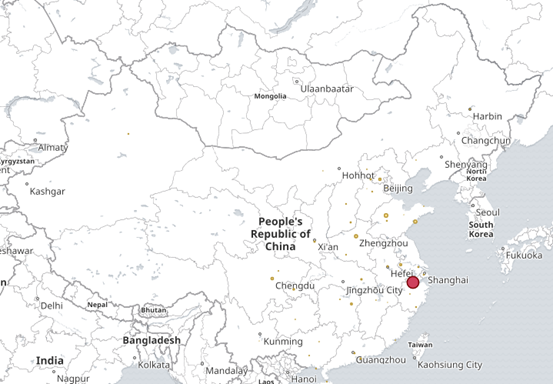
geoip:利用这个模块解析ip的地址,利于后边kibana 的地理位置展示图
网上下载数据库,因为是记录世界的IP 地址,所以经常有变动,可以写一个计划任务,每隔一周去网上下载一次,解包,链接到maxmind 下
[root@centos7-1]# tar -xvf GeoLite2-City.tar.gz
[root@centos7-1]# mv GeoLite2-City_20170704/ /etc/logstash/
[root@centos7-1 logstash]# mv GeoLite2-City_20170704/ maxmind
[root@centos7-1 ~]# echo '112.168.1.102 - - [08/Feb/2018:15:28:53 +0800] "GET /test6.html HTTP/1.1" 200 12 "-" "curl/7.29.0"' >> /var/log/httpd/access_log
① 编辑配置文件,由于input、output还是标准输入输出,就没有贴出
[root@centos7-1 conf.d]# vim tes4.conf
filter {
        grok {
                match => {
                "message" => "%{HTTPD_COMBINEDLOG}"
        }
}
        geoip {
                source => "clientip"   #哪个源ip 字段,转换为地理位置
                target => "geoip"   #目标信息存储时的健名
                database => "/etc/logstash/maxmind/GeoLite2-City.mmdb"    #数据库路径
        }
}
[root@centos7-1 conf.d]# logstash -f test4.conf -t
[root@centos7-1 conf.d]# logstash -f test4.conf
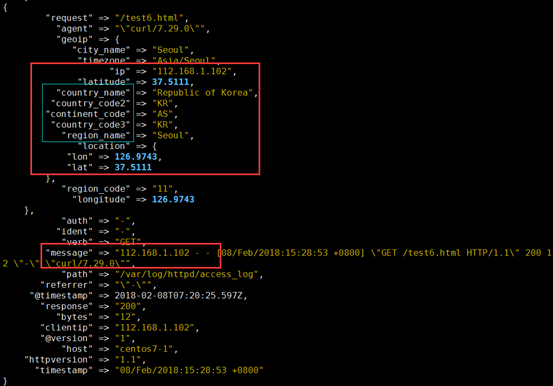
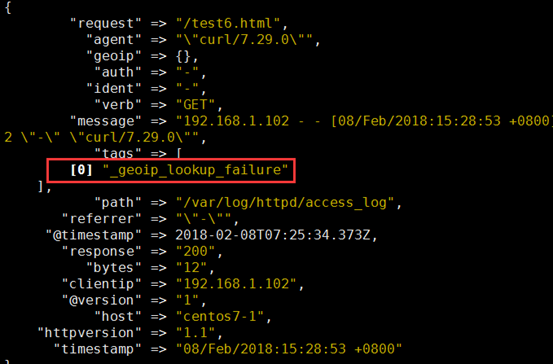
[root@centos7-1 ~]# echo '192.168.1.102 - - [08/Feb/2018:15:28:53 +0800] "GET /test6.html HTTP/1.1" 200 12 "-" "curl/7.29.0"' >> /var/log/httpd/access_log
5、示例5:output 输出给elasticsearch
[root@centos7-1 conf.d]# vim test5.conf
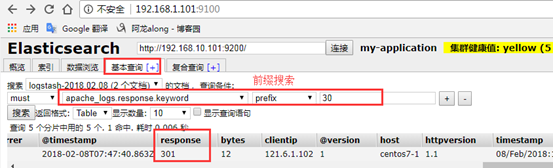
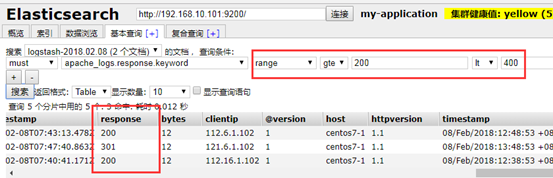
input {
        file {
                path => ["/var/log/httpd/access_log"]
                start_position => "beginning"
        }
}

filter {
        grok {
                match => {
                "message" => "%{HTTPD_COMBINEDLOG}"
        }
}
        geoip {
                source => "clientip"
                target => "geoip"
                database => "/etc/logstash/maxmind/GeoLite2-City.mmdb"
        }
}

output {
        elasticsearch {
                hosts => ["http://192.168.10.101:9200/"]   #主机
                index => "logstash-%{+YYYY.MM.dd}"   #索引
                document_type => "apache_logs"    #文档类型标识,自己定义
        }
}
6、示例6:output 输出给redis
[root@logstash]# vim /etc/redis.conf
requirepass ilinux.io #加密码,为了安全运行
开启redis
[root@centos7-1 conf.d]# systemctl start redis 打开6379 端口
[root@centos7-1 conf.d]# vim test6.conf
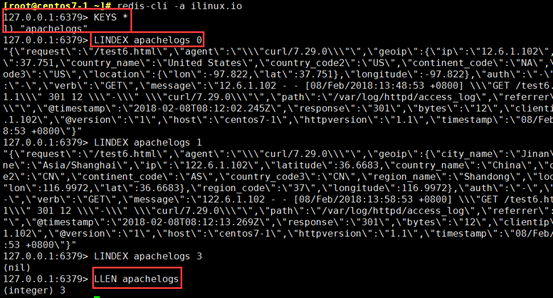
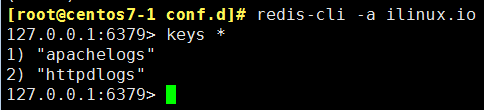
output {
        redis {
                batch => true    #批量写入
                host => "192.168.10.102"   #主机
                password => "ilinux.io"   #密码
                port => 6379  #端口
                #db => 0     #默认就是0号库
                data_type => "list"   #数据格式,列表
                key => "apachelogs"   #自己定义的键
        }
}
② [root@logstash]# logstash -f test6.conf
[root@centos7-1 ~]# redis-cli -a ilinux.io
127.0.0.1:6379> LLEN apachelogs
127.0.0.1:6379> LINDEX apachelogs 1
(4)注:logstash 开启的方法:
① logstash 指令指定配置文件启动
logstash -f test.conf
② systemctl start logstash 命令启动
此命令启动,要确保/etc/logstash/conf.d 目录下没有其他多余的配置文件。
五、Beats 轻量型数据采集器
Beats 平台集合了多种单一用途数据采集器。这些采集器安装后可用作轻量型代理,从成百上千或成千上万台机器向 Logstash 或 Elasticsearch 发送数据。
1、下载
[root@centos7-1 ~]# rpm -ivh filebeat-5.5.1-x86_64.rpm
2、示例1:配置filebeats,目标elasticsearch
[root@filebeat ~]# vim /etc/filebeat/filebeat.yml
#================= Filebeat prospectors =====================
filebeat.prospectors:
  paths:
    - /var/log/httpd/*log

#exclude_lines: ["^DBG"]    黑名单
#include_lines: ["^ERR", "^WARN"]   白名单

#-------------------------- Elasticsearch output ------------------------------
output.elasticsearch:
  # Array of hosts to connect to.
  hosts: ["192.168.10.101:9200"]    #主机和端口
  #protocol: "https"     #如果是https
  #username: "elastic"    #用户,如果elasticsearch设置的有的话
  #password: "changeme"    #密码
[root@centos7-1 filebeat]# systemctl start filebeat.service
[root@centos7-1 ~]# yum install httpd
[root@centos7-1 ~]# systemctl start httpd
[root@centos7-1 ~]# vim /var/www/html/index.html
[root@centos7-1 ~]# for i in {1..20}; do echo "Test Page ${i}" > /var/www/html/test${i}.html; done

[root@centos7-1 ~]# for i in {1..20}; do j=$[$RANDOM%20+1]; curl http://192.168.1.102:80/test${j}.html; done
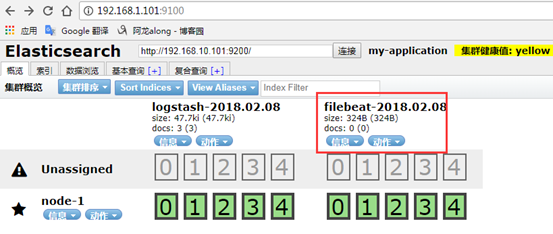
3、示例2:完整的ELK —> 配置filebeat,目标给logstash
[root@filebeat ~]# vim /etc/filebeat/filebeat.yml
filebeat.prospectors:
- input_type: log
  paths:
    - /var/log/httpd/*log

output.logstash:
  hosts: ["192.168.10.102:5044"]
[root@centos7-1 filebeat]# systemctl start filebeat.service
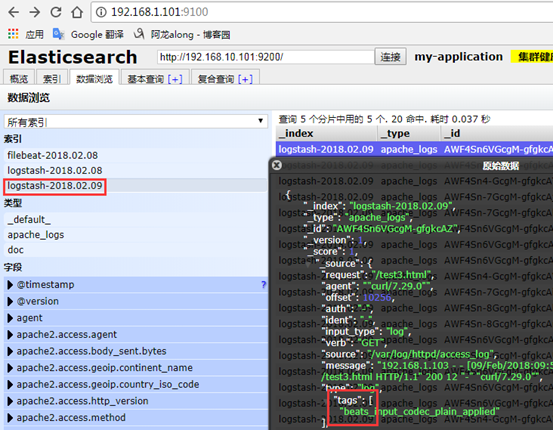
[root@logstash conf.d]# vim /etc/logstash/conf.d/apachelogs.conf
input {
        beats {
                port => 5044
        }
}

filter {
        grok {
                match => {
                "message" => "%{HTTPD_COMBINEDLOG}"
                }
        }
}

output {
        elasticsearch {
                hosts => ["http://192.168.10.101:9200/"]
                index => "logstash-%{+YYYY.MM.dd}"
                document_type => "apache_logs"
        }
}
[root@centos7-1 conf.d]# logstash -f apachelogs.conf -t 测试
[root@centos7-1 filebeat]# systemctl restart filebeat.service
4、示例3:完整的els搭建
[root@filebeat ~]# vim /etc/filebeat/filebeat.yml
filebeat.prospectors:
- input_type: log
  paths:
    - /var/log/httpd/*log
#----------------------------- Redis output --------------------------------
output.redis:
  hosts: ["192.168.10.102"]
  password: "ilinux.io"
  key: "httpdlogs"
  datatype: "list"
  db: 0
  timeout: 5
[root@centos7-1 conf.d]# redis-cli -a ilinux.io 查询有key值,有数据
[root@logstash conf.d]# vim /etc/logstash/conf.d/apachelogs.conf
input {
        redis {
                host => "192.168.10.102"
                port => "6379"
                password => "ilinux.io"
                data_type => "list"
                key => "httpdlogs"
                threads => 2
        }
}

filter {
        grok {
                match => {
                        "message" => "%{HTTPD_COMBINEDLOG}"
                }
        }
        date {
                match => ["timestamp","dd/MMM/YYYY:H:m:s Z"]
                remove_field => "timestamp"
        }
}

output {
        elasticsearch {
                hosts => ["http://192.168.10.101:9200/"]
                index => "logstash-%{+YYYY.MM.dd}"
                document_type => "apache_logs"
        }
}
[root@filebeat ~]# systemctl start logstash
六、kibana
1、介绍
kibana 是您走进 Elastic Stack 的窗口,Kibana 让您能够可视化 Elasticsearch 中的数据并操作Elastic Stack,因此您可以在这里解开任何疑问:例如,为何会在凌晨 2:00 被传呼,雨水会对季度数据造成怎样的影响。
Kibana 让您能够自由地选择如何呈现您的数据。或许您一开始并不知道自己想要什么。不过借助Kibana 的交互式可视化,您可以先从一个问题出发,看看能够从中发现些什么。
Kibana 核心搭载了一批经典功能:柱状图、线状图、饼图、环形图,等等。它们充分利用了Elasticsearch 的聚合功能。
利用我们的 Elastic Maps Services 来实现地理空间数据的可视化,或者发挥创意,在您自己的地图上实现自定义位置数据的可视化。
您可以利用 Timelion,对您 Elasticsearch 中的数据执行高级时间序列分析。您可以利用功能强大、简单易学的表达式来描述查询、转换和可视化。
凭借搜索引擎的相关性功能,结合 graph 探索,揭示您 Elasticsearch 数据中极其常见的关系。
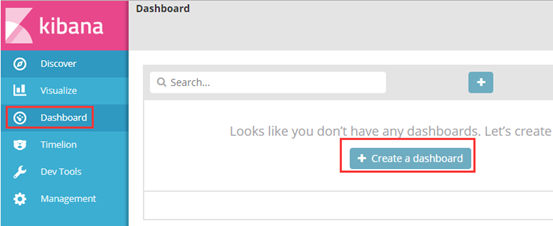
2、安装搭建
从官网上下载对应的版本https://www.elastic.co/cn/downloads/kibana
[root@kibana ~]#rpm -ivh kibana-5.5.1-x86_64.rpm
server.port: 5601
server.host: "0.0.0.0"
server.name: "kibana.along.com"
elasticsearch.url: "http://192.168.10.101:9200"
[root@kibana ~]# systemctl start kibana.service
3、配置使用kibana
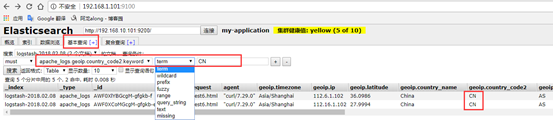
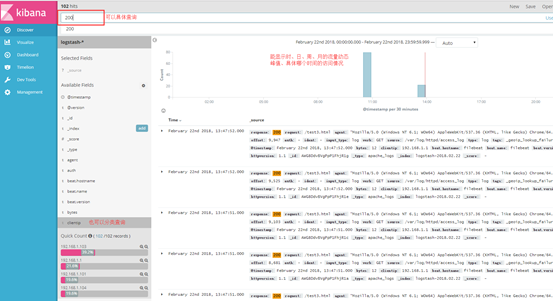
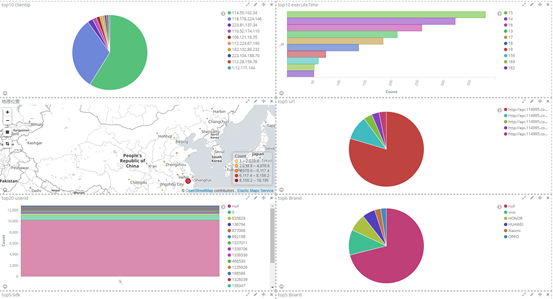
(1)打开网页 http://192.168.1.104:5601,选择logstash 发送的日志,就直接显示效果了
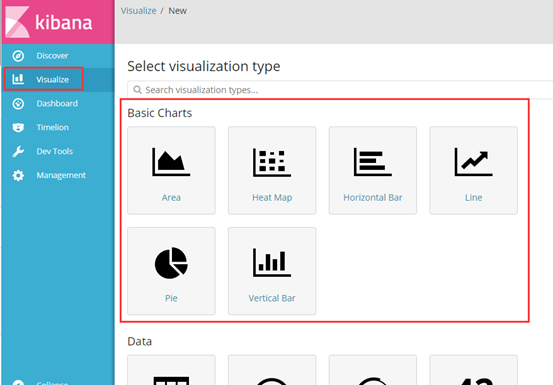
我以饼状图为例,创建top5 来源ip、top10 请求点击页面 的饼状图
选择对什么进行聚合图形,我选择对自己设置的terms 词条进行聚合,再选择clientip.keyword 的key键值,最后展示
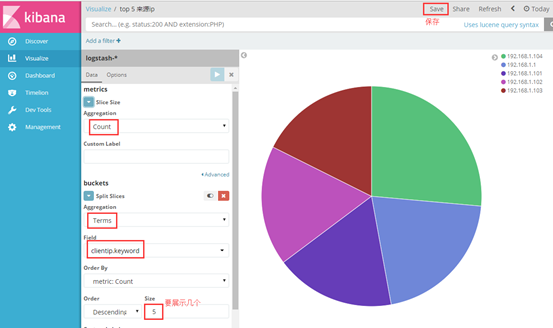
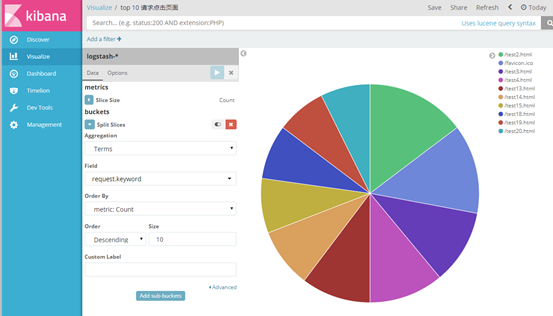
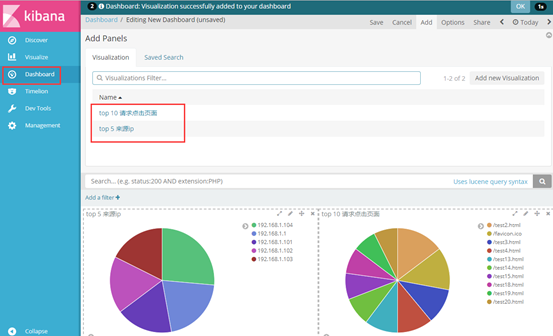
(3)其他字段都可进行设置,多种图案,也可将多个图形放在一起展示
4、kibana 用法详解
可参考http://blog.csdn.net/qq_23598037/article/details/79560639
有什么问题,欢迎讨论~
如果您认为这篇文章还不错或者有所收获,您可以通过右边的“打赏”功能 打赏我一杯咖啡【物质支持】,也可以点击右下角的【赞】按钮【精神支持】,因为这两种支持都是我继续写作,分享的最大动力!
作者:along阿龙
出处:http://www.cnblogs.com/along21/
简介:每天都在进步,每周都在总结,你的一个点赞,一句留言,就可以让博主开心一笑,充满动力!
版权:本文版权归作者和博客园共有,欢迎转载,但未经作者同意必须保留此段声明,且在文章页面明显位置给出原文连接,否则保留追究法律责任的权利。
已将所有赞助者统一放到单独页面!签名处只保留最近10条赞助记录!查看赞助者列表
| 衷心感谢打赏者的厚爱与支持!也感谢点赞和评论的园友的支持! | ||
|---|---|---|
| 打赏者 | 打赏金额 | 打赏日期 |
| 微信:*光 | 10.00 | 2019-04-14 |
| 微信:小罗 | 10.00 | 2019-03-25 |
| 微信:*光 | 5.00 | 2019-03-24 |
| 微信:*子 | 10.00 | 2019-03-21 |
| 微信:云 | 5.00 | 2019-03-19 |
| 支付宝:马伏硅 | 5.00 | 2019-03-08 |
| 支付宝:唯一 | 10.00 | 2019-02-02 |
| 微信:*亮 | 5.00 | 2018-12-28 |
| 微信:流金岁月1978 | 10.00 | 2018-11-16 |
| 微信:,别输给自己, | 20.00 | 2018-11-06 |

 浙公网安备 33010602011771号