matplotlib之matplotlib.pyplot.yticks(ticks=None, labels=None, **kwargs)函数
matplotlib 中的 xticks 函数用于设置坐标轴的刻度和标签,包括位置和显示的文本标签。
matplotlib.pyplot.xticks(ticks=None, labels=None, **kwargs)
ticks: 刻度位置,可以是一个列表或数组。labels: 刻度对应的标签,可以是一个列表或数组。**kwargs: 其他关键字参数,用于控制刻度的外观属性。
最佳实践:
- 可以使用
rotation参数旋转刻度标签,以防止标签重叠。 - 使用
fontsize参数调整字体大小。 - 如果需要显示中文标签,参考前面提到的字体设置方法。
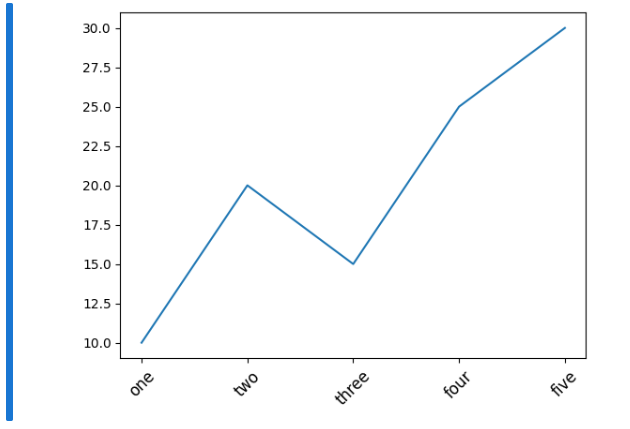
import matplotlib.pyplot as plt

# 数据
x = [1, 2, 3, 4, 5]
y = [10, 20, 15, 25, 30]

# 设置刻度和标签
plt.xticks(x, ['one', 'two', 'three', 'four', 'five'], rotation=45, fontsize=12)

# 绘制图表
plt.plot(x, y)
plt.show()

 浙公网安备 33010602011771号