
prometheus安装及使用
一、官网下载地址
https://prometheus.io/download/
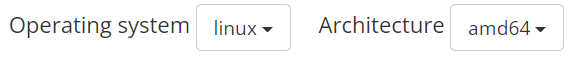
1、选择操作系统Linux,默认架构amd64即可。
2、主程序下载链接点击此处
https://github.com/prometheus/prometheus/releases/download/v2.35.0/prometheus-2.35.0.linux-amd64.tar.gz
3、警告工具
https://github.com/prometheus/alertmanager/releases/download/v0.24.0/alertmanager-0.24.0.linux-amd64.tar.gz
下载好的百度网盘地址:
链接:https://pan.baidu.com/s/1LkQ7Y1zfSMGmpOyIYisEAg
提取码:v9k6
二、安装
1、解压缩到/usr/loca/
tar xf prometheus-2.35.0.linux-amd64.tar.gz -C /usr/local/
2、采用软链接方式(因为版本会更新,软链接方便以后使用)
ln -s prometheus-2.35.0.linux-amd64 /usr/local/prometheu
3、查看配置文件
vim prometheus.yml
默认只有一个监控,监控本机的9090端口
 - job_name: "prometheus"

    # metrics_path defaults to '/metrics'
    # scheme defaults to 'http'.

    static_configs:
      - targets: ["localhost:9090"]
4,默认开启Prometheus (前台执行)
./prometheus
5、通过浏览器端打开主机IP地址(服务器时间一定要准时)
http://172.16.1.100:9090/
6、查看程序收集的自己信息
http://172.16.1.100:9090/metrics
7、使用
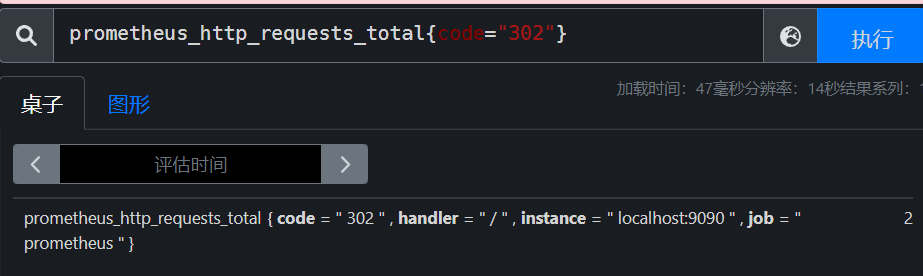
#7.1在搜索处输入下列命令
prometheus_http_requests_total{code="302"}
返回如下:
|
prometheus_http_requests_total { code = " 302 " , handler = " / " , instance = " localhost:9090 " , job = " prometheus " }
|
## prometheus_http_requests_total { code = " 302 " , 前面这段标签 ,localhost:9090 ,本机的9090端口
job =prometheus 表示普罗米修斯监控的程序
8、操作系统原生是不支持promutheus,需要安装包
tar xf node_exporter-1.3.1.linux-amd64.tar.gz -C /usr/local/
9、直接运行解压文件中的node_exporter文件即可
## 这里直接复制到bin下
cp node_exporter /usr/local/bin/
node_exporte ## 前台运行
## node_exporte 监控主机自身信息,如收集MySQL数据库的就安装mysql_exporte
10、修改普罗米修斯的配置文件
vim /usr/local/prometheus/prometheus.yml
## 在配置文件的末尾添加如下:(缩进非常重要,可以和自带的- job : "prometheus"对齐)
 ## ALL nodes
  - job_name: "nodes "
    static_configs:
    - targets:
      - 172.16.1.100:9100
      - 172.16.1.101:9100
11、通过网页端访问查看
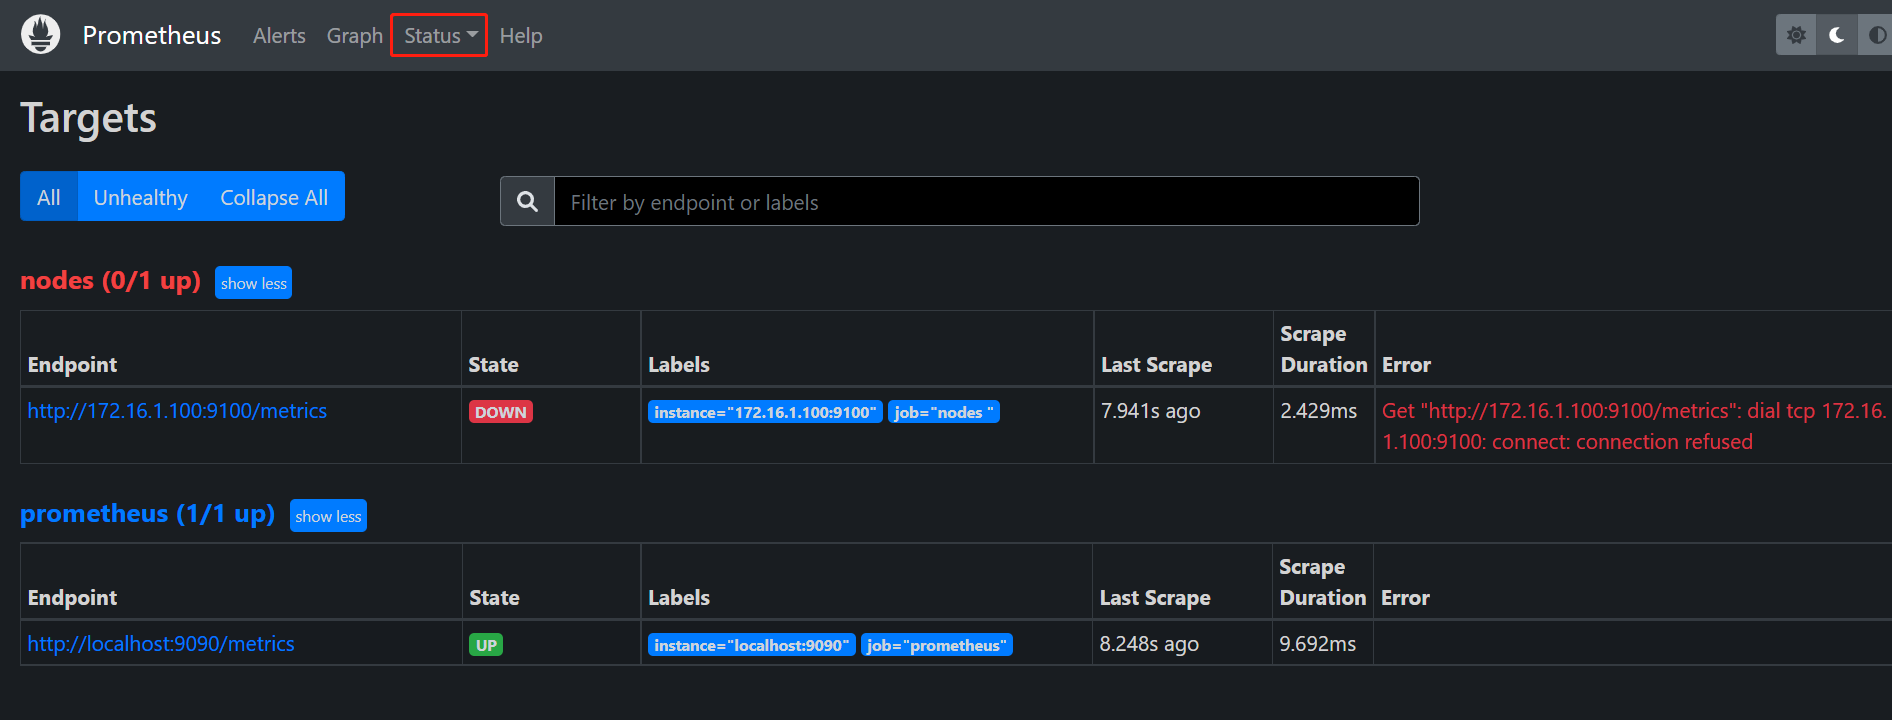
## down表示普罗米修斯连接不到的,我在第九步的时候运行了nodes_exporte(此时down应该是没刷新) 。up的那个是本机的普罗米修斯程序,

 浙公网安备 33010602011771号