


安装php xdebug调试工具及性能分析工具webgrind for windows
安装php xdebug调试工具及性能分析工具webgrind for windows
第一步:查看php版本等信息
phpinfo();
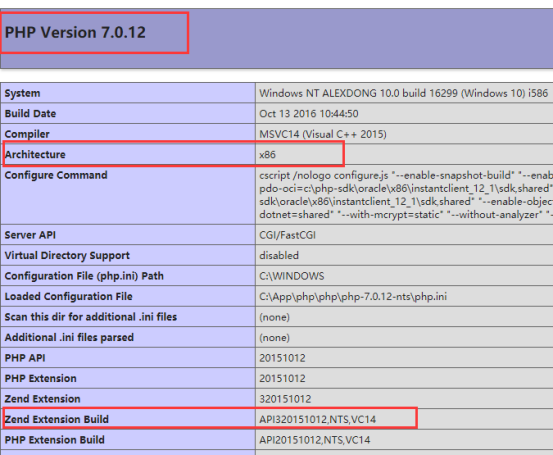
上面是 x86 NTS VC14
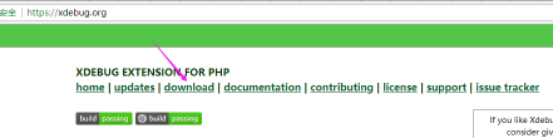
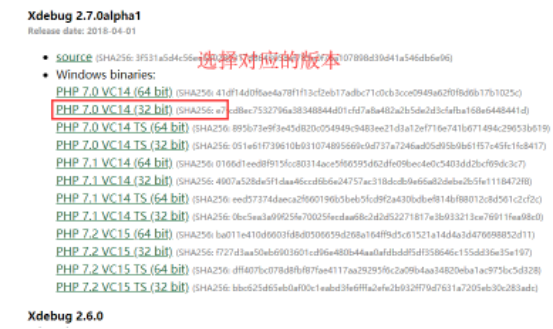
第二步: 下载xdebug
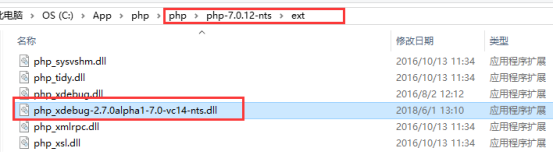
第三步:
下载扩展, 放入php的/ext 扩展目录
第四步: php.ini 开启扩展
配置其它选项:
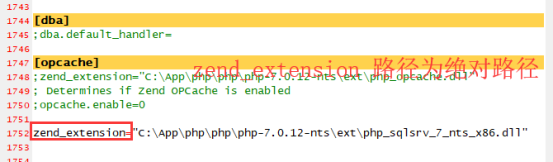
[Xdebug]
;指定Xdebug扩展文件的绝对路径
zend_extension="C:\App\php\php\php-7.0.12-nts\ext\php_xdebug-2.7.0alpha1-7.0-vc14-nts.dll"
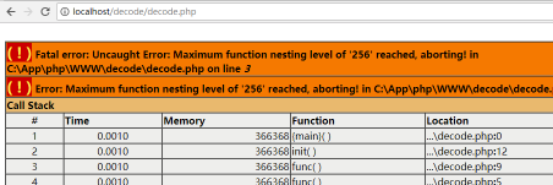
;最大循环或调试次数,防止死循环
xdebug.max_nesting_level=50
;启用性能检测分析
xdebug.profiler_enable=On
;启用代码自动跟踪
xdebug.auto_trace=on
;允许收集传递给函数的参数变量
xdebug.collect_params=On
;允许收集函数调用的返回值
xdebug.collect_return=On
;指定堆栈跟踪文件的存放目录
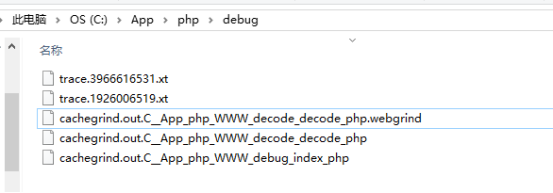
xdebug.trace_output_dir="C:\App\php\debug"
;指定性能分析文件的存放目录
xdebug.profiler_output_dir="C:\App\php\debug"
;追加
xdebug.profiler_append=1
;指定追踪文件名格式
;xdebug.profiler_output_name = "cachegrind.out.%c"
xdebug.profiler_output_name = "cachegrind.out.%s"
;远程调试是否开启
xdebug.remote_enable = On
;端口
xdebug.remote_port=9000
;远程调试地址
xdebug.remote_host = 127.0.0.1
;数组或对象最大层数 最大可设置1023
xdebug.var_display_max_depth = 10
;将require,include相关载入的文件名写入追踪文件
xdebug.collect_includes=1
;堆栈追踪
xdebug.default_enable=1
;打印请求方式
xdebug.dump.SERVER=REQUEST_METHOD
;打印GET请求参数
xdebug.dump.GET=*
;打印POST请求参数
xdebug.dump.POST=*
;打印COOKIE
;xdebug.dump.COOKIE=*
;打印UA
;xdebug.dump.SERVER=HTTP_USER_AGENT
配置好重启服务器
第五步: 使用
接下来使用xdebug的日志分析工具分析
xdebug 日志分析工具 webgrind v1.5
下载地址: https://github.com/jokkedk/webgrind
下载后如果是压缩包解压后 , 如图所示

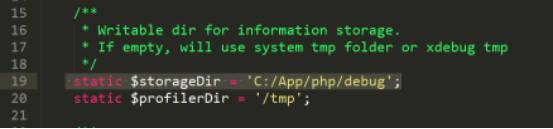
打开config.php 配置
static $storageDir = 'C:/App/php/debug'; // 配置为xdebug xdebug.profiler_output_dir 所指的目录
运行测试代码后, 访问webgrind的入口, 查看
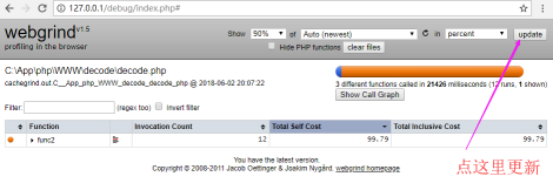
/END

 浙公网安备 33010602011771号