
phpstorm+Xdebug断点调试PHP
1. PHP安装xdebug扩展
php.ini的配置,下面的配置仅供参考,路径要换成自己的!
[xdebug]
zend_extension=php_xdebug.dll
xdebug.remote_handler="dbgp"
xdebug.remote_autostart=1
xdebug.show_local_vars=1
xdebug.dump.GET=*
xdebug.dump.POST=*
xdebug.dump.SERVER=*
xdebug.auto_trace=On
; default trace output directory /tmp
xdebug.collect_vars = On
xdebug.trace_output_dir=/tmp
xdebug.collect_params=4
xdebug.collect_return=On
xdebug.profiler_enable=Off
; default trace output directory /tmp
;xdebug.profiler_output_dir=/tmp
;xdebug.profiler_enable_trigger=On
;test.php?XDEBUG_PROFILE
xdebug.remote_enable=On
xdebug.remote_host="localhost"
xdebug.remote_port=9000
xdebug.remote_handler="dbgp"
xdebug.remote_log = "/tmp"
xdebug.remote_connect_back=1
xdebug.idekey=PHPStorm
ps : remote_handler 、remote_host、remote_port 这些都有默认值,但还是建议设置下,至少知道要设置这些参数~
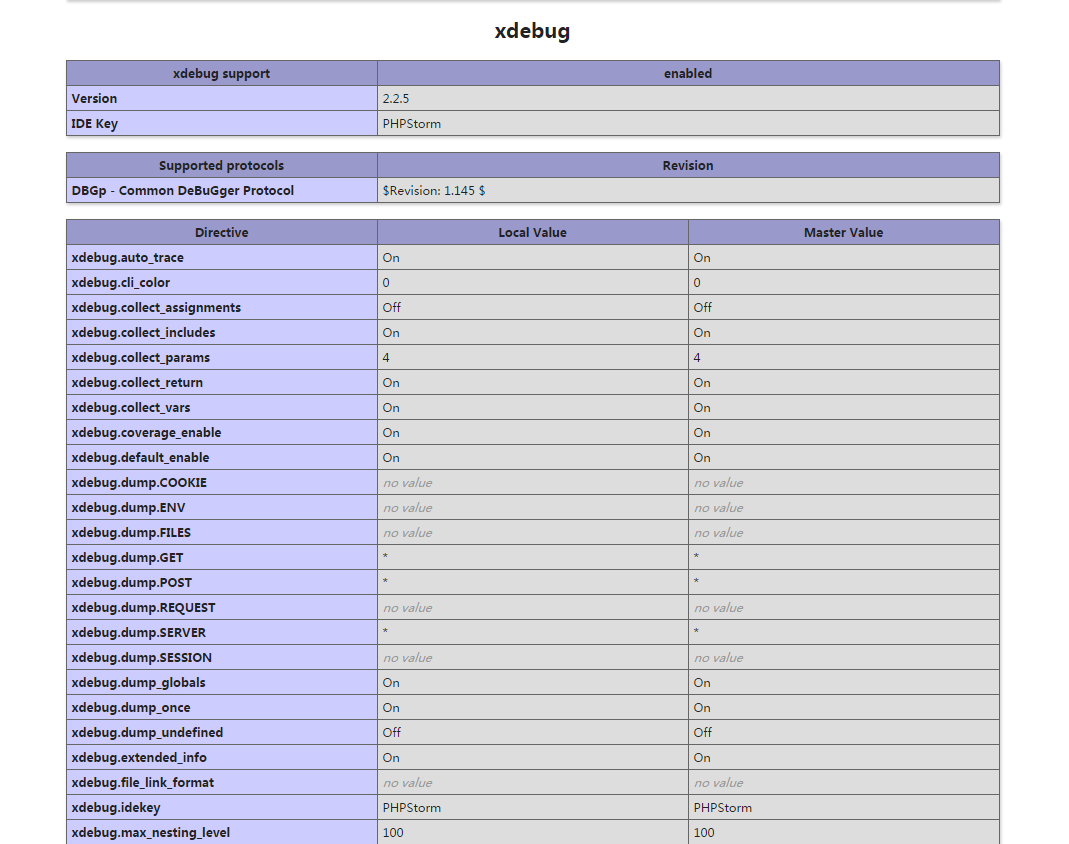
查看phpinfo~
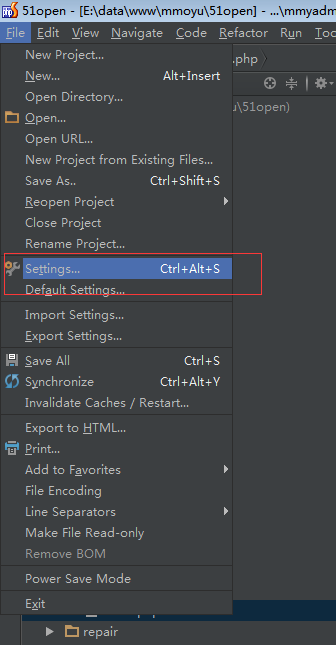
2.PHPSTORM设置
楼主以前一直用zendstudio,刚开始用phpstorm非常蛋疼,用了一段时间后发现还挺好用的~
1.首先检查phpstorm的xdebug配置
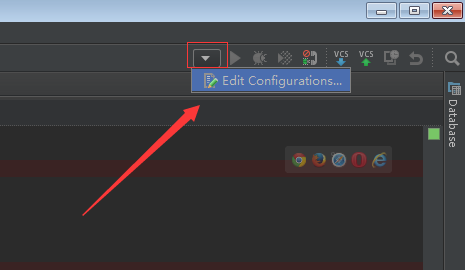
这里的debug port要和php.ini里面的xdebug.remote_port相一致!默认是9000,如果9000端口被占用的话,可以改成其他端口。


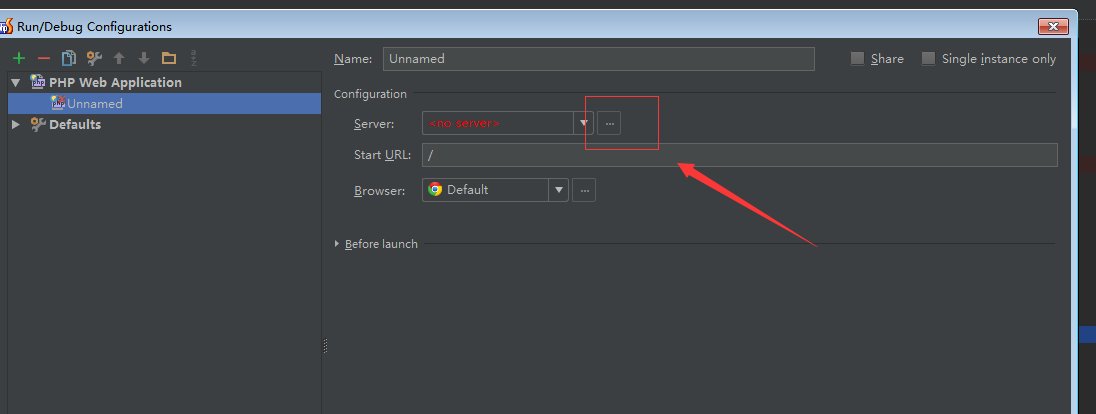
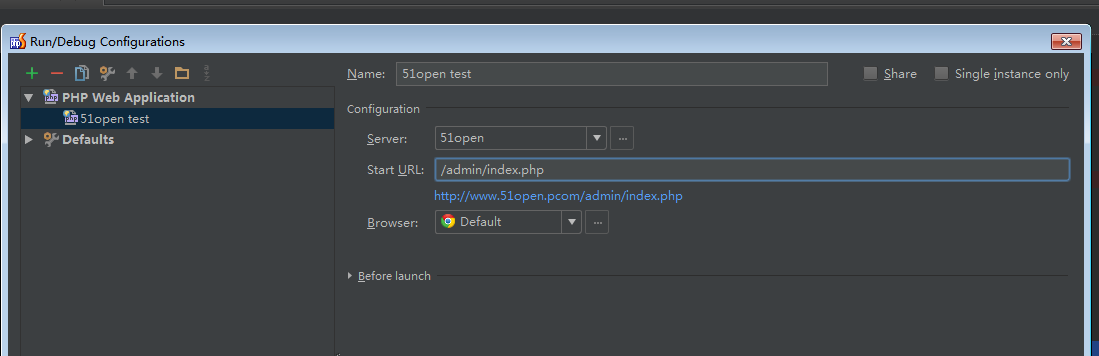
2. 设置debug.
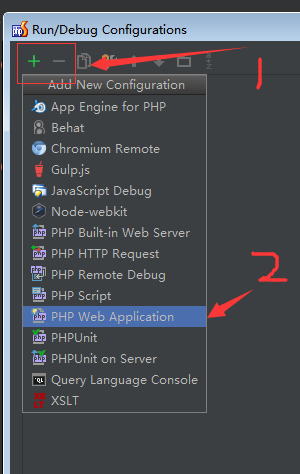
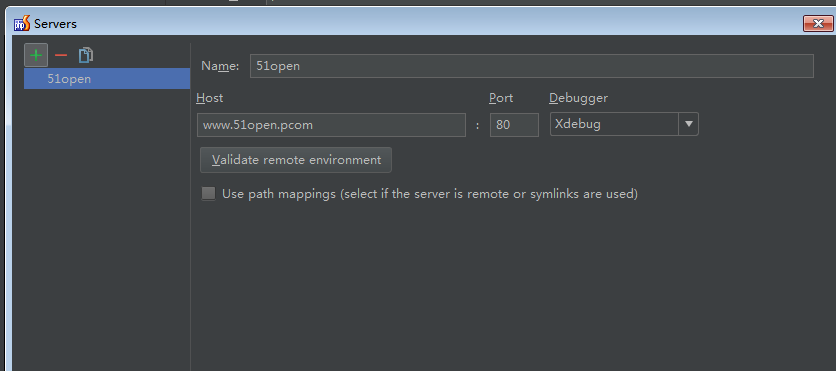
添加本地的 web server~
www.51open.pcom 是我本地的 web server~ ~
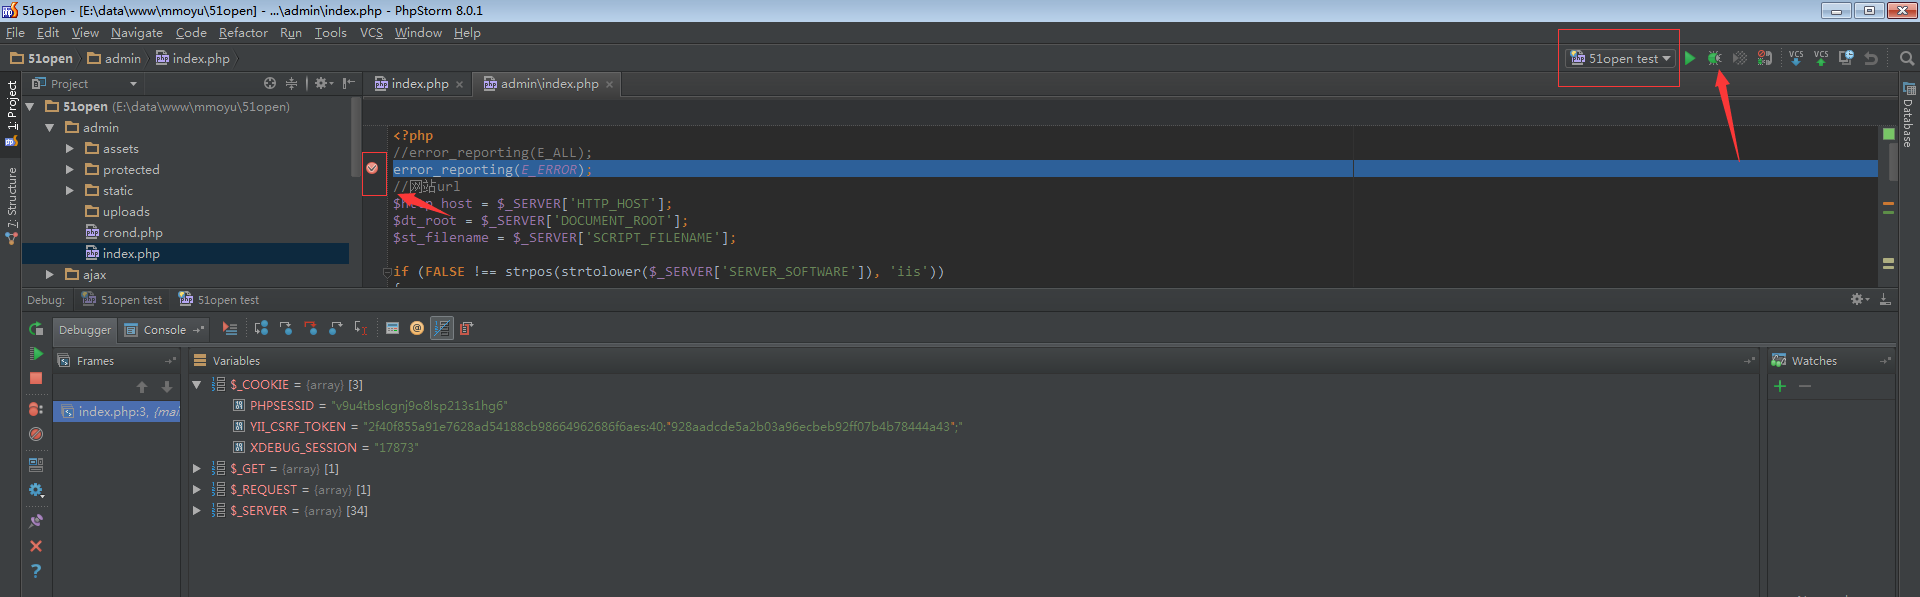
3.开始调试
-
打好第一个断点,shift + F9就可以了
-
打好第一个断点,选中配置的debug, 按旁边的臭虫 按钮

 浙公网安备 33010602011771号