
二进制部署prometheus+grafana+alertmanager(二)
二进制部署Prometheus服务端
1)下载及部署
[root@prometheus ~]# wget https://github.com/prometheus/prometheus/releases/download/v2.22.0/prometheus-2.22.0.linux-amd64.tar.gz
[root@prometheus ~]# tar xf prometheus-2.22.0.linux-amd64.tar.gz -C /usr/local/src/
[root@prometheus ~]# ln -s /usr/local/src/prometheus-2.22.0.linux-amd64/ /usr/local/prometheus
2)配置文件详解
[root@prometheus ~]# vim /usr/local/prometheus/prometheus.yml
#全局配置
global:
  scrape_interval:     15s # 将抓取间隔设置为每15秒一次.默认为每1分种一次.
  evaluation_interval: 15s # 每15秒评估一次规则.默认为每一分钟一次.
  # scrape_timeout 设置为全局默认值(10秒)
# 报警管理器配置
alerting:
  alertmanagers:
  - static_configs:
    - targets:
      # - alertmanager:9093
# 加载规则一次并根据全局"evaluation_interval"定期评估它们
rule_files:
  # - "first_rules.yml"
  # - "second_rules.yml"
# 一个只包含一个要抓取的端点的抓取配置:
# 这是 Prometheus 本身.
scrape_configs:
  # job名称会增加到拉取到的所有采样点上,同时还有一个instance目标服务的host:port标签也会增加到采样点上
  - job_name: 'prometheus'
    # metrics_path 默认为“/metrics”
    # 方案默认为“http”.
    static_configs:
    # 监控本地及端口
    - targets: ['localhost:9090']
3)作业和实例
可以抓取的目标称为实例(Instances)
具有相同目标的实例集合称为作业(Job)
scrape_configs:
  - job_name: 'prometheus' #作业
    static_configs:
      - targets: ['localhost:9090'] #实例
  - job_name: 'node'
    static_configs:
      - targets: ['192.168.1.10:9090']
4)启动服务
cat >/usr/lib/systemd/system/prometheus.service <<'EOF'
[Unit]
Description=Prometheus Server
After=network.target
[Service]
Restart=on-failure
ExecStart=/usr/local/prometheus/prometheus --config.file=/usr/local/prometheus/prometheus.yml --storage.tsdb.retention=3d
[Install]
WantedBy=multi-user.target
EOF
这里只指定了一个配置文件选项,可以添加其它选项 使用 ./prometheus --help 查看其它选项
常用选项
--storage.tsdb.path="data/" 指定数据目录
--storage.tsdb.retention=15d 指定留存数据时间范围
--web.listen-address="0.0.0.0:9090" 监听地址
--web.max-connections=512 最大连接数
[root@prometheus ~]# systemctl enable prometheus && systemctl start prometheus
Created symlink from /etc/systemd/system/multi-user.target.wants/prometheus.service to /usr/lib/systemd/system/prometheus.service.
[root@prometheus ~]# ss -lnpt|grep 9090
LISTEN 0 128 [::]:9090 [::]😗 users:(("prometheus",pid=1516,fd=8))
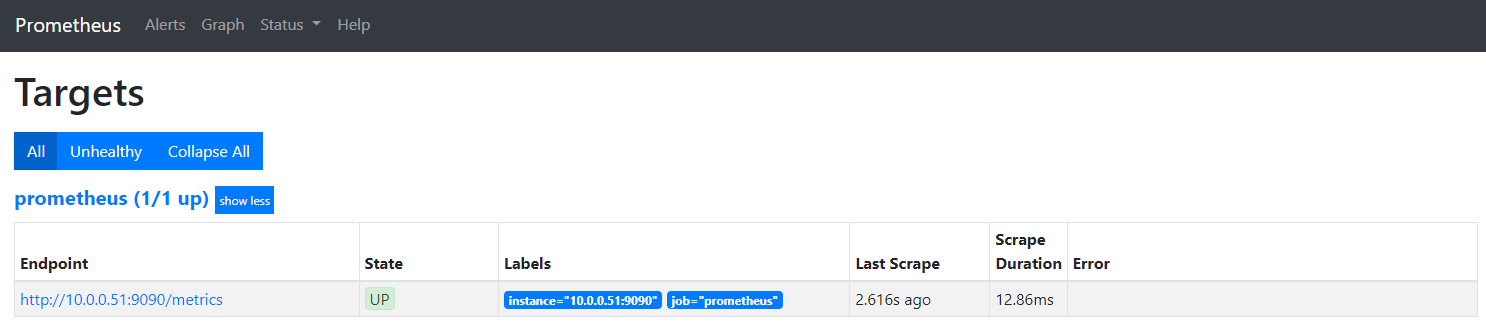
浏览器访问 http://10.0.0.51:9090/targets
二进制部署grafana
1)Grafana介绍
Grafana是一个跨平台的开源的度量分析和可视化工具,可以将采集的数据可视化的展示,并及时通知给告警接收方。它主要有以下六大特点:
1)展示方式:快速灵活的客户端图表,面板插件有许多不同方式的可视化指标和日志,官方库中具有丰富的仪表盘插件,比如热图、折线图、图表等多种展示方式;
2)数据源:Graphite,InfluxDB,OpenTSDB,Prometheus,Elasticsearch,CloudWatch和KairosDB等;
3)通知提醒:以可视方式定义最重要指标的警报规则,Grafana将不断计算并发送通知,在数据达到阈值时通过Slack、PagerDuty等获得通知;
4)混合展示:在同一图表中混合使用不同的数据源,可以基于每个查询指定数据源,甚至自定义数据源;
5)注释:使用来自不同数据源的丰富事件注释图表,将鼠标悬停在事件上会显示完整的事件元数据和标记.
2)安装grafana
[root@prometheus ~]# wget https://dl.grafana.com/oss/release/grafana-7.3.1-1.x86_64.rpm
[root@prometheus ~]# yum install -y grafana-7.3.1-1.x86_64.rpm
[root@prometheus ~]# systemctl enable grafana-server.service && systemctl start grafana-server.service
[root@prometheus ~]# ss -lnpt|grep 3000
LISTEN 0 128 [::]:3000 [::]😗 users:(("grafana-server",pid=897,fd=8))
浏览器访问 http://10.0.0.51:3000/login
默认账号密码 admin admin 首次登陆必须修改密码
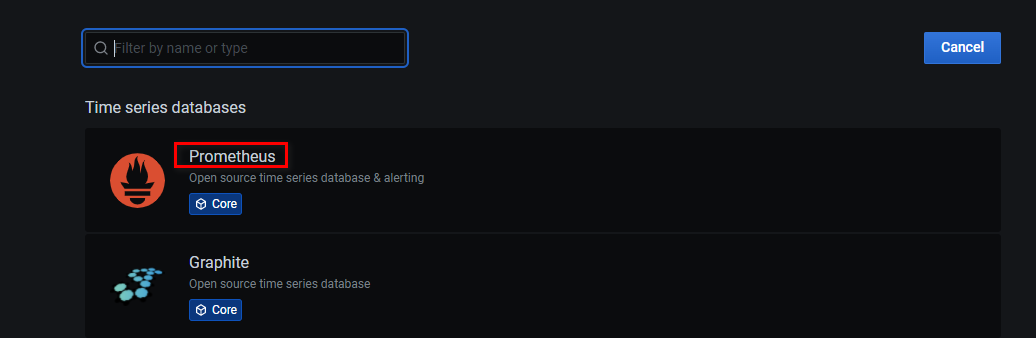
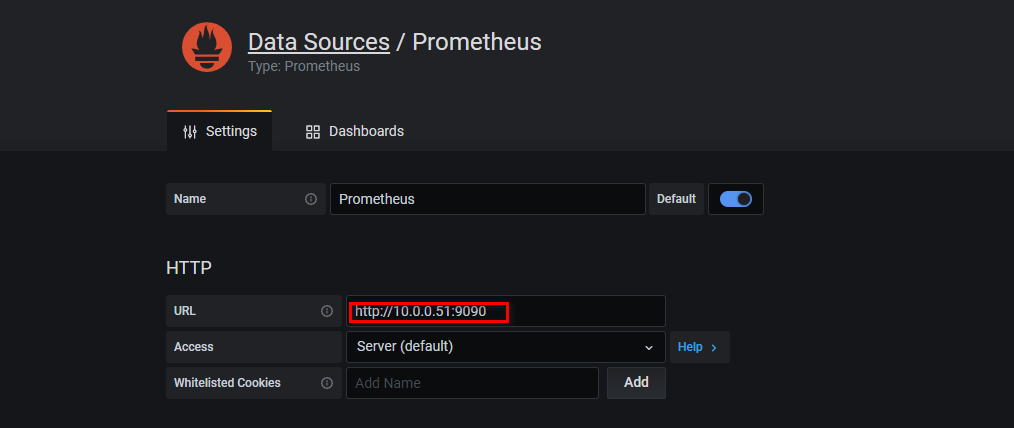
配置grafana数据源为prometheus
选择prometheus
填写Prometheus的HTTP地址 10.0.0.51:9090,save即可
二进制部署alertmanager
1)下载软件及部署
[root@prometheus ~]# wget https://github.com/prometheus/alertmanager/releases/download/v0.21.0/alertmanager-0.21.0.linux-amd64.tar.gz
[root@prometheus ~]# tar xf alertmanager-0.21.0.linux-amd64.tar.gz -C /usr/local/src/
[root@prometheus ~]# ln -s /usr/local/src/alertmanager-0.21.0.linux-amd64 /usr/local/alertmanager
cat >/usr/lib/systemd/system/alertmanager.service <<'EOF'
[Unit]
Description=alertmanager Server
After=network.target
[Service]
Restart=on-failure
ExecStart=/usr/local/alertmanager/alertmanager --config.file=/usr/local/alertmanager/alertmanager.yml
[Install]
WantedBy=multi-user.target
EOF
[root@prometheus ~]# systemctl enable alertmanager && systemctl start alertmanager
[root@prometheus ~]#  ss -tnlp |grep alertmanager
LISTEN     0      128       [::]:9093                  [::]:*                   users:(("alertmanager",pid=11501,fd=8))
LISTEN     0      128       [::]:9094                  [::]:*                   users:(("alertmanager",pid=11501,fd=3))
2)配置Prometheus与Alertmanager通信
[root@prometheus ~]# vim /usr/local/prometheus/prometheus.yml
#prometheus.yml
alerting:
  alertmanagers:
  - static_configs:
    - targets:
      - 127.0.0.1:9093
[root@prometheus ~]# systemctl restart prometheus
3)alertmanager配置telegram告警
1、打开bot的生成链接https://telegram.me/botfather,点击 /newbot - create a new bot 生成一个新的bot,系统会让你给它取一个名字,这里可以随便输入,反正方便记忆就可以了
2、系统会再次让你取一个名字并输入,现在的名字必须以bot结尾,不可以和其他任何bot重名,这一步的名字类似于身份证号码,而之前的名字类似于身份证上面的名字,身份证上的名字可以重复,但是身份证号码不允许重复
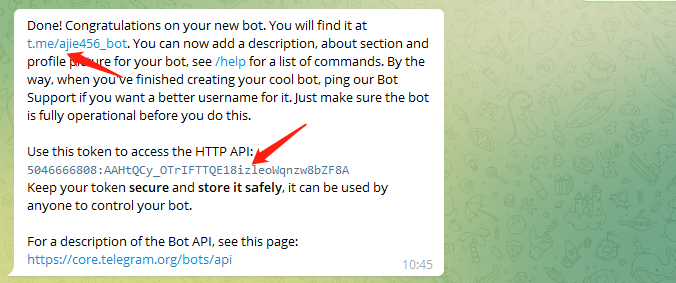
3、一旦你输入的bot名字可用,系统会生成一个token给你,类似于5084624990:AAFY96pzZlbI8i2JkZdf82maW6SG5JdQ12U,请务必保存好此token并且不泄露,这是唯一的用户凭证
4、此时,你拥有了一个bot,但是还无法使用,因为你知道它,它不知道你,这时候打开 https://t.me/iamthebot 这个链接,注意iamthebot为你刚才新建的bot的名字,点击/start进入对话框,发送 @userinfobot 后并点击它,userinfobot的对话中,点击或者输入/start,你将获取一个ID,具体表现为一串数字,比如 2128309024
5、新建一个群组,把bot机器人拉入到群组中,执行/start,机器人就会在群里发送报警信息
配置telegram-webhook
[root@prometheus ~]# mkdir /monitoring
[root@prometheus ~]# yum -y install docker
[root@prometheus ~]# systemctl enable docker && systemctl start docker && systemctl status docker
docker run -d \
  -e 'ALERTMANAGER_URL=http://127.0.0.1:9093' \
  -e 'BOLT_PATH=/data/bot.db' \
  -e 'STORE=bolt' \
  -e 'TELEGRAM_ADMIN=2128309024' \
  -e 'TELEGRAM_TOKEN=5056728887:AAG54RPz42bNy1gCRfgKIX6E4yPmfU3pCxw' \
  -v '/root/monitoring:/data' \
  --network host \
  --name alertmanager-bot \
  metalmatze/alertmanager-bot:0.4.3
  TELEGRAM_ADMIN:为telegram的用户id,通过@userinfobot执行/start获取
  TELEGRAM_TOKEN:是机器人的token
  [root@prometheus ~]# ss -lnpt|grep 8080
LISTEN     0      128       [::]:8080                  [::]:*                   users:(("alertmanager-bot",pid=1664,fd=5))
修改alertmanager配置文件
[root@prometheus ~]# vim /usr/local/alertmanager/alertmanager.yml
route:
  group_by: ['alertname']
  group_wait: 10s
  group_interval: 10s
  repeat_interval: 1h
  receiver: 'alertmanager-bot'
receivers:
- name: 'alertmanager-bot'
  webhook_configs:
  - send_resolved: true
    url: 'http://127.0.0.1:8080'
 [root@prometheus ~]# systemctl restart alertmanager
配置自定义告警模板
在宿主机的/templates目录下创建default.tmpl文件,挂载到容器中,容器使用宿主机的告警模板
[root@prometheus ~]# mkdir /templates
[root@prometheus ~]# vim /templates/default.tmpl
{{ define "telegram.default" }}
{{- if eq .Status "firing"}}
{{- range $i, $alert :=.Alerts }}
======DevOps告警======
告警状态:{{ if eq .Status "firing"}}🔥 <b>{{ .Status | toUpper }}</b> 🔥{{ else }}<b>{{ .Status | toUpper }}</b>{{ end }}
告警类型:{{ $alert.Labels.alertname }}
告警级别: {{ $alert.Labels.severity }}
故障主机: {{ $alert.Labels.instance }}
告警详情:{{ $alert.Annotations.description }}
告警时间:{{ ($alert.StartsAt.Add 28800e9).Format "2006-01-02 15:04:05" }}
==========end========
{{- end }}
{{- end }}
{{- if eq .Status "resolved"}}
{{- range $i, $alert :=.Alerts }}
======DevOps恢复通知======
恢复状态:{{ if eq .Status "firing"}}🔥 <b>{{ .Status | toUpper }}</b> 🔥{{ else }}<b>{{ .Status | toUpper }}</b>{{ end }}
恢复类型:{{ $alert.Labels.alertname }}
告警级别: {{ $alert.Labels.severity }}
恢复主机: {{ $alert.Labels.instance }}
恢复详情:{{ $alert.Annotations.description }}
恢复时间:{{ ($alert.StartsAt.Add 28800e9).Format "2006-01-02 15:04:05" }}
==========end========
{{- end }}
{{- end }}
{{- end }}
删除就容器并重启容器
[root@prometheus ~]# docker rm -f 219db9e6e5e4
219db9e6e5e4
[root@prometheus ~]# docker run -d \
  -e 'ALERTMANAGER_URL=http://127.0.0.1:9093' \
  -e 'BOLT_PATH=/data/bot.db' \
  -e 'STORE=bolt' \
  -e 'TELEGRAM_ADMIN=2128309024' \
  -e 'TELEGRAM_TOKEN=5046666808:AAHtQCy_OTrIFTTQE18izleoWqnzw8bZF8A' \
  -v '/templates:/templates' \
  -v '/root/monitoring:/data' \
  --network host \
  --name alertmanager-bot \
  metalmatze/alertmanager-bot:0.4.3
[root@prometheus ~]# docker ps
CONTAINER ID        IMAGE                               COMMAND                  CREATED             STATUS              PORTS               NAMES
070c2b4c6b8f        metalmatze/alertmanager-bot:0.4.3   "/usr/bin/alertman..."   2 seconds ago       Up 2 seconds                            alertmanager-bot
AlertManager-bot部署的另外一种方法
mkdir /usr/local/alertmanager-bot
wget https://github.com/metalmatze/alertmanager-bot/releases/download/0.4.3/alertmanager-bot-0.4.3-linux-amd64
ln -s /usr/local/alertmanager-bot/alertmanager-bot-0.4.3-linux-amd64  /usr/local/alertmanager-bot/alertmanager-bot
chmod +x alertmanager-bot-0.4.3-linux-amd64
touch /usr/local/alertmanager-bot/default.tmpl
创建systemd服务启动alertmanager-bot
vim /usr/lib/systemd/system/alertmanager-bot.service
[Unit]
Description=Alertmanager-bot Server
After=network.target
[Service]
Restart=on-failure
ExecStart=/usr/local/alertmanager-bot/alertmanager-bot --alertmanager.url=http://localhost:9093/ --bolt.path="/tmp/bot.db" --telegram.admin=179760 --telegram.token=5068922393:AAExoTzpvwefwef23f234r32SN4CM --template.paths=/usr/local/alertmanager-bot/default.tmpl --store=bolt
[Install]
WantedBy=multi-user.target
systemctl start alertmanager-bot
systemctl enable alertmanager-bot
告警信息模板修改
vim /usr/local/alertmanager-bot/default.tmpl

 浙公网安备 33010602011771号