
load 'gnuplot.txt'
load 'gnuplot.txt'
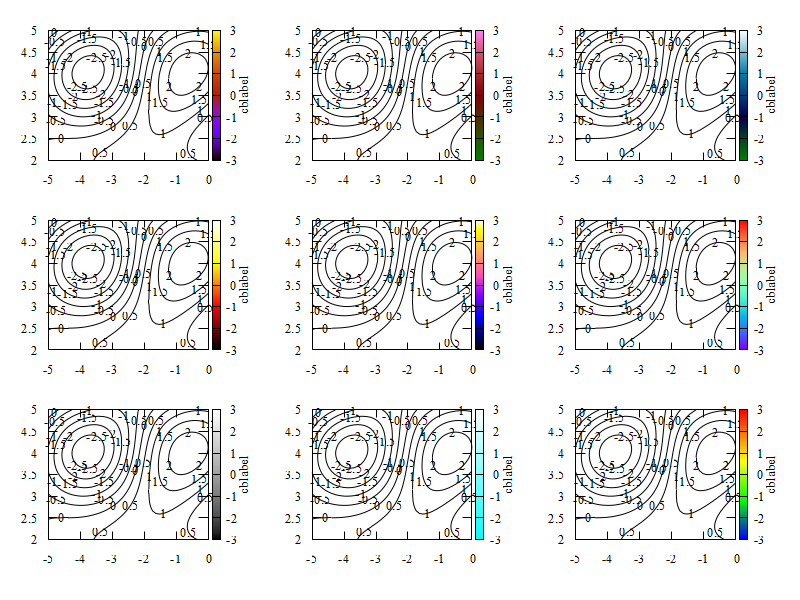
### 使用table存储数据到文件
set isosamples 100
f(x,y)=sin(1.3*x)*cos(.9*y)+cos(.8*x)*sin(1.9*y)+cos(y*.2*x)
set xrange [-5:0]
set yrange [2:5]
set table 'test.dat'
splot f(x,y)
unset table
reset
### 设置color map
P1="set palette rgb 7,5,15"
P2="set palette rgb 3,11,6"
P3="set palette rgb 23,28,3"
P4="set palette rgb 21,22,23"
P5="set palette rgb 30,31,32"
P6="set palette rgb 33,13,10"
P7="set pal gray"
P8="set palette rgb 3,2,2" #"set palette rgb 34,35,36"
P9="set palette defined ( 0 'blue', 3 'green', 6 'yellow', 10 'red' )" #
cmaps = "P1 P2 P3 P4 P5 P6 P7 P8 P9"
#set terminal epscairo size 17cm,15cm font 'Times New Roman,15'
#set output 'contour.eps'
set terminal pngcairo size 800,600 font 'Times New Roman,10'
set output 'contour.png'
### 设置子图公共的属性
set isosamples 50
set samples 50
### 设置等高线为黑色
set for [i=1:10] linetype i linecolor 0 #change line colors to the same one
unset surface
set view map
set contour base
set cntrparam levels auto 10
set cntrlabel font ",10"
set xrange [-5:0]
set yrange [2:5]
unset key
set cblabel 'cblabel' ##colorbar的label
set label 1 '' at 0,0 ###后边有一个unset label 1,此处只是为了不让后边的找不到
###开始多图的循环绘制
set multiplot layout 3,3 margins 0.06,0.92,0.1,0.95 spacing 0.13,0.1
do for [i=1:9]{
eval sprintf('@%s',word(cmaps,i) ) ### eval 是执行语句的命令
print i,sprintf('@%s',word(cmaps,i) )
unset label 1
set label 1 "[".i."]" at -4.8,2.2 front textcolor rgb 'white'
splot 'test.dat' w image,\
f(x,y) with lines lc rgb 'black',\
f(x,y) with labels notitle
}
unset multiplot
set output

 浙公网安备 33010602011771号