

作者:张富春(ahfuzhang),转载时请注明作者和引用链接,谢谢!

在这篇文章:「VictoriaMetrics 部署历史群集的另外两种方式」中,通过在 CRD 对象 VMAgent 中增加 aggregation 表达式来实现不同的采集频率。
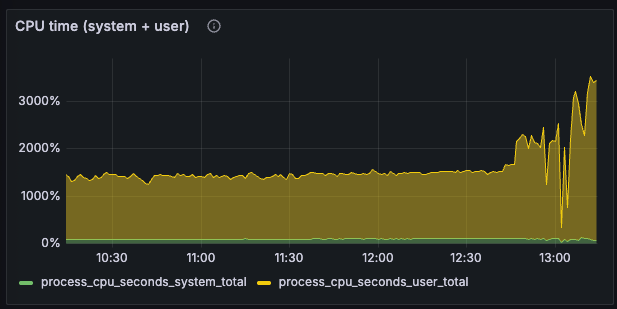
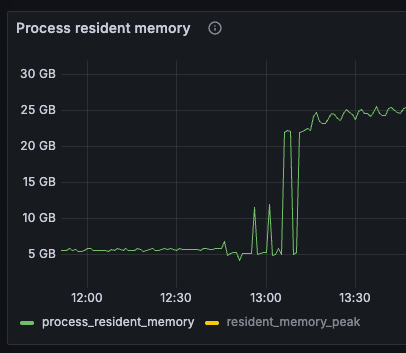
今天实际上线时发现,资源的增长并不乐观:
- cpu: 14.11 cores => 34.35 cores, 增加2.43 倍
- 内存: 5.91GB => 22.6 GB, 增加3.82 倍
预计高峰期会涨更高。
由此看来: 不应该为了省事,使用复杂的计算去完成一件简单的事情
如果是完全独立的两套 vmagent 群集,资源消耗肯定不会上涨那么快。
另一方面说明:vmagent 的 aggregation 部分的代码没有很好的优化。
通过:
curl "http://127.0.0.1:8429/debug/pprof/profile?seconds=120" -o cpu.profile
go tool pprof -http=:8080 cpu.profile
分析了 vmagent 的 profile:

开启了 vmagent 的 aggregation 后,整体 30% 的 cpu 时间都用于 aggregation 计算了。
宜慎用vmagent的aggregation功能

 浙公网安备 33010602011771号