

PHPStudy使用xdebug调试断点
环境
phpstudy + php7.3.4nts + Xdebug,注意使用的php为从phpstudy中下载。
xdebug下载配置
phpstudy启用xdebug
phpstudy-》软件管理-》php7.3.4nts-》设置

扩展组件-》XDebug调试组件,启用并设置监听端口

Xdebug下载
https://xdebug.org/download ,进入官网,找到Historical Releases,去历史版本里下载PHP 7.3 VC15 (64 bit)版本,下载后文件名为php_xdebug-3.1.4-7.3-vc15-nts-x86_64.dll

php.ini配置Xdebug
修改D:\phpstudy_pro\Extensions\php\php7.3.4nts下面的php.ini
[XDebug]
;选用vscode
xdebug.indekey=Vscode
zend_extension="D:/phpstudy_pro/Extensions/php/php7.3.4nts/lib/php_xdebug-3.1.4-7.3-vc15-nts-x86_64.dll"
xdebug.mode = "debug,develop,trace"
xdebug.client_host=127.0.0.1
xdebug.client_port=9005
xdebug.idekey="PHPSTORM"
xdebug.collect_return=On   ;收集返回值
xdebug.log="D:/phpstudy_pro/Extensions/tmp/php7.3.4nts/xdebug.log"
xdebug.discover_client_host = true   ;这个很重要,必须有,不然断点debug不出来,原理不做深究
xdebug.collect_params=1
xdebug.remote_handler=dbgp
xdebug.start_with_request=yes
如果是php为7.4.3,xdebug为2.9.4
[XDebug]
zend_extension=D:/phpstudy_pro/Extensions/php/php7.4.3nts/ext/php_xdebug.dll

; 开启远程调试
xdebug.remote_enable=1
xdebug.remote_autostart=1

; VSCode 的监听端口(与 launch.json 对应)
xdebug.remote_host=127.0.0.1
xdebug.remote_port=9005
xdebug.remote_handler=dbgp

; 可选,但强烈推荐
xdebug.idekey=VSCODE

; 调试辅助
xdebug.collect_params=1
xdebug.collect_return=1

; 日志
xdebug.remote_log=D:/phpstudy_pro/Extensions/tmp/php7.4.3nts/xdebug.log
网站设置
启动xdebug拓展
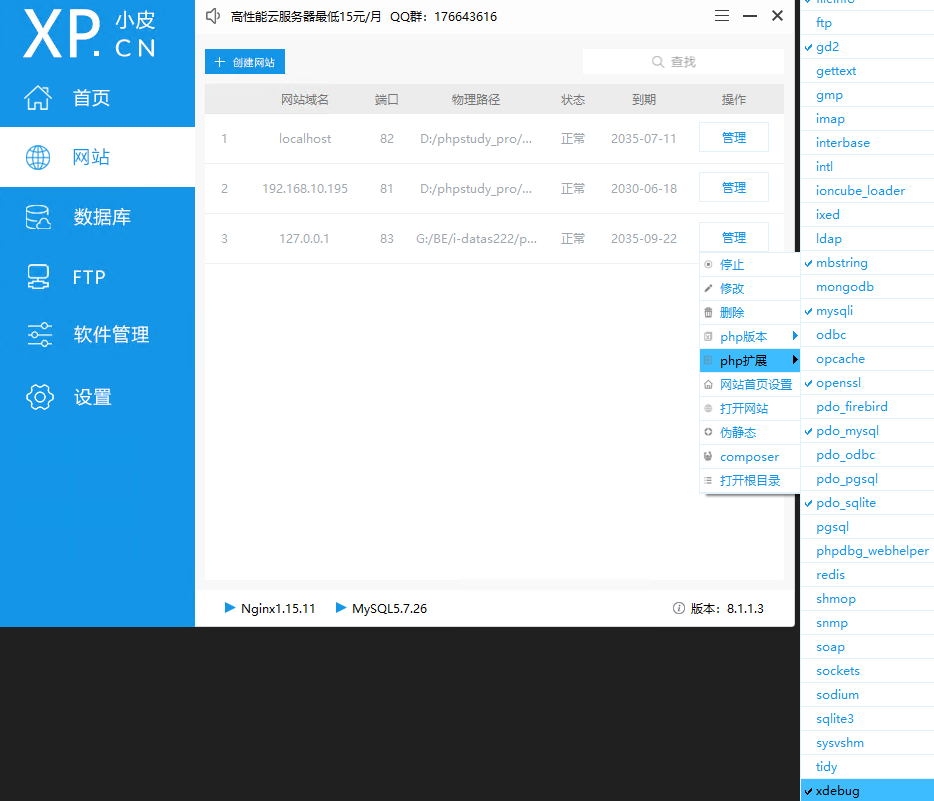
查看phpinfo
网站的public下面新建phpinfo.php
<?php
phpinfo();
确保conf文件能解析所有php
    # 匹配所有 PHP 文件
    location ~ \.php$ {
        fastcgi_pass   127.0.0.1:9000;
        fastcgi_index  index.php;
        fastcgi_split_path_info  ^((?U).+\.php)(/?.+)$;
        fastcgi_param  SCRIPT_FILENAME  $document_root$fastcgi_script_name;
        fastcgi_param  PATH_INFO        $fastcgi_path_info;
        fastcgi_param  PATH_TRANSLATED  $document_root$fastcgi_path_info;
        include        fastcgi_params;
    }
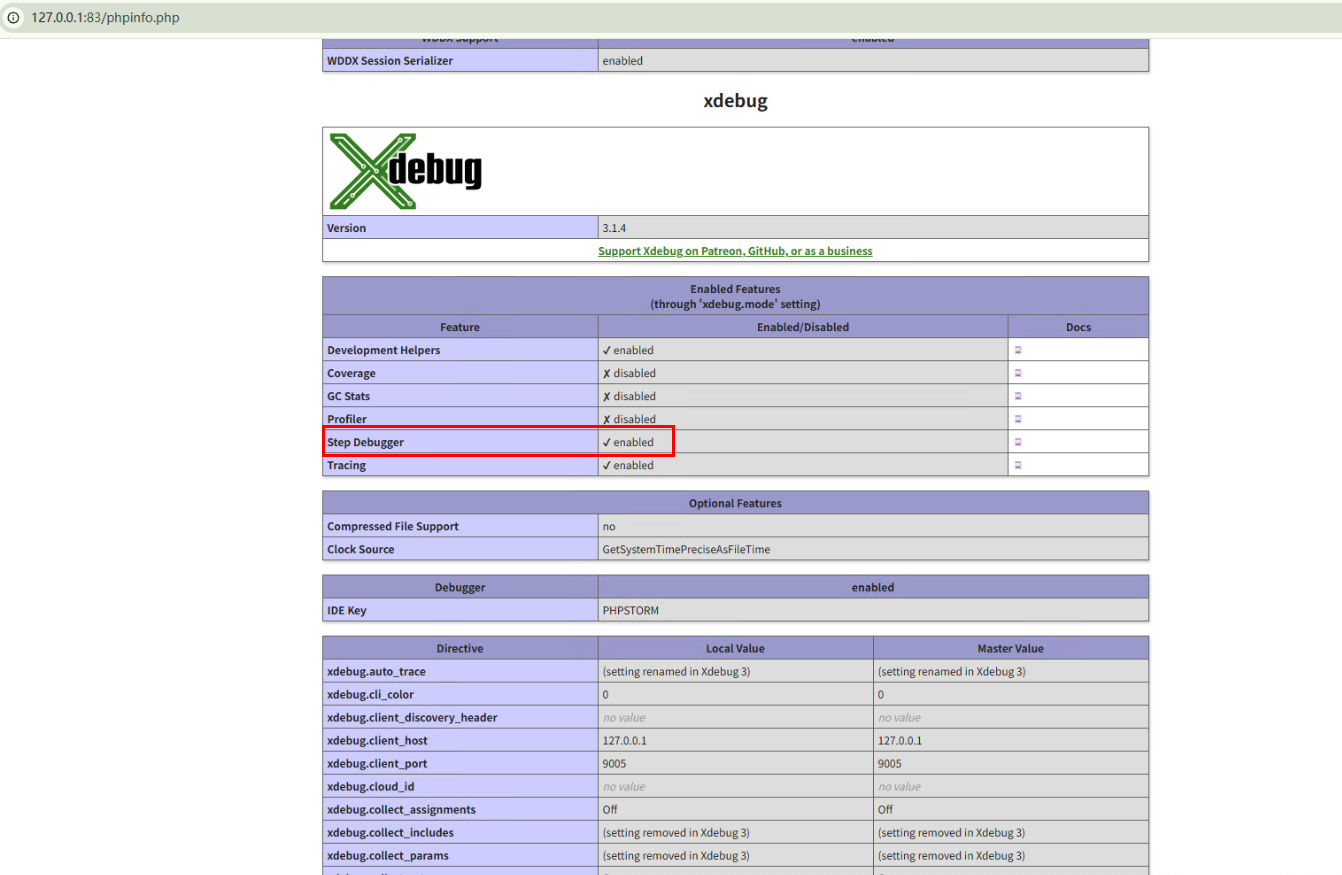
访问http://127.0.0.1:83/phpinfo.php ,查看Step Debugger为enabled,即调试功能被启用了
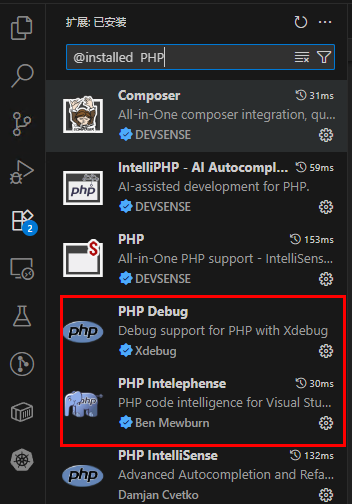
Visual Studio Code
安装 PHP Debug,PHP IntelliSense 插件
开启Visual Studio Code断点调试功能
文件-》首选项-》设置-》拓展-》PHP-》在setting.json中编辑
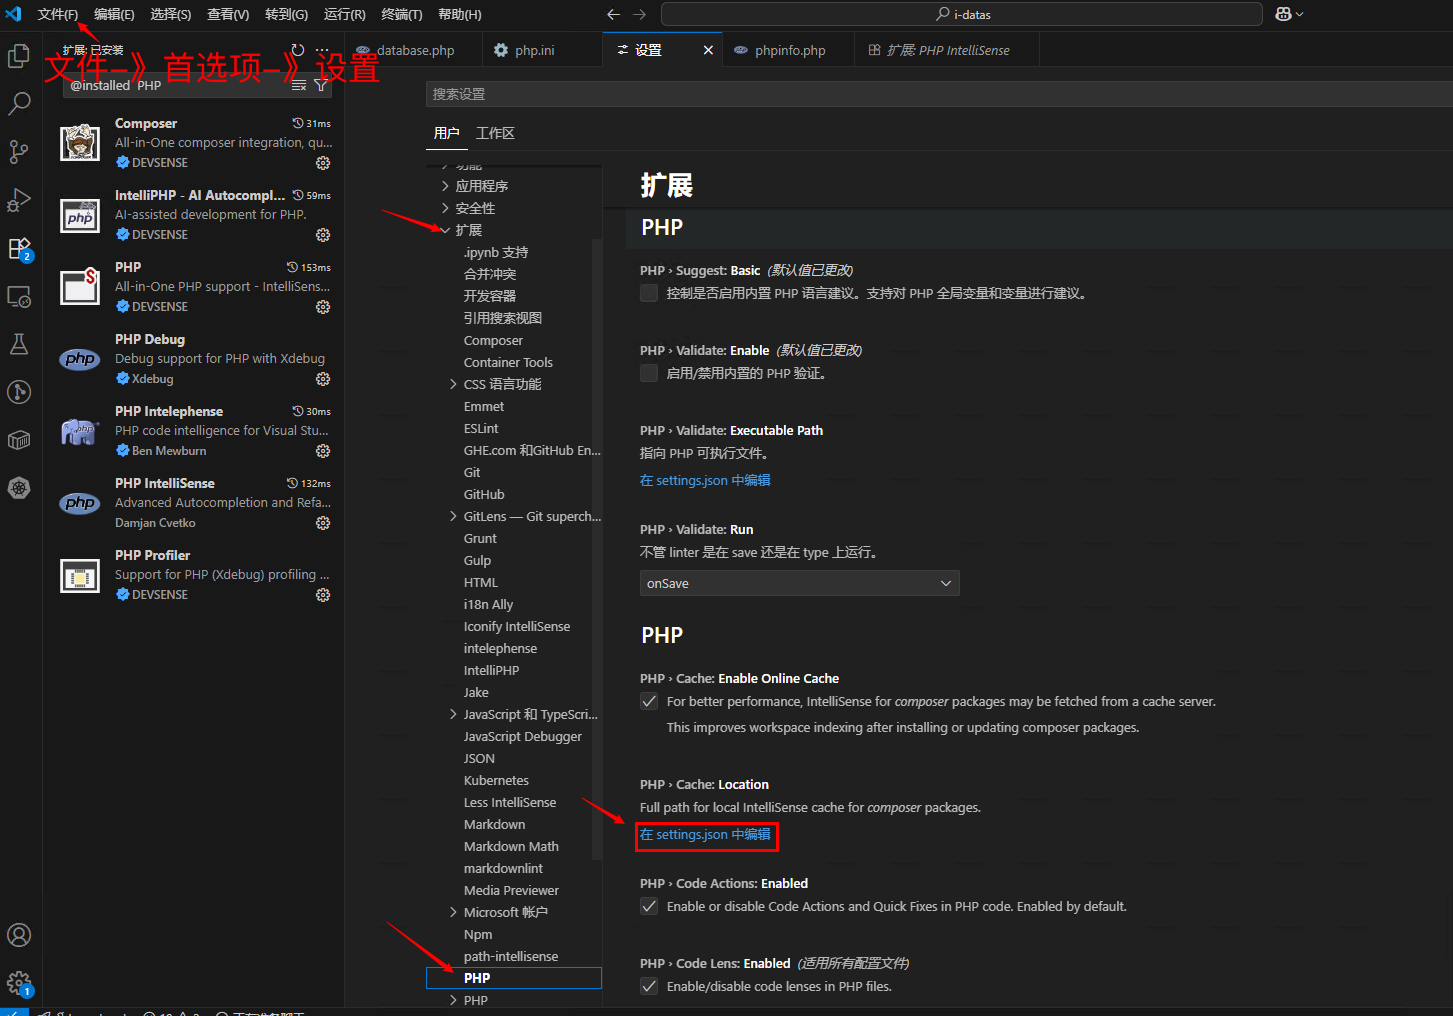
setting.json添加如下内容
"php.validate.executablePath": "D:/phpstudy_pro/Extensions/php/php7.3.4nts/php.exe",

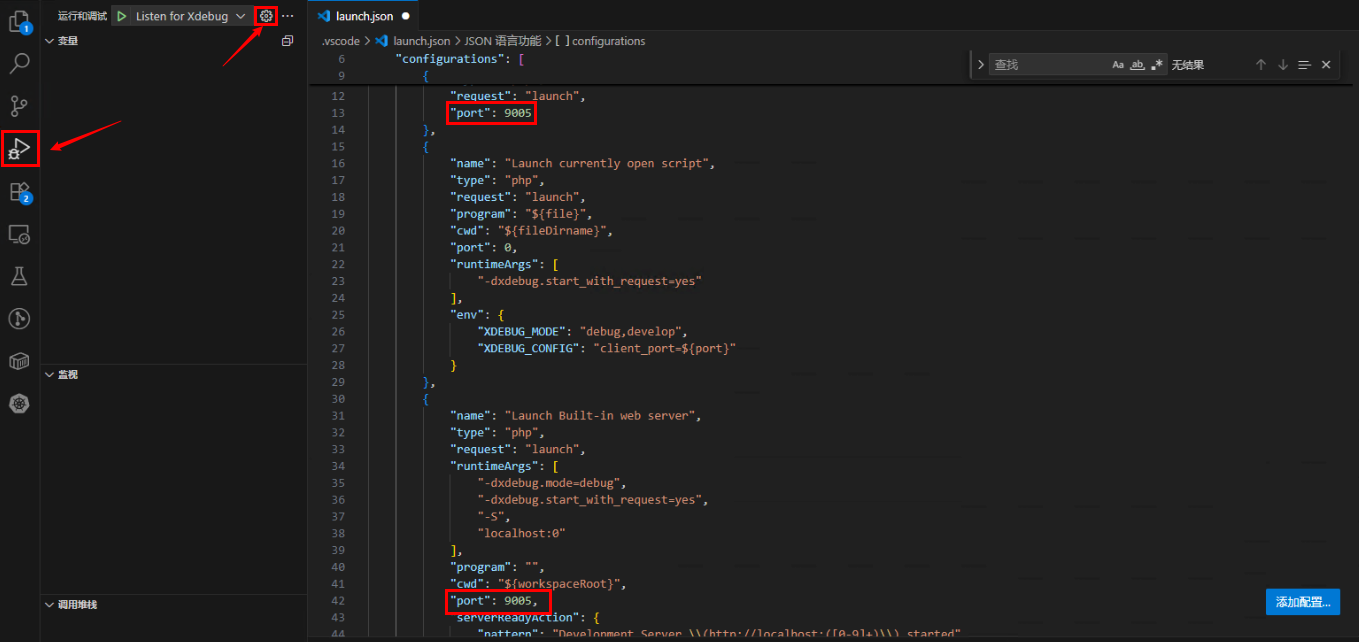
lauch.json
创建调试,选择php,lauch.json文件中的端口改为9005
{
    // 使用 IntelliSense 了解相关属性。
    // 悬停以查看现有属性的描述。
    // 欲了解更多信息,请访问: https://go.microsoft.com/fwlink/?linkid=830387
    "version": "0.2.0",
    "configurations": [


        {
            "name": "Listen for Xdebug",
            "type": "php",
            "request": "launch",
            "port": 9005
        },
        {
            "name": "Launch currently open script",
            "type": "php",
            "request": "launch",
            "program": "${file}",
            "cwd": "${fileDirname}",
            "port": 0,
            "runtimeArgs": [
                "-dxdebug.start_with_request=yes"
            ],
            "env": {
                "XDEBUG_MODE": "debug,develop",
                "XDEBUG_CONFIG": "client_port=${port}"
            }
        },
        {
            "name": "Launch Built-in web server",
            "type": "php",
            "request": "launch",
            "runtimeArgs": [
                "-dxdebug.mode=debug",
                "-dxdebug.start_with_request=yes",
                "-S",
                "localhost:0"
            ],
            "program": "",
            "cwd": "${workspaceRoot}",
            "port": 9005,
            "serverReadyAction": {
                "pattern": "Development Server \\(http://localhost:([0-9]+)\\) started",
                "uriFormat": "http://localhost:%s",
                "action": "openExternally"
            }
        },
        {
            "name": "Launch built-in server and Debug",
            "type": "php",
            "request": "launch",
            "noDebug": false,
            "runtimeArgs": [
                "-S",
                "localhost:8000",
                "-t",
                "."
            ],
            "cwd": "${workspaceRoot}/public",
            "serverReadyAction": {
                "action": "openExternally"
            }
        },
        {
            "name": "Launch built-in server and Profile",
            "type": "php",
            "request": "launch",
            "noDebug": true,
            "runtimeArgs": [
                "-S",
                "localhost:8000",
                "-t",
                "."
            ],
            "cwd": "${workspaceRoot}/public",
            "serverReadyAction": {
                "action": "openExternally"
            },
            "profile": true,
            "openProfile": true
        },
        {
            "name": "Listen for Xdebug",
            "type": "php",
            "request": "launch"
        }
    ]
}
调试
按F5打开调试
鼠标左键点机代码左侧添加断点
按F11单步执行
查看控制台输出情况

如果这篇文章对你有用,可以关注本人微信公众号获取更多ヽ(^ω^)ノ ~


 浙公网安备 33010602011771号