
SciTech-AV-Audio-DAP(Digital Audio Processing)-Effect(音效)-EQ(Equalization均衡) and Filters(滤波)-GraphicEQ + FCEQ(Filter Curve Equalization):滤波曲线均衡
SciTech-AV-Audio-DAP(Digital Audio Processing)
Effect(音效)-EQ(Equalization均衡) and Filters(滤波)-FCEQ(Filter Curve Equalization):滤波曲线均衡
Abbreviations
- FFT (Fast Fourier Transform)
- EQ(EQualization)
- Graphic EQ(Graphic EQualizer)
- FCEQ(Filter Curve EQualization)
Glossary
This page gives very brief explanations of technical terms related to digital audio,
with some links to Wikipedia for much more comprehensive explanations.
General Terms: https://manual.audacityteam.org/man/glossary.html
| Term | Description |
|---|---|
| Pitch | Generally synonymous with the fundamental frequency of a note, but in music, often also taken to imply a perceived measurement that can be affected by overtones above the fundamental. |
| Frequency | Audio frequency determines the pitch of a sound. Measured in Hz, higher frequencies have higher pitch. See this Wikipedia article. |
| Waveform | A visual representation of an audio signal. |
| Amplitude | The level or magnitude of a signal. Audio signals with a higher amplitude will sound louder. |
| Spectrum | Presentation of a sound in terms of its component frequencies. |
| Fourier Transform |
A method for converting a waveform to a spectrum, and back. |
| Sample | A discrete value at a point in a waveform representing the audio at that point. Also the act of taking a sequence of such values. All digital audio must be sampled at discrete points. By contrast, analog audio(such as the sound from a loudspeaker) is always a continuous signal. |
| Sample Rate |
this represents the number of digital samples captured per second in order to represent the waveform. Measured in Hz like frequency. See Sample Rates for more details. |
| Sample Format |
Also known as Bit Depth or Word Size. The number of computer bits present in each audio sample. Determines the dynamic range of the audio. See Sample Format - Bit Depth for more details. |
| ADC | Analog to Digital Converter. The part of an audio interface which records an analog, real world sound like a voice or guitar and converts it to a numerical representation of the audio that a computer can manipulate. |
| PCM | Pulse Code Modulation. A method of converting audio into binary numbers to represent it digitally, then back to audio. The waveform is measured at evenly spaced intervals and the amplitude of the waveform noted for each measurement. |
|
FCEQ(Filter Curve Equalization):滤波曲线均衡
Equalization
is a way of manipulating sounds by Frequency.
It allows you to increase/decrease the volume of some frequencies and reduce/gain others.
This is a more advanced form of the EQ and Tone controls on many audio systems.
Equalization is available in two modes:
- a "Slider" mode: accessed via Effect > Graphic EQ
- a "Draw curves" mode: accessed via Effect > Filter Curve EQ
Limitations of EQ
- To process Equalization, all tracks in the project must have the same sample rate.
To change the sample rate of a track without affecting speed or pitch, use Tracks > Resample.- Filter Curve EQ of Audacity supports a maximum of 200 control points.
-
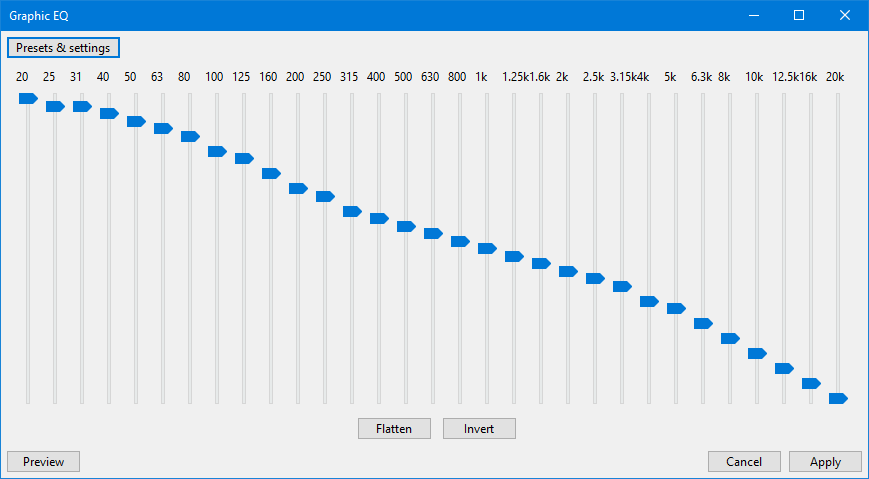
EQ. in "Slider" mode
- An example:
the curve defined by the slider settings shown below changes the balance of high and low frequencies in the audio, boosting the low frequencies.
The default setting is flat with all the sliders set at 0 dB.
- Frequency Sliders:
- the equalization curve is drawn by manipulating a set of sliders.
- Each slider adjusts the gain of a specific range of frequencies,
- the gain being maximized at (centered on) the frequency stated on the slider.
- Click and drag the slider up or down to increase or decrease the volume by a maximum of 20 dB. You can Tab between each slider.
- The current value of the slider can be seen by hovering over it with the mouse.
- Equalization settings:
- Flatten: A quick way to set a "level response curve".
This means the curve on the graph is drawn from left to right at 0 dB on the vertical scale,
so that no frequencies will have their volume level modified.- Invert: Turns the current curve in the window upside down, changing positive gains at a particular frequency into negative, and vice versa.
- Clipping : Distortion to sound
- usually due to the audio being too loud.
- Unless the original audio is 32-bit sample format, waveforms louder than 0dB will have their tops lopped off (flattened) at 0 dB, rather than showing smooth curves.
- Clipping can also be an intentional distortion effect that lops off part of the waveform, reducing its amplitude and changing its frequency content.
- Advice:
- No account is taken of whether your slider settings will result in the selection being amplified beyond the clipping (distortion) level.
- If your slider settings amplifies any frequencies, especially the lower frequencies which are normally the loudest, Effect > Normalize the track(s) first to -3 dB or lower.
- you can always Edit > Undo the Graphic EQ, Normalize again to a lower level, then re-apply Graphic EQ, If necessary.
- Import/Export Settings of Graphic EQ:
- now facilitates the import of pre-existing equalization curves, using the Manage button, for use in the effect.
- Many published curves, such as those on the Muse website, and curves you may have exported in earlier versions of Audacity with the old Equalization effect, are in .XML format.
- Graphic EQ, like all other Audacity effects, expects the imports to be text files in .TXT format. To facilitate this,
we have provided a tool EQ XML to TXT Converter, this is not enabled by default but you can enable it with the Plugin Manager after which it will be present in the Tools Menu.
-
EQ. in "Draw curves" mode
- An example:
the curve shown below changes the balance of high and low frequencies in the audio to make it sound like an AM radio broadcast.
High frequencies (above 6000 Hz) and low frequencies (below 100 Hz), are reduced in volume by 20 dB.
- Advice:
- Note carefully that when you apply an effect to a time-stretched clip:
the changed speed of the clip will be automatically rendered.- If you apply an effect to a selection within a time-stretched clip then
Audacity will split the original clip so that the selection can be rendered as part of applying the effect.
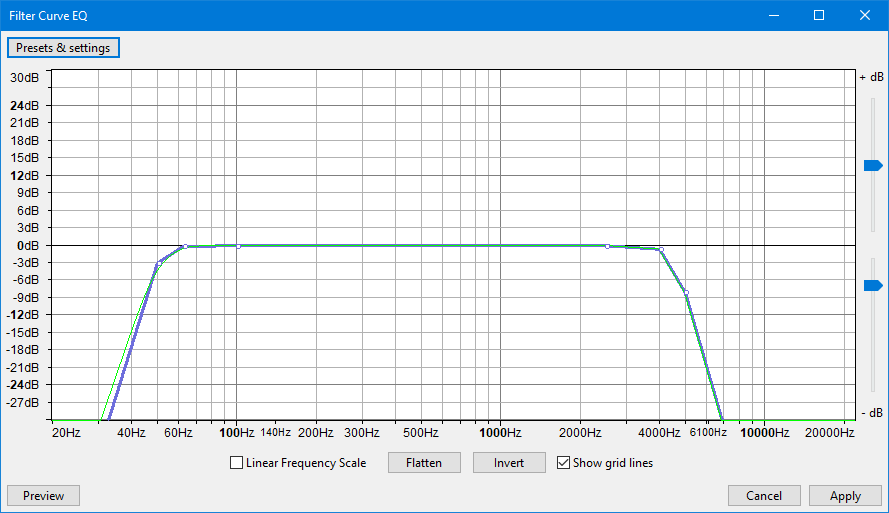
Filter Curve EQ
is an equalization tool, it is an FFT (Fast Fourier Transform) filter.
Draw EQ Filter Curves
Equalization Curves and Control Points: If you look closely at the curve in the image above, you will see it is composed of:
- a blue curve
joining togethera number of white circles, - a green curve which
followsthe general shape of the blue curve. - the white circles
are called"control points". - the blue curve
is drawnby either clicking in the graph at any position, or clicking on the blue curve and dragging it to a position. doing eithercreatesa control point at that position, then creating further control points draws the curve. to remove a control point, drag it outside the graph. - the green curve is the one that Audacity actually uses to perform the effect, taking into account the limitations of the equalization algorithm. The green curve
usually followsthe blue curveclosely, butwill be forced toa smoother pathif there aresudden changes in amplitudeovera small frequency range.
Linear Frequency Scale
- logarithmic(horizontal frequency scale) :
giving more detail at the lower frequencies.
Thiscorresponds roughly toour greater sensitivity to lower frequencies. - linear(horizontal frequency scale):
displayingequal frequency ranges for each unit of the scale.
Thiscan be usefulfor precision adjustments at high frequencies.
Example:
You want to make an audio selection
sound "brighter"by:
- reducing the frequencies below 100Hz by 10dB,
- increasing those frequencies over 5000 Hz by 10 dB.
Steps:
- If the line in the graph is not already horizontal at the 0 dB position, click "Flat"(see below).
- Click at the point that is opposite
both-10dB on the vertical scaleand100Hz on the horizontal scale.- Click at the point that is opposite
both+10dB on the vertical scaleand5000Hz on the horizontal scale.Createextra control points if desiredbetween100Hzand5000Hzto modifywhether particular frequencies between those two levelsshould bereduced or increased in volume.
Graph Scale and Sliders
Dragging the Equalization window wider displays some additional points on the scale and makes it easier to plot the graph accurately.
- Vertical Scale: This scale is in dB and
showsthe amount of gain(amplification above 0dB or attenuation below 0 dB) thatwill be applied tothe audio at any given frequency. - Horizontal Scale:
This showsthe frequencies in Hzto whichvolume adjustments will be applied. - Vertical scale sliders: By default the vertical scale reads from + 30 dB to - 30 dB,
but these two sliders to left of the scale, let you adjust the upper and lower dB valuesso as tochange the visible range on the graph. Note that:movingeither sliderchangesthe horizontal position of the 0 dB line.Reducing the visible rangelets you make a finer adjustment to how loud the frequencies sound, but the changes will be more subtle because the volume adjustmentwill be less.

 浙公网安备 33010602011771号