SciTech-Mathmatics-Probability+Statistics-Population-Sampling of Region of Population : Proportion + Mean + Confidence Interval
SciTech-Mathmatics-Probability+Statistics-Population-Sample: Sample Proportion vs. Sample Mean: The Difference
Sample Proportion vs. Sample Mean: The Difference
BY ZACH BOBBITTPOSTED ON MAY 5, 2021
Two terms that are often used in statistics are Sample Proportion and Sample Mean.
Here's the difference between the two terms:
-
Sample Proportion: The proportion of observations in a sample with a certain characteristic.
Often denoted $\large p̂ $, It is calculated as follows:
\(\large \begin{array}{lrl} \\ & p̂= & \frac{x}{n} \\ where: & & \\ & x: & \text{ The } number \text{ of } observations \text{ in the } sample, \\ & & \text{ with } a\ certain\ characteristic. \\ & n: & \text{ The } total\ number \text{ of } observations \text{ in the } sample \\ \end{array}\) -
Sample mean : The average value in a sample.
Often denoted $\large x $, it is calculated as follows:
\(\large \begin{array}{lrl} \\ & x= & \frac{\sum{x_i} }{n} \\ where: & & \\ & \sum: & \text{ A symbol that means } sum \\ & x_i: & \text{ The value of the } i \text{th observation in the sample } \\ & n: & \text{ The sample size } \\ \end{array}\)
When to Use Each(Proportion Vs. Mean)
The sample proportion and sample mean are used for different reasons:
-
Sample proportion : Used to understand the proportion of observations in a sample that have a certain characteristic.
For example, we could use the sample proportion in each of the following scenarios:- Politics : Researchers might survey 500 individuals in a certain city to understand what proportion of residents support a certain candidate in an upcoming election.
- Biology : Biologists may collect data on 100 sea turtles,
to understand what proportion of them have experienced damage from pollution. - Sports : A journalist may survey 1,000 college basketball players,
to understand what proportion of them shoot left-handed.
-
Sample mean : Used to understand the average value in a sample.
For example, we could use the sample mean in each of the following scenarios:- Demographics : Economists may collect data on 5,000 households in a certain city to estimate the average annual household income.
- Botany : A botanist may take measurements on 50 plants from the same species to estimate the average height of the plant in inches.
- Nutrition : A nutritionist may survey 100 people at a hospital to estimate the average number of calories that residents eat per day.
Depending on the question of interest, it might make more sense to use the sample proportion or the sample mean to answer the question.
Use Sample's Statistics to Estimate Population Parameters
Both the sample proportion and the sample mean are used to estimate population parameters.
Sample Proportion as an Estimate
We use the sample proportion to estimate a population proportion.
For example, we might be interested in understanding,
what proportion of residents in a certain city support a new law.
- Since it would be too costly and time-consuming to survey all 40,000,000 residents in the city, we instead survey 500 and calculate the proportion of residents in the sample who support the new law.
- We then use this sample proportion as our best estimate of the proportion of residents in the entire city who suppose the new law.
- However, since $\large \bm{ it's \ unlikely } $ that our sample proportion \(\large \bm{ exactly\ matches }\) the population proportion, we often use a \(\large \bm{ confidence\ interval }\) for a proportion – a range of values that we believe $\large \bm{ contains } $ the true population proportion with a certain level of confidence.
Sample Mean as an Estimate
We use the sample mean to estimate a population mean.
For example, we might be interested in understanding,
the average height of a certain species of plants.
- Since it would be too costly and time-consuming to measure the height of all 10,000 plants in a certain region, we instead measure the height of 150 plants and use the sample mean as our best estimate of the population mean.
- However, since $\large \bm{ it's \ unlikely } $ that our sample mean \(\large \bm{ exactly\ matches }\) the population mean, we often use a \(\large \bm{ confidence\ interval }\) for a mean– a range of values that we believe $\large \bm{ contains } $ the true population mean with a certain level of confidence.
Confidence Interval for a Proportion
A confidence interval for a proportion is a range of values that is likely to **contain a population proportion with a certain level of confidence.
This tutorial explains the following:
- The motivation for creating a confidence interval for a proportion.
- The formula to create a confidence interval for a proportion.
- An example of how to calculate a confidence interval for a proportion.
- How to interpret a confidence interval for a proportion.
Confidence Interval for a Proportion: Motivation
The reason to create a confidence interval for a proportion is to capture our uncertainty when estimating a population proportion.
For example, suppose we want to estimate the proportion of people in a certain county that are in favor of a certain law.
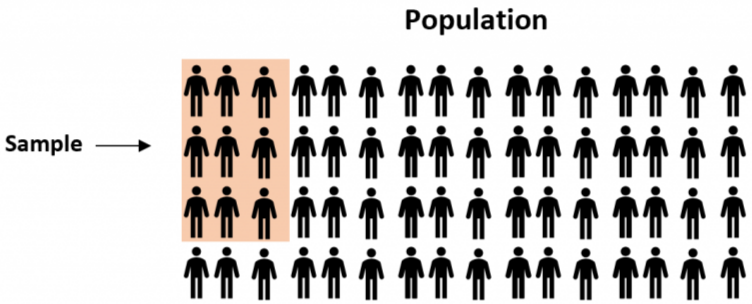
- Since there are thousands of residents in the county, it would be too costly and time-consuming to go around and ask each resident about their stance on the law. Instead, we might select a simple random sample of residents and ask each one whether or not they support the law:
![]()
Population proportion estimation example
Since we select a random sample of residents, $\large \bm{ there\ is\ no\ guarantee } $ that the proportion of residents in the sample who are in favor of the law $\large \bm{ will\ exactly\ match } $ the proportion of residents in the entire county who are in favor of the law.
So,$\large \bm{ to\ capture\ this\ uncertainty } $ we can $\large \bm{ create\ a\ confidence\ interval } $ that contains a range of values that $\large \bm{ are\ likely\ to } $ contain the true proportion of residents who are in favor of the law in the entire county.
Confidence Interval for a Proportion: Formula
We use the following formula to calculate a confidence interval for a population proportion:
$\large \bm{ Confidence\ Interval }= p +/- z* \sqrt{ \frac{p(1-p)}{n} } $
where:
\(\large p\): sample proportion
\(\large z\): the chosen z-value
\(\large n\): sample size
The z-value that you will use is dependent on the confidence level that you choose.
The following table shows the z-value that corresponds to popular confidence level choices:
| Confidence Level | z-value |
|---|---|
| 0.90 | 1.645 |
| 0.95 | 1.96 |
| 0.99 | 2.58 |
Notice that higher confidence levels correspond to larger z-values,
which leads to wider confidence intervals.
This means that, for example, a 95% confidence interval will be wider than a 90% confidence interval for the same set of data.
Related: What is Considered a Good Confidence Interval?
Confidence Interval for a Proportion: Example
Suppose we want to estimate the proportion of residents in a county that are in favor of a certain law. We select a random sample of 100 residents and ask them about their stance on the law. Here are the results:
$\large \text{ Sample size } n $ = 100
$\large \text{ Proportion in favor of law } p $ = 0.56
Here is how to find various confidence intervals for the population proportion:
Then $\large \sqrt{ \frac{0.56(1-0.56)}{100} } = 0.0496 $
| Confidence Level | z-value | Confidence Interval |
|---|---|---|
| 0.90 | 1.645 | $ [0.478, 0.642] \leftarrow 0.56 +/- 1.645*( \sqrt{ \frac{0.56(1-0.56)}{100} } ) $ |
| 0.95 | 1.96 | $ [0.463, 0.657] \leftarrow 0.56 +/- 1.96 *( \sqrt{ \frac{0.56(1-0.56)}{100} } ) $ |
| 0.99 | 2.58 | $ [0.432, 0.688] \leftarrow 0.56 +/- 2.58 *( \sqrt{ \frac{0.56(1-0.56)}{100} } ) $ |
Note: You can also find these confidence intervals by using the Confidence Interval for Proportion Calculator.
Confidence Interval for a Proportion: Interpretation
The way we would interpret a confidence interval is as follows:
There is a 95% chance that the confidence interval of [0.463, 0.657] contains the true population proportion of residents who are in favor of this certain law.
Another way of saying the same thing is that there is only a 5% chance that the true population proportion lies outside of the 95% confidence interval.
That is, there's only a 5% chance that the true proportion of residents in the county that support the law is less than 46.3% or greater than 65.7%.
Additional Resources
Confidence Interval for Proportion Calculator
Confidence Interval for Mean Calculator

 浙公网安备 33010602011771号