<template>
<div id="energyEcharts" style="width: 100%; height: 100%;"></div>
</template>
<script>
export default {
data() {
return {
}
},
mounted() {
this.myecharts();
this.WidthAdaptive();
},
watch: {
},
methods: {
WidthAdaptive(res) {
var windth = window.innerWidth;
let fontSize = windth / 5280;
return fontSize * res;
},
myecharts() {
let myChart = this.$echarts.init(document.getElementById('energyEcharts'));
// x轴数据
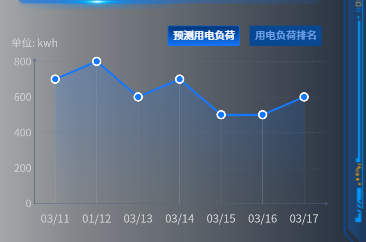
let xData = ['03/11','01/12','03/13','03/14','03/15','03/16','03/17'];
// y轴数据
let yData = [700,800,600,700,500,500,600];
//绘制图表
var option = {
tooltip: {
show: true,
trigger: 'axis',
axisPointer: {
type: 'line',
lineStyle: {
type: 'solid',
color: 'rgba(255, 255, 255, 0.4)',
},
},
formatter: '{b}<br/> {c} kwy',
backgroundColor: 'rgba(6,19,40,0.8)',
borderColor: 'transparent',
padding: [10],
textStyle: {
fontSize: this.WidthAdaptive(30),
fontFamily: 'PingFang SC',
fontWeight: 400,
lineHeight: this.WidthAdaptive(33),
color: '#ffffff',
},
},
grid: {
left: '10%',
top: '14%',
width: '88%',
height: '75%',
},
xAxis: {
type: 'category',
data: xData,
boundaryGap: true,
splitLine: {
show: false
},
axisLine: {
lineStyle: {
type: 'solid',
color: 'rgba(77, 101, 129, 0.8)'
},
symbol: ['none', 'arrow'],
symbolSize: [this.WidthAdaptive(10),this.WidthAdaptive(10)],
symbolOffset: this.WidthAdaptive(10)
},
axisTick: {
show: false
},
axisLabel: {
fontSize: this.WidthAdaptive(34),
fontFamily: 'Source Han Sans CN',
fontWeight: 400,
lineHeight: this.WidthAdaptive(54),
color: '#cccccc',
margin: this.WidthAdaptive(18)
},
},
yAxis: {
name: '单位: kwh',
type: 'value',
splitLine: {
lineStyle: {
type: 'dashed',
color: 'rgba(105, 119, 135, 0.6)',
}
},
axisLine: {
show: true,
lineStyle: {
type: 'solid',
color: 'rgba(77, 101, 129, 0.8)'
},
symbol: ['none', 'arrow'],
symbolSize: [this.WidthAdaptive(10),this.WidthAdaptive(10)],
symbolOffset: this.WidthAdaptive(10)
},
axisTick: {
show: false,
},
axisLabel: {
fontSize: this.WidthAdaptive(32),
fontFamily: 'Source Han Sans CN',
fontWeight: 400,
lineHeight: this.WidthAdaptive(54),
color: '#cccccc'
},
nameGap: this.WidthAdaptive(30),
nameTextStyle: {
fontSize: this.WidthAdaptive(32),
fontFamily: 'Source Han Sans CN',
fontWeight: 400,
lineHeight: this.WidthAdaptive(54),
color: '#cccccc',
},
},
series: [{
data: yData,
type: 'line',
areaStyle: {
color: {
type: 'linear',
x: 0,
y: 0,
x2: 0,
y2: 1,
colorStops: [{
offset: 0,
color: 'rgba(22, 119, 255, 0.3)' // 0% 处的颜色
}, {
offset: 1,
color: 'rgba(22, 119, 255, 0)' // 100% 处的颜色
}],
global: false // 缺省为 false
}
},
lineStyle: {
color: '#1677FF',
width: this.WidthAdaptive(6),
},
symbol: 'circle',
symbolSize: this.WidthAdaptive(24),
itemStyle: {
color: '#1677FF',
borderColor: '#ffffff',
borderType: 'solid',
borderWidth: this.WidthAdaptive(5),
},
emphasis: {
scale: true,
lineStyle: {
width: this.WidthAdaptive(6),
}
},
z:2
},
{
type: 'bar',
data: yData,
barWidth: this.WidthAdaptive(0.5),
itemStyle: {
color: '#fff',
opacity: 0.2
},
z:1
}
]
}
myChart.setOption(option);
window.onresize = myChart.resize;
}
},
}
</script>
<style scoped>
</style>


 浙公网安备 33010602011771号