<template>
<div id="righttopecharts" style="width: 100%; height: 100%;"></div>
</template>
<script>
export default {
data() {
return {
}
},
mounted() {
this.myecharts();
this.WidthAdaptive();
},
watch: {
},
methods: {
WidthAdaptive(res) {
var windth = window.innerWidth;
let fontSize = windth / 5280;
return fontSize * res;
},
myecharts() {
let myChart = this.$echarts.init(document.getElementById('righttopecharts'));
//图表数据
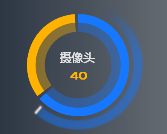
const dataArray = [{
value: 26,
name: '在线设备',
},
{
value: 14,
name: '离线设备',
}
]
// 计算总数
const list = []
let total = dataArray.reduce((p, v) => {
list.push(v.value)
return p + v.value
}, 0)
const color = ['rgba(22, 119, 255, 1)', 'rgba(255, 179, 0, 1)']
const color2 = ['rgba(22, 119, 255, 0.39)', 'rgba(255, 179, 0, 0.39)']
// 设置每层圆环颜色和添加间隔的透明色
let color1 = [];
color.forEach((item) => {
color1.push(item, 'transparent');
});
let data1 = [];
let sum = 0;
// 根据总值设置间隔值大小
dataArray.forEach((item) => {
sum += Number(item.value);
});
//计算数组中为零个数
const countOccurences = (arr, value) => arr.reduce((a, v) => v === value ? a + 1 : a + 0, 0);
const nums = countOccurences(list, 0);
// 给每个数据后添加特定的透明的数据形成间隔
if (nums < 1) {
dataArray.forEach((item, index) => {
if (item.value !== 0) {
data1.push(item, {
name: '',
value: sum / 90,
labelLine: {
show: false,
lineStyle: {
color: 'transparent',
},
},
itemStyle: {
color: 'transparent',
},
});
} else if (item.value == 0) {
data1.push(item);
}
});
} else {
dataArray.forEach((item, index) => {
data1.push(item);
});
}
// 绘制图表
var option = {
series: [
{
type: 'pie',
zlevel: 2,
hoverAnimation: false,
legendHoverLink: false,
radius: ['68%', '80%'],
center: ['50%', '50%'],
itemStyle: {
normal: {
color: (params) => {
if (params.data.name == "在线设备") {
return color[0];
}else if (params.data.name == "离线设备") {
return color[1];
}else {
return color1[params.dataIndex];
}
}
},
},
label: {
show: true,
position: 'center',
formatter: function(params) {
return '{color|摄像头} \n {dark|' + total + '}';
},
rich: {
dark: {
fontSize: this.WidthAdaptive(36),
fontFamily: 'PangMenZhengDao',
fontWeight: 400,
lineHeight: this.WidthAdaptive(41),
color: '#FFB300'
},
color: {
fontSize: this.WidthAdaptive(36),
fontFamily: 'Source Han Sans CN',
fontWeight: 400,
lineHeight: this.WidthAdaptive(63),
color: '#E3E3E3'
}
},
},
emphasis: {
label: {
show: false
}
},
labelLine: {
show: false,
},
data: data1
},
{
type: 'pie',
zlevel: 1,
cursor: 'default',
hoverAnimation: false,
legendHoverLink: false,
radius: ['55%', '80%'],
center: ['50%', '50%'],
itemStyle: {
normal: {
color: (params) => {
if (params.data.name == "在线设备") {
return color2[0];
}else if (params.data.name == "离线设备") {
return color2[1];
}else {
return color1[params.dataIndex];
}
}
},
},
label: {
show: false
},
emphasis: {
label: {
show: false
}
},
labelLine: {
show: false,
},
tooltip: {
show: false,
},
data: data1
}
],
}
myChart.setOption(option);
window.onresize = myChart.resize;
}
}
}
</script>
<style scoped>
</style>


 浙公网安备 33010602011771号