作业二
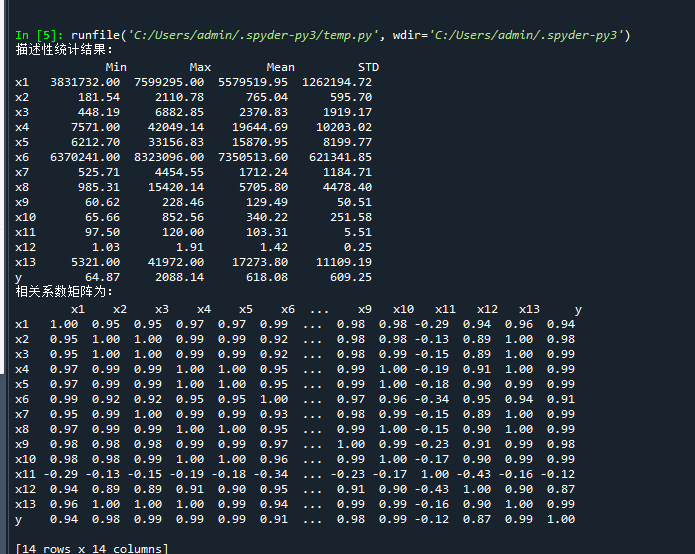
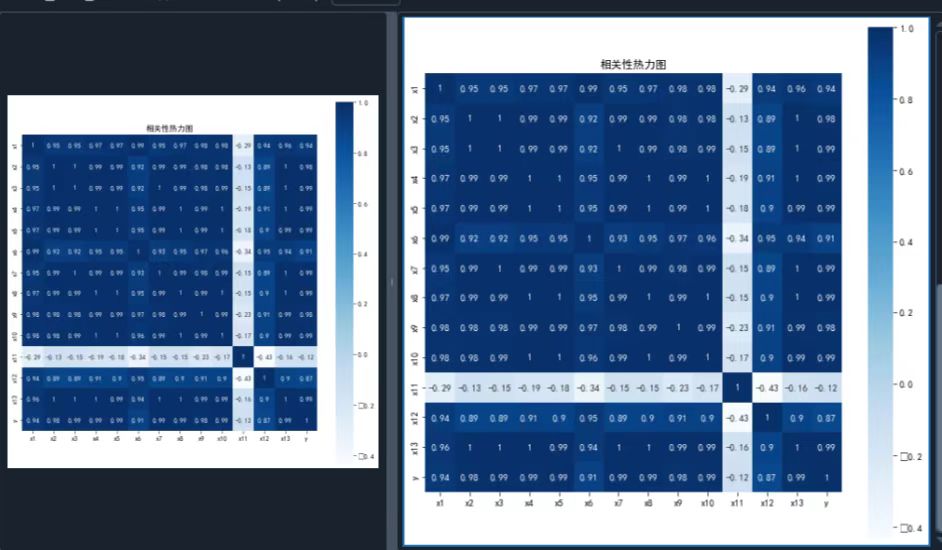
#-*- coding: utf-8 -*-

# 代码6-1

import numpy as np
import pandas as pd

inputfile = r'C:\Users\86184\Desktop\文件集\data/data.csv' # 输入的数据文件
data = pd.read_csv(inputfile) # 读取数据

# 描述性统计分析
description = [data.min(), data.max(), data.mean(), data.std()]  # 依次计算最小值、最大值、均值、标准差
description = pd.DataFrame(description, index = ['Min', 'Max', 'Mean', 'STD']).T  # 将结果存入数据框
print('描述性统计结果:\n',np.round(description, 2))  # 保留两位小数


# 代码6-2

# 相关性分析
corr = data.corr(method = 'pearson')  # 计算相关系数矩阵
print('相关系数矩阵为:\n',np.round(corr, 2))  # 保留两位小数
# -*- coding: utf-8 -*-
"""
Created on Wed Mar  1 16:17:12 2023

@author: 86184
"""

import sys
sys.path.append(r'C:\Users\86184\Desktop\文件集\data\code')  # 设置路径
import numpy as np
import pandas as pd
from GM11 import GM11  # 引入自编的灰色预测函数

inputfile1 = r'C:\Users\86184\Desktop\文件集\data\new_reg_data.csv'  # 输入的数据文件
inputfile2 = r'C:\Users\86184\Desktop\文件集\data\data.csv'  # 输入的数据文件
new_reg_data = pd.read_csv(inputfile1)  # 读取经过特征选择后的数据
data = pd.read_csv(inputfile2)  # 读取总的数据
new_reg_data.index = range(1994, 2014)
new_reg_data.loc[2014] = None
new_reg_data.loc[2015] = None
l = ['x1', 'x3', 'x4', 'x5', 'x6', 'x7', 'x8', 'x13']
for i in l:
  f = GM11(new_reg_data.loc[range(1994, 2014),i].values)[0]
  new_reg_data.loc[2014,i] = f(len(new_reg_data)-1)  # 2014年预测结果
  new_reg_data.loc[2015,i] = f(len(new_reg_data))  # 2015年预测结果
  new_reg_data[i] = new_reg_data[i].round(2)  # 保留两位小数
outputfile = r'C:\Users\86184\Desktop\文件集\data\new_reg_data_GM11.csv'  # 灰色预测后保存的路径
y = list(data['y'].values)  # 提取财政收入列,合并至新数据框中
y.extend([np.nan,np.nan])
new_reg_data['y'] = y
new_reg_data.to_csv(outputfile)  # 结果输出
print('预测结果为:\n',new_reg_data.loc[2014:2015,:])  # 预测结果展示


 浙公网安备 33010602011771号